可让你快速查询运行中的 Windows 机器以获取内存(RAM)取证数据
此工具利用 Winpmem 驱动访问物理内存,并使用 Volatility 进行分析。
注意事项:
目前支持以下插件:
usage: memtriage.exe [-h] [--unload] [--load] [--debug] [--service SERVICE]
                     [--output OUTPUT] [--dumpdir DUMPDIR] [--base BASE]
                     [--offset OFFSET] [--memory MEMORY] [--pid PID] [--leave]
                     [--plugins PLUGINS] [--physoffset PHYSOFFSET]
                     [--physical] [--ignore] [--regex REGEX] [--name NAME]
                     [--keepname] [--outfile OUTFILE] [--yararules YARARULES]
                     [--yarafile YARAFILE] [--kernel] [--all] [--case]
                     [--wide] [--size SIZE] [--reverse REVERSE]

Memtriage options:

optional arguments:
  -h, --help            show this help message and exit
  --unload              Unload the driver and exit
  --load                Load the driver and exit
  --debug               Output debug messages while running
  --service SERVICE     Change the service name (default: pmem)
  --output OUTPUT       Output type: json/text/csv
  --dumpdir DUMPDIR     Directory to dump files to
                        (dlldump,procdump,moddump,vaddump,dumpfiles)
  --base BASE           Base of PE file to dump (dlldump,procdump,moddump)
  --offset OFFSET       Physical offset of process to act on
                        (dlldump,procdump,moddump,vaddump,dumpfiles)
  --memory MEMORY       Carve as a memory sample rather than exe/disk
                        (dlldump,procdump,moddump)
  --pid PID             Operate on this process ID
  --leave               Leave pmem service running with driver
  --plugins PLUGINS     Comma delimited list of plugins to run: apihooks atoms
                        cmdline dlldump dlllist driverirp dumpfiles envars
                        getsids handles ldrmodules malfind moddump modules
                        netscan privs procdump pslist psxview shimcachemem
                        svcscan vaddump vadinfo verinfo volshell yarascan
  --physoffset PHYSOFFSET
                        Dump File Object at physical address PHYSOFFSET
                        (dumpfiles)
  --physical            Display the physical address of object
                        (pslist,handles,modules)
  --ignore              Ignore case in pattern match (dumpfiles,verinfo)
  --regex REGEX         Dump files matching REGEX (dumpfiles,driverirp,privs)
  --name NAME           Name of process/object to operate on
  --keepname            Keep original file name (dumpfiles)
  --outfile OUTFILE     Combined output file (default: stdout)
  --yararules YARARULES
                        Yara rule given on the commandline (yarascan)
  --yarafile YARAFILE   Yara rules given as a file (yarascan)
  --kernel              Scan kernel memory (yarascan)
  --all                 Scan both process and kernel memory (yarascan)
  --case                Make the search case insensitive (yarascan)
  --wide                Match wide (unicode) strings (yarascan)
  --size SIZE           Size of preview hexdump in bytes (default: 256)
                        (yarascan)
  --reverse REVERSE     Reverse [REVERSE] number of bytes (default: 0)
                        (yarascan)
Memtriage 会尝试自动识别配置文件,并使用相应的设置运行。如果没有完全匹配的配置文件,Memtriage 会尝试使用最接近的可用命名配置文件。因此,对象定义可能无法完全对应(例如进程名称等),这在使用错误的配置文件运行 Volatility 时也可能出现。可以将配置文件添加到 Volatility 代码中,并使用 pyinstaller 重新编译可执行文件。
默认情况下,memtriage.exe 会在首次运行时尝试加载驱动程序,并在退出时卸载它。不过,您可以使用 --load 和 --unload 选项手动加载和卸载驱动程序。您还可以使用 --leave 选项请求在插件运行完毕后保持驱动程序处于加载状态。
> memtriage.exe --leave --plugins=dumpfiles --dumpdir=outdir --physoffset=1066160184 --keepname
默认创建的服务名称为 pmem。你可以使用 --service= 选项指定不同的服务名称。如果你保持驱动加载状态,则后续调用时必须使用该 --service= 选项。示例:
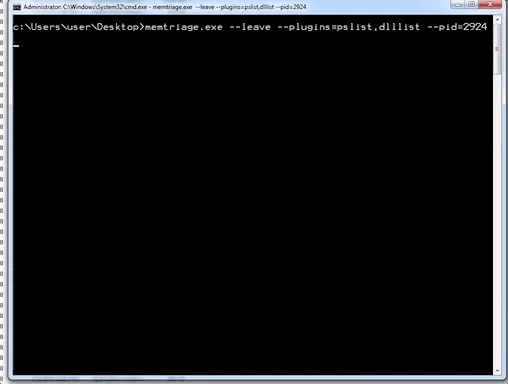
> memtriage.exe --leave --service=somename --plugins=dlllist --pid=2924
[snip]
> memtriage.exe --unload --service=somename
你可以通过 --plugins= 选项以逗号分隔的方式指定多个插件,从而同时运行它们。示例:
> memtriage.exe --plugins=pslist,handles,dlllist
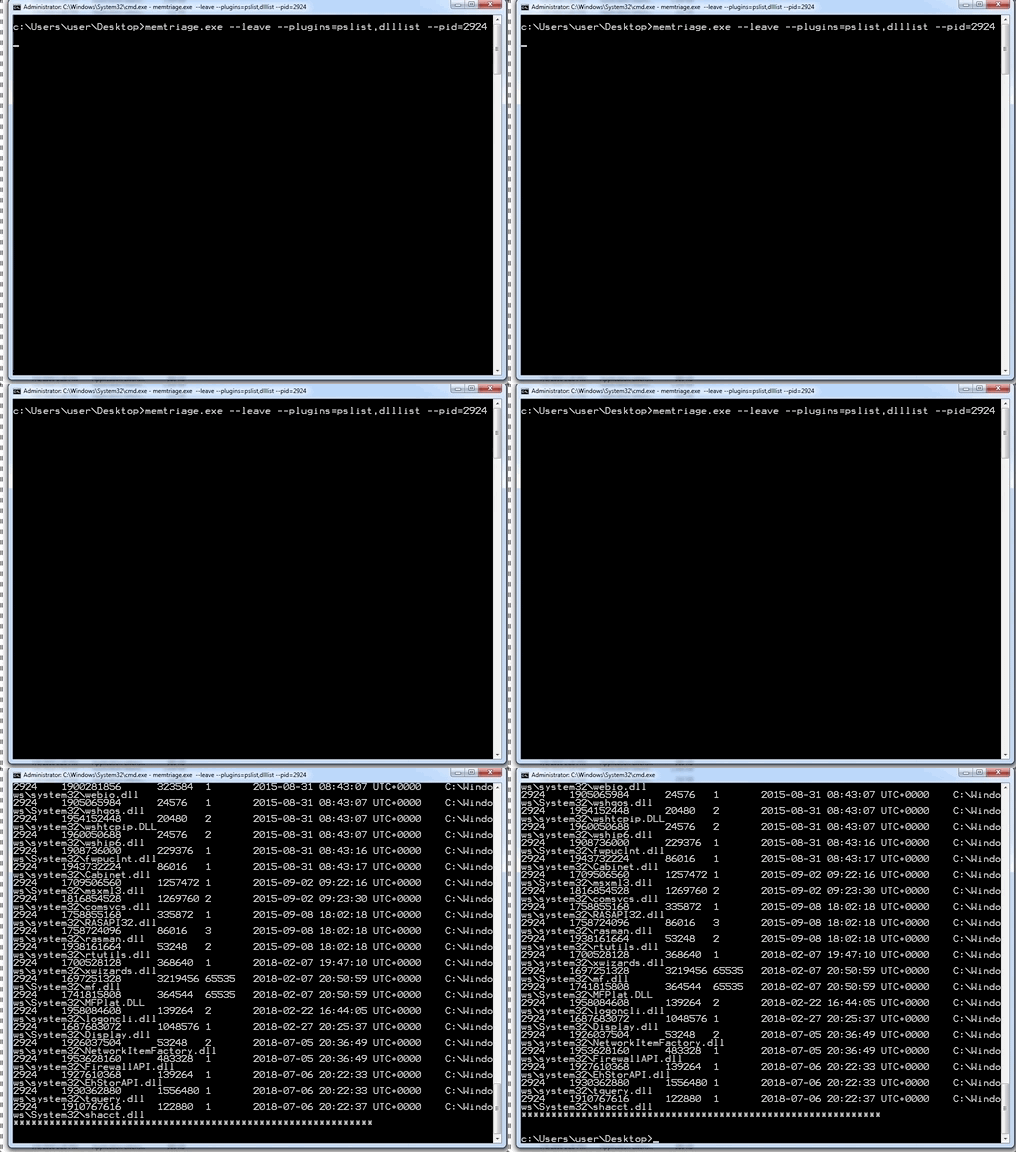
其他选项将用于相应的插件。示例:
> memtriage.exe --plugins=pslist,handles,dlllist,dlldump,dumpfiles,shimcachemem,volshell --outfile=outfile.txt --pid=2924 --dumpdir=outdir --leave --keepname --physoffset=1066160184
你可以在此处找到发布版本,包括一个 pyinstaller 独立可执行文件:https://github.com/gleeda/memtriage/releases