Network diagnostics in your terminal. Inspect traffic, connections and network behaviour. Built with Rust.
Network diagnostics in your terminal.
Linux, macOS, Windows and FreeBSD.


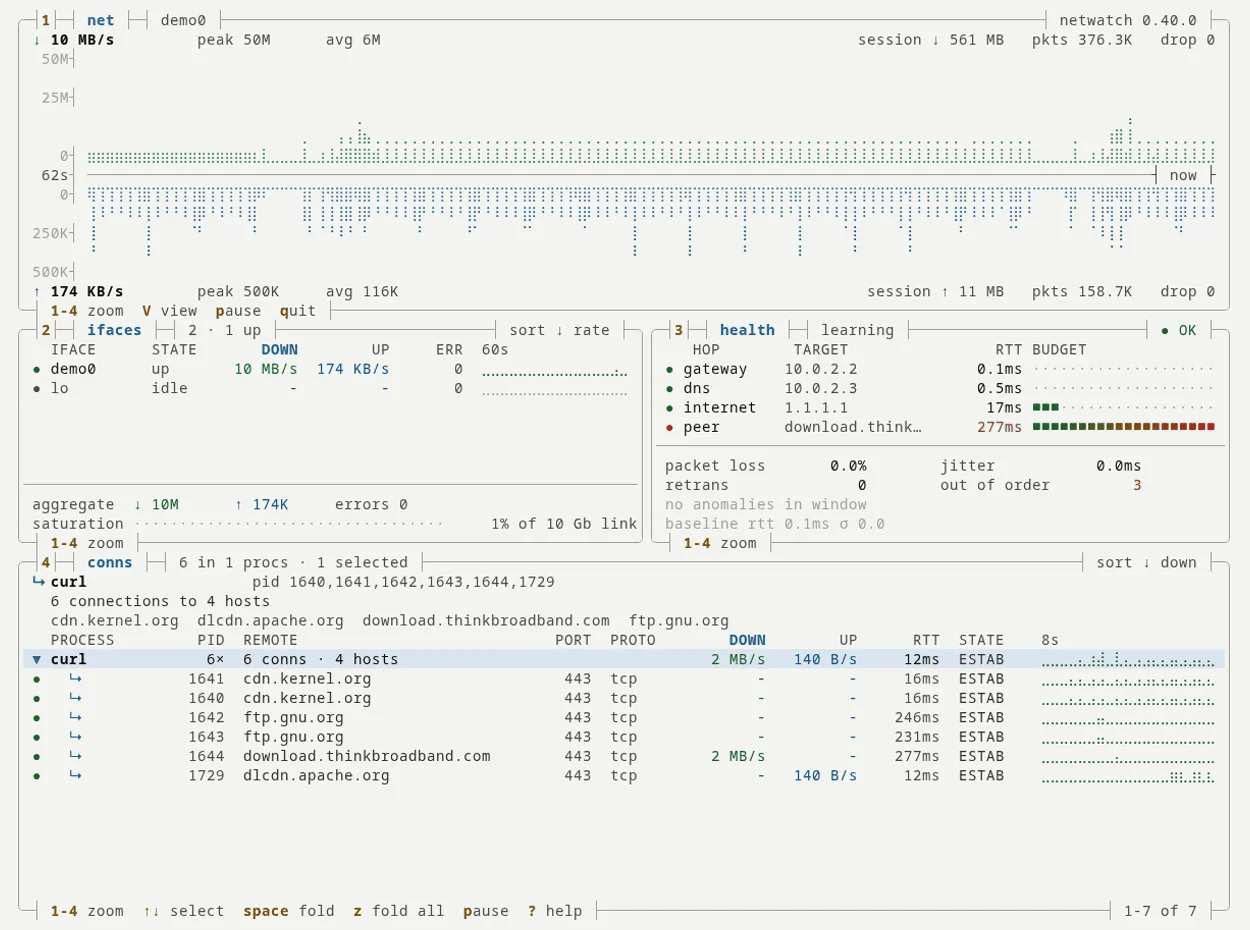
netwatch --view dense. Four boxes, no chrome, every keybind on a border. Download grows up from the axis, upload grows down.
Featured in 35 Self-Hosted Projects on GitHub by Github Awesome.
netwatch shows what your machine is doing on the network: every connection and the process behind it where the OS exposes that, the latency of each hop on the way out, and, with capture permissions, the packets decoded up to the application layer. It is one binary and needs no configuration.
The Diagnose tab is the part most network tools leave to you. It learns what normal looks like on your network, opens an issue when that breaks, ranks the likely causes by the checks each one passed, and closes the issue itself once the fix has held.
netwatch --demo replays this recorded incident through the real engine at 6×. The resolver switch is simulated and touches nothing on your machine; live, netwatch gives you the step to run and closes the issue once its verify condition holds. The rules shown are beta.
brew install netwatch                 # macOS / Linux
scoop install netwatch                # Windows (needs Npcap)
cargo binstall netwatch-tui           # prebuilt binary (needs cargo-binstall)
cargo install netwatch-tui            # build from source, anywhere with Rust
paru -S netwatch-tui                  # Arch (AUR)
nix-shell -p netwatch                 # NixOS / Nix
conda install -c conda-forge netwatch # conda / mamba (Linux, macOS)
The apt repository is signed:
curl -fsSL https://matthart1983.github.io/netwatch/apt/netwatch.gpg \
  | sudo tee /usr/share/keyrings/netwatch.gpg >/dev/null
echo "deb [signed-by=/usr/share/keyrings/netwatch.gpg] \
https://matthart1983.github.io/netwatch/apt stable main" \
  | sudo tee /etc/apt/sources.list.d/netwatch.list
sudo apt update && sudo apt install netwatch
Fedora: sudo dnf copr enable matthart1983/netwatch && sudo dnf install netwatch
Container: docker run --rm -it --net=host --pid=host --cap-add=NET_RAW ghcr.io/matthart1983/netwatch
Binaries for macOS, Linux (x86_64, aarch64, armv5te), FreeBSD (x86_64) and
Windows are on the
releases page, with
.deb, .rpm, checksums and signed provenance. The Linux builds are static and
need nothing installed; Windows needs Npcap.
The FreeBSD binary needs FreeBSD 13 or newer; on anything older, build from
source with cargo install netwatch-tui.
Verifying a download ·
every channel.
Packet capture needs elevated access. On Linux, grant cap_net_raw,cap_bpf,cap_perfmon+eip to a binary restricted to a netwatch group, or run the systemd unit. sudo netwatch works, but as root the sandbox is defence in depth only and containment is limited. See the threat model.
netwatch              # interfaces, connections, config. No privileges.
sudo netwatch         # works; root containment is limited
netwatch --lite       # one 80x24 screen
netwatch --view dense # four boxes, 130x44 or larger
netwatch --demo       # replay a recorded Diagnose incident, no capture needed
1 to 9 and 0 switch tabs, V cycles the three views, ? shows every key.
netwatch doctor                          # what netwatch can see on this host, and why not
netwatch diagnose run --budget 30s       # one bounded diagnosis; exit 0 clean, 1 issue, 2 no evidence
netwatch diagnose run --format json      # the same, for scripts
netwatch daemon --metrics                # headless; Prometheus /metrics on 127.0.0.1:9464
netwatch uptime --since 7d               # outages this week: when, how long, and which hop failed
netwatch geoip update                    # download the offline GeoIP databases
daemon runs the same collectors with no screen; a systemd unit and a launchd agent ship with it, and Prometheus export lists the metrics. --remote URL with NETWATCH_API_KEY streams snapshots to a backend you run. Both stay accepted through 1.x, and what they do is experimental: the wire format may change. So are AI Insights, netwatch resolver set and recover, and the JSON in PCAPNG packet comments: what that covers. Every command and flag.