AI-first reverse-engineering toolkit: static analysis, SSA decompiler, live memory, provenance. Source-available (PolyForm Noncommercial).
From a hardware watchpoint in a live process to the decompiled statement that wrote the value.
Memory scanners find the address. Decompilers explain the code. N0xis takes you from one to the other in one scriptable loop.
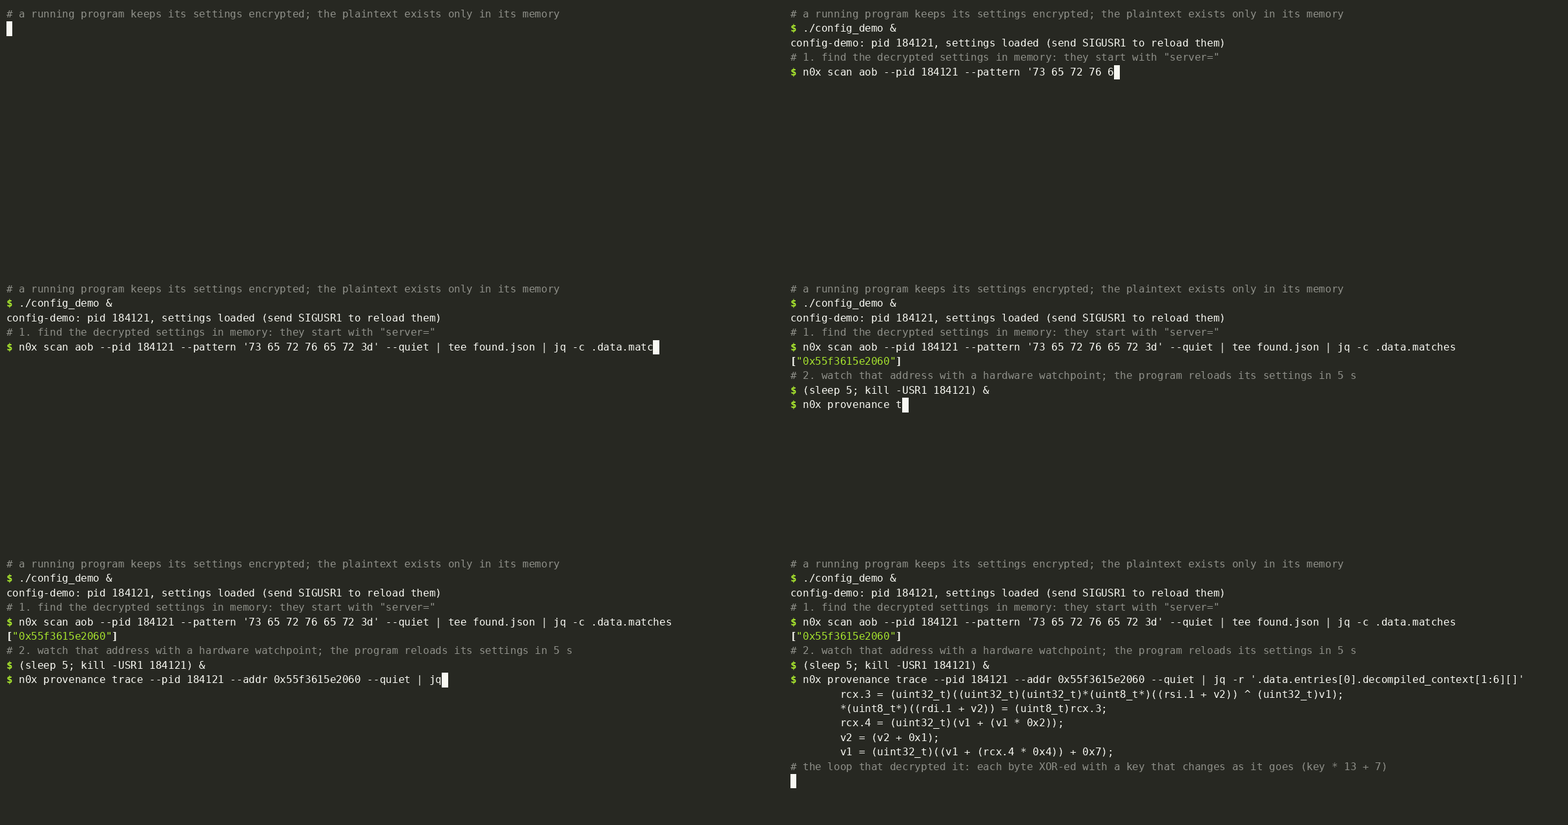
A real run of examples/config-demo: a program keeps its settings encrypted and decrypts them into memory; find the plaintext, arm a hardware watchpoint on it, and get the decompiled code that wrote it. Rerun it yourself with demo.sh.
$ n0x provenance trace --pid 181529 --addr 0x564e32cb7060 --kind write
"instruction_va": "0x564e32cb4266",   // the byte store that wrote the watched address
"function_va": "0x564e32cb4230",      // the function it sits in, auto-resolved
"decompiled_context": [
  "rcx.3 = (uint32_t)((uint32_t)(uint32_t)*(uint8_t*)((rsi.1 + v2)) ^ (uint32_t)v1);",
  "*(uint8_t*)((rdi.1 + v2)) = (uint8_t)rcx.3;",   // ← the write
  "rcx.4 = (uint32_t)(v1 + (v1 * 0x2));",
  "v2 = (v2 + 0x1);",
  "v1 = (uint32_t)((v1 + (rcx.4 * 0x4)) + 0x7);"
]
In the source this is the loop config[i] = sealed[i] ^ key; key = key * 13 + 7;: the
decompiled key update, v1 + (v1 * 2) * 4 + 7, is the same key * 13 + 7. The answer gives
addresses, not the names config and decrypt_config: names of globals and functions from the
binary's symbols are not carried into it yet. The run above is on Linux; the live loop runs on
Windows too.
The watchpoint hit is resolved through the same SSA pipeline that decompiles the file, so the answer is the statement that wrote the value and the function it sits in, as JSON a script can act on. It is meant to sit next to the disassembler and decompiler you already use, not to replace them.
Prebuilt binaries for Linux and Windows — latest release.
curl -LO https://github.com/Structio-labs/N0xis/releases/latest/download/n0xis-linux-x86_64
chmod +x n0xis-linux-x86_64 && ./n0xis-linux-x86_64 --version
Or build it: cargo build --workspace --release (Windows and Linux; no MSVC Build Tools
needed — rust-toolchain.toml pins the gnu host).
Every command prints one JSON object — argument errors included: {"ok":true,"data":…,"meta":…} or
{"ok":false,"error":…}. Add --pretty to read it; the exit code is non-zero on failure.
n0x doctor                                                    # environment check
n0x profile --file app.exe                                    # triage: sections, exports, runtime hints
n0x function discover --file app.exe --pdata                 # exact .pdata discovery
n0x decomp pseudo --file app.exe --addr 0x140012a00 --style ssa --pretty
n0x provenance trace --pid 4821 --addr 0x1a2b3c40 --kind write --pretty
The same commands run on a live --pid, a static --file, a captured --snapshot, or a
remote process over SSH. It is ordinary Unix plumbing —
n0x function discover --file app.exe --pdata | jq -r '.data.functions[].va' feeds the next
command. n0x guide lists all 117 commands, generated from the binary so it never drifts — and a test
fails the build if this number does.
From an agent: point any MCP client at n0xis-mcp — 25 tools returning the identical
{ok,data,meta} envelope, JSON-RPC over stdio.
{ "mcpServers": { "n0xis": { "command": "/path/to/n0xis-mcp" } } }
--explain: which sub-pass changed what, at which address), not a black-box answer..rdata chains and Itanium
_ZTV symbols), .NET NativeAOT RVA ↔ Namespace.Type.Method, and a few runtime formats
(LuaJIT bytecode, Bitsquid, IL2CPP), so a stripped image reads as source, not sub_XXXX..n0xt tables, versioned annotations, content-addressed caching,
function/version diffing.Windows and Linux, PE and ELF, one pipeline — static files, live processes, snapshots and remote targets all flow through the same passes and the same versioned JSON.
There is no ML nondeterminism in the core, ever. A desktop GUI lives in a separate repo: n0xis-gui.
Alpha. Every claim below is a measurement against a source outside the tool — the kernel, the image's own tables, or the target process itself. Where there is no such source, it says so, because implemented and verified are not the same claim.
Live memory, against a disposable target that plants known values:
/proc/<pid>/mem, one wrong and fixed. The
other two are Windows-only and refuse saying so. The one wrong was scan dissect, which
chose a field's width before its alignment and so read a struct four bytes out of phase from
its first mistake on: one field of six right against a layout known from its own source, five
of six after.ui focus correctly finds no window on a console target; stack backtrace is
Linux-only — the one place the Linux adapter is ahead.The decoder, against an independent disassembler — the floor everything else stands on, and until now checked only by the passes built on top of it, which all read the same stream:
objdump. Three purpose-built shapes exact,
20 000 instructions of a shared library and 20 000 of a 32-bit system DLL, zero
disagreements and zero boundaries either side had alone. Widened to 60 000 instructions
of a 334 MB stripped browser binary: 2 disagreements, both inside an ASCII string embedded
in .text where the reference itself decodes (bad) — not code, and neither reading is
the right one.llvm-objdump (fixed-width encodings make boundaries
vacuous). See the ARM64 line below.llvm-mc --mattr=+all and by n0xis. 241 both call an instruction, 304 both reject —
and 48 (8.0%) are reserved encodings n0xis reads as instructions, with 7 (1.2%) real
instructions it rejects (mostly LSE atomics). Three of the 48 were decoded by hand and are
genuinely UNALLOCATED. That gap is held by a bound that fails if it grows, and stated
here rather than left out: a reserved word read as an instruction turns data into a
plausible program.Function extents, against the image's own unwind table and the linker's export list:
start..end from objdump --dwarf=frames equal to the recovered extent —
3 787 compared on this machine (10 + libc's 3 777), start and end, exact; separately
measured at 15 467 and 14 355 on two large libraries.