Z2A-BlackLotus 挑战赛第 2 阶段 bootkit-rootkit 分析

BlackLotus 阶段 2 bootkit-rootkit 分析
在我们深入探讨这个神圣的玩意儿之前(相信我,这确实是某种神圣的玩意儿,因为没有人能在没有上帝旨意的情况下做到这件事(至少我是这么认为的)),这里是 bootkit 文件的哈希值

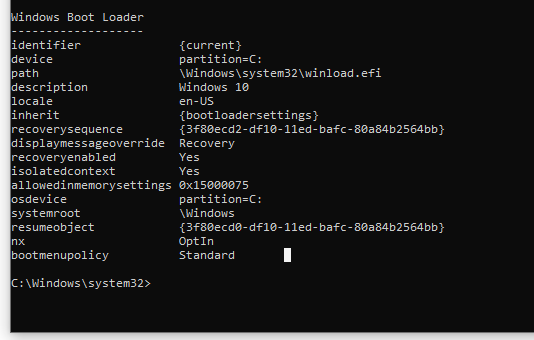
首先,这是一个健康系统的样子
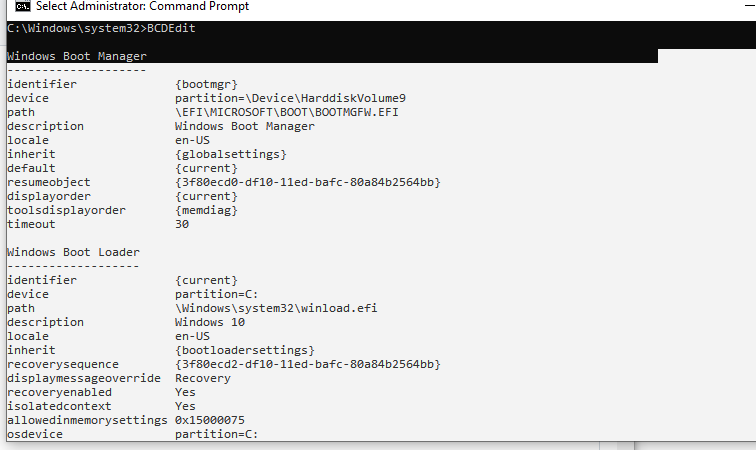
identifier {bootmgr} device partition=\Device\HarddiskVolume9 path \EFI\MICROSOFT\BOOT\BOOTMGFW.EFI description Windows Boot Manager locale en-US inherit {globalsettings} default {current} resumeobject {3f80ecd0-df10-11ed-bafc-80a84b2564bb} displayorder {current} toolsdisplayorder {memdiag} timeout 30
identifier {current} device partition=C: path \Windows\system32\winload.efi description Windows 10 locale en-US inherit {bootloadersettings} recoverysequence {3f80ecd2-df10-11ed-bafc-80a84b2564bb} displaymessageoverride Recovery recoveryenabled Yes isolatedcontext Yes allowedinmemorysettings 0x15000075 osdevice partition=C: systemroot \Windows resumeobject {3f80ecd0-df10-11ed-bafc-80a84b2564bb} nx OptIn bootmenupolicy Standard
现在说到我的分析,我从未成功感染过我的机器,因此我将使用前面提到的亚洲研究员的博客文章中的示例,这就是感染后应有的样子。```
    // Windows Boot Manager
    // --------------------
    // identifier              {9dea862c-5cdd-4e70-acc1-f32b344d4795}
    // description             Windows Boot Manager
    // locale                  en-US
    // inherit                 {7ea2e1ac-2e61-4728-aaa3-896d9d0a9f0e}
    // bootdebug               Yes
    // displayorder            {57e1b615-0355-11ec-abb0-005056c00008}
    // timeout                 30

    // Windows Boot Loader
    // -------------------
    // identifier              {57e1b615-0355-11ec-abb0-005056c00008}
    // device                  boot
    // path                    \system32\hvloader.efi
    // description             Hoy la disco se flota
    // locale                  en-US
    // inherit                 {6efb52bf-1766-41db-a6b3-0ee5eff72bd7}
    // truncatememory          0x10000000
    // avoidlowmemory          0x1000
    // nointegritychecks       Yes
    // testsigning             Yes
    // isolatedcontext         Yes
    // osdevice                boot
    // systemroot              \
    // ems                     Yes
=============================================================================
=============================================================================
在我们开始之前,到底如何为分析 EFI 模块搭建环境呢?这要感谢 @MaverickMusic__,在一次与他的讨论中,他给了我这样一个链接( https://zhuanlan-zhihu-com.translate.goog/p/343293521?_x_tr_sl=auto&_x_tr_tl=en&_x_tr_hl=en-GB )。我并没有完全照搬那里的步骤,下面是我为了把环境跑起来所实际做的:
-首先,我安装了 edk2(https://github.com/tianocore/tianocore.github.io/wiki/Windows-systems)
-其次,我将 ovmf 配置为 debug 构建而不是 release 构建(这对我们后面有帮助)。我用到的命令是 build -a X64 -t VS2019 -b DEBUG -p OvmfPkg/OvmfPkgX64.dsc
-第三,我不得不配置我的 windbg。我到底是怎么做到的呢?我从这个链接下载了所有东西(git clone https://github.com/microsoft/WinDbg-Samples)。然后我编译了 ExdiGdbSrv.sln。接着我完全按照这个链接(https://learn.microsoft.com/en-us/windows-hardware/drivers/debugger/setting-up-qemu-kernel-mode-debugging-using-exdi)上的内容,从它所说的 Use regsvr32 to register the DLL in an Administrator command prompt. 一直到 PS>.\Start-ExdiDebugger.ps1 -ExdiTarget "QEMU" -GdbPort 1234 -Architecture x64 -ExdiDropPath "C:\path\to\built\exdi\files"。我知道这很让人困惑,但请耐心等待,我一定会制作一个视频,逐步解释每一步!
好了,既然我们已经搭好了调试环境,那到底该如何调试代码呢?所以我们要启动 qemu,就我而言,我是通过执行 qemu-system-x86_64.exe -L . -bios OVMF.fd -hdd dos.img -debugcon file:debug.log -global isa-debugcon.iobase=0x402 来启动的。运行 qemu 命令后,我立即进入 qemu 的视图菜单并选择了 compat_monitor0。完成这些操作后,你应该会看到类似下面的样子。
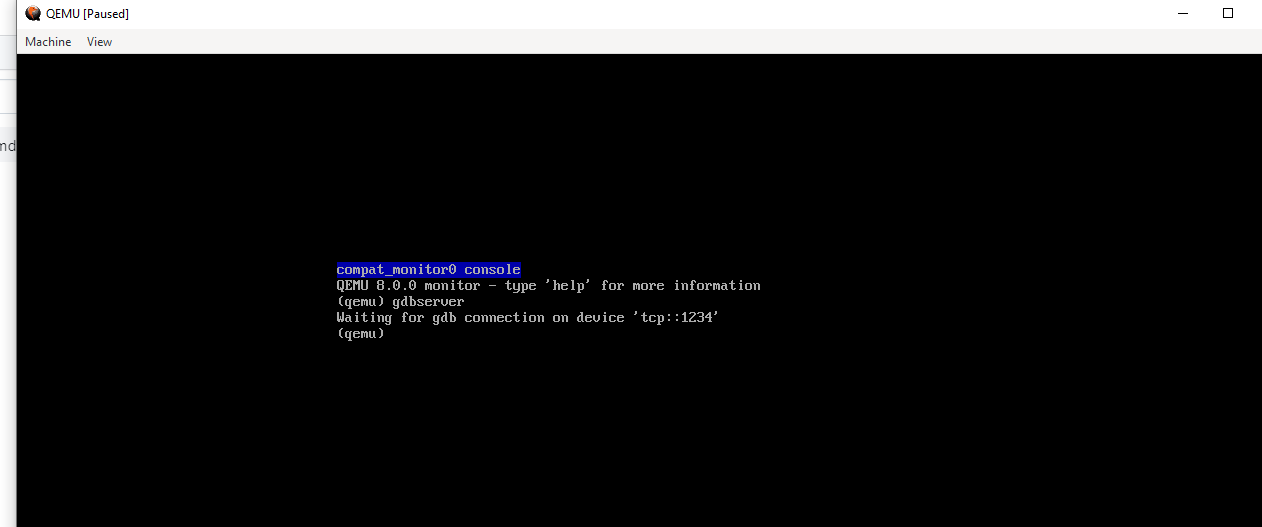
另外,在选择这个之后,你应该输入 gdbserver 来启动一个 gdb 远程调试实例,之后我们将用 windbg 通过以下命令附加到该实例:.\Start-ExdiDebugger.ps1 -ExdiTarget "QEMU" -GdbPort 1234 -Architecture x64。好了,一旦我们连接上去,就会看到下面这样:
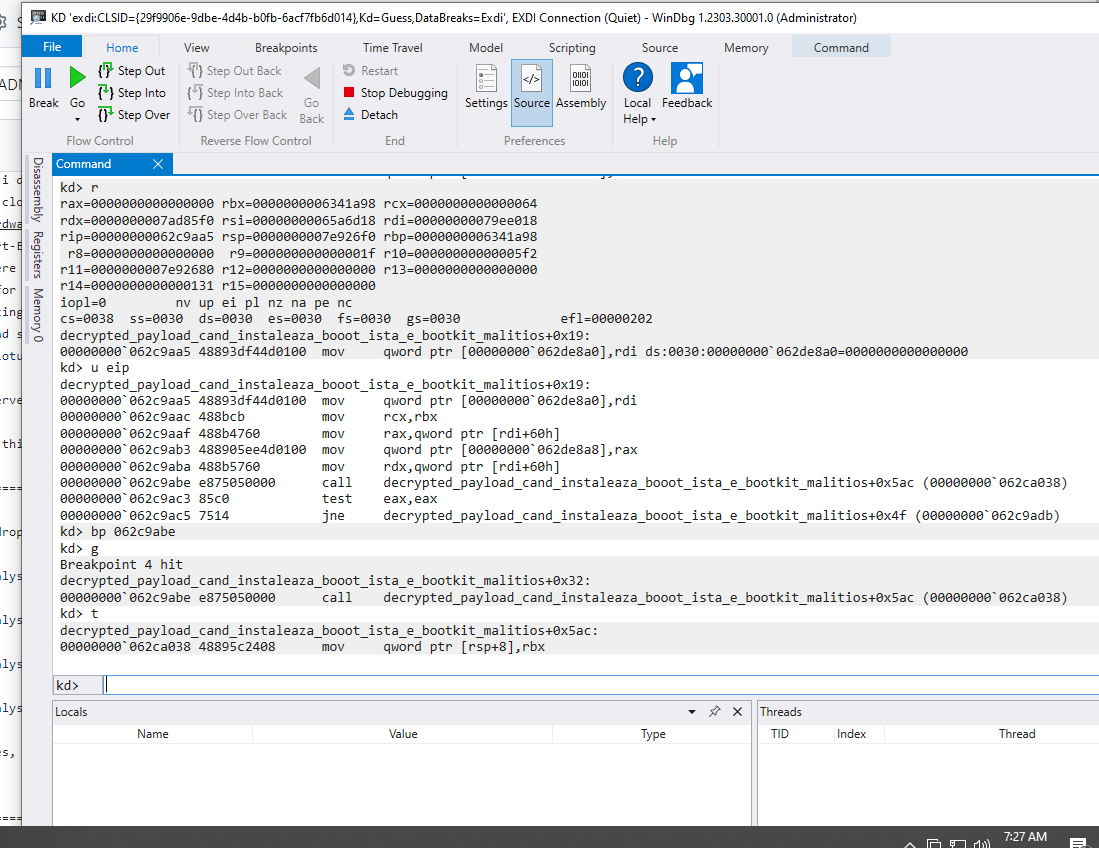
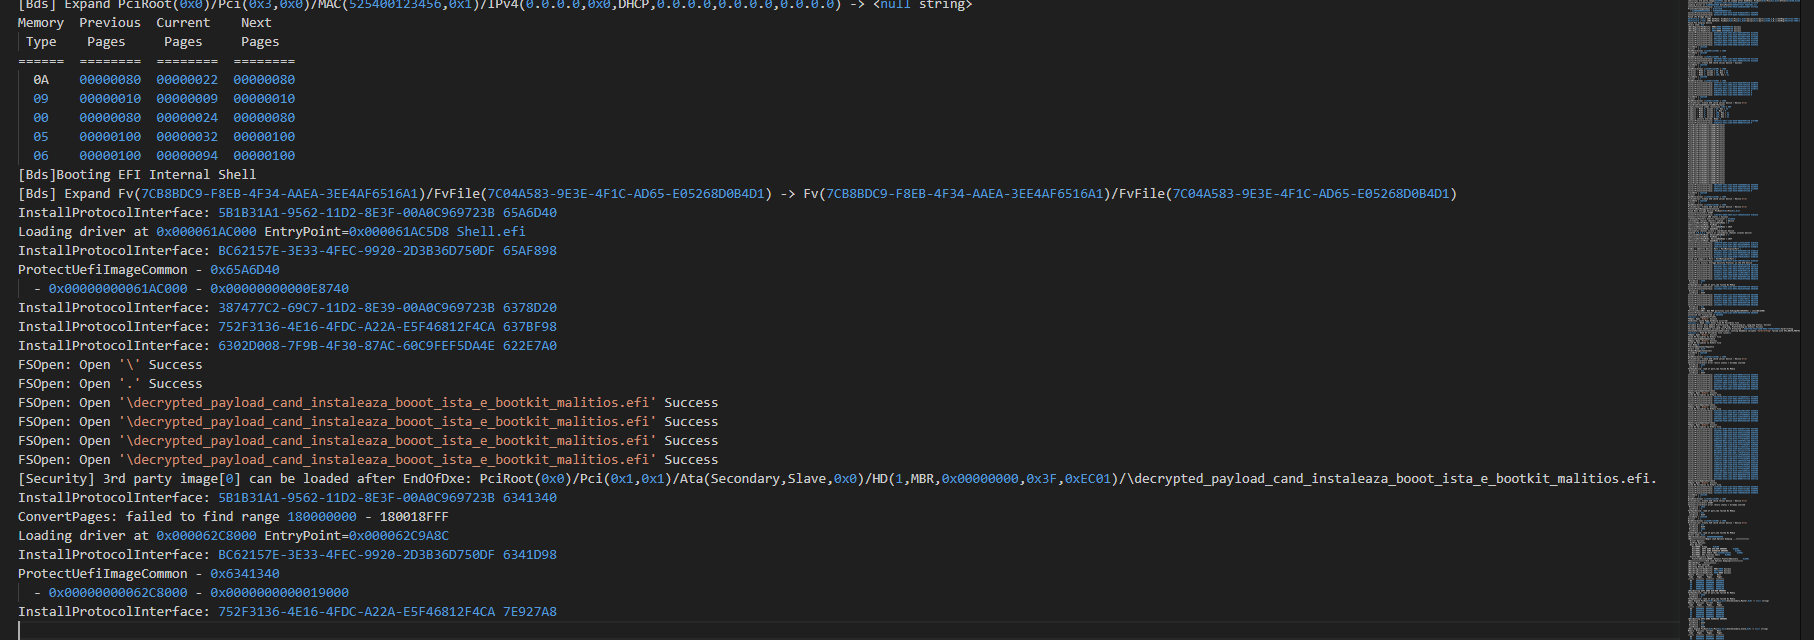
太酷了,现在来理解这个输出。就我们的情况而言,唯一相关的行是 EntryPoint=0x000062C9A8C,它类似于我们运行 bootkit 时首选的加载地址。具体来说,对于该 bootkit,它在 0x62C4A8C 或 0x62C9A8C 之间变化。现在我们可以在 ida 中重新基址程序,然后进行正常工作 :) 。尽情享受博客的其余内容吧!
=============================================================================
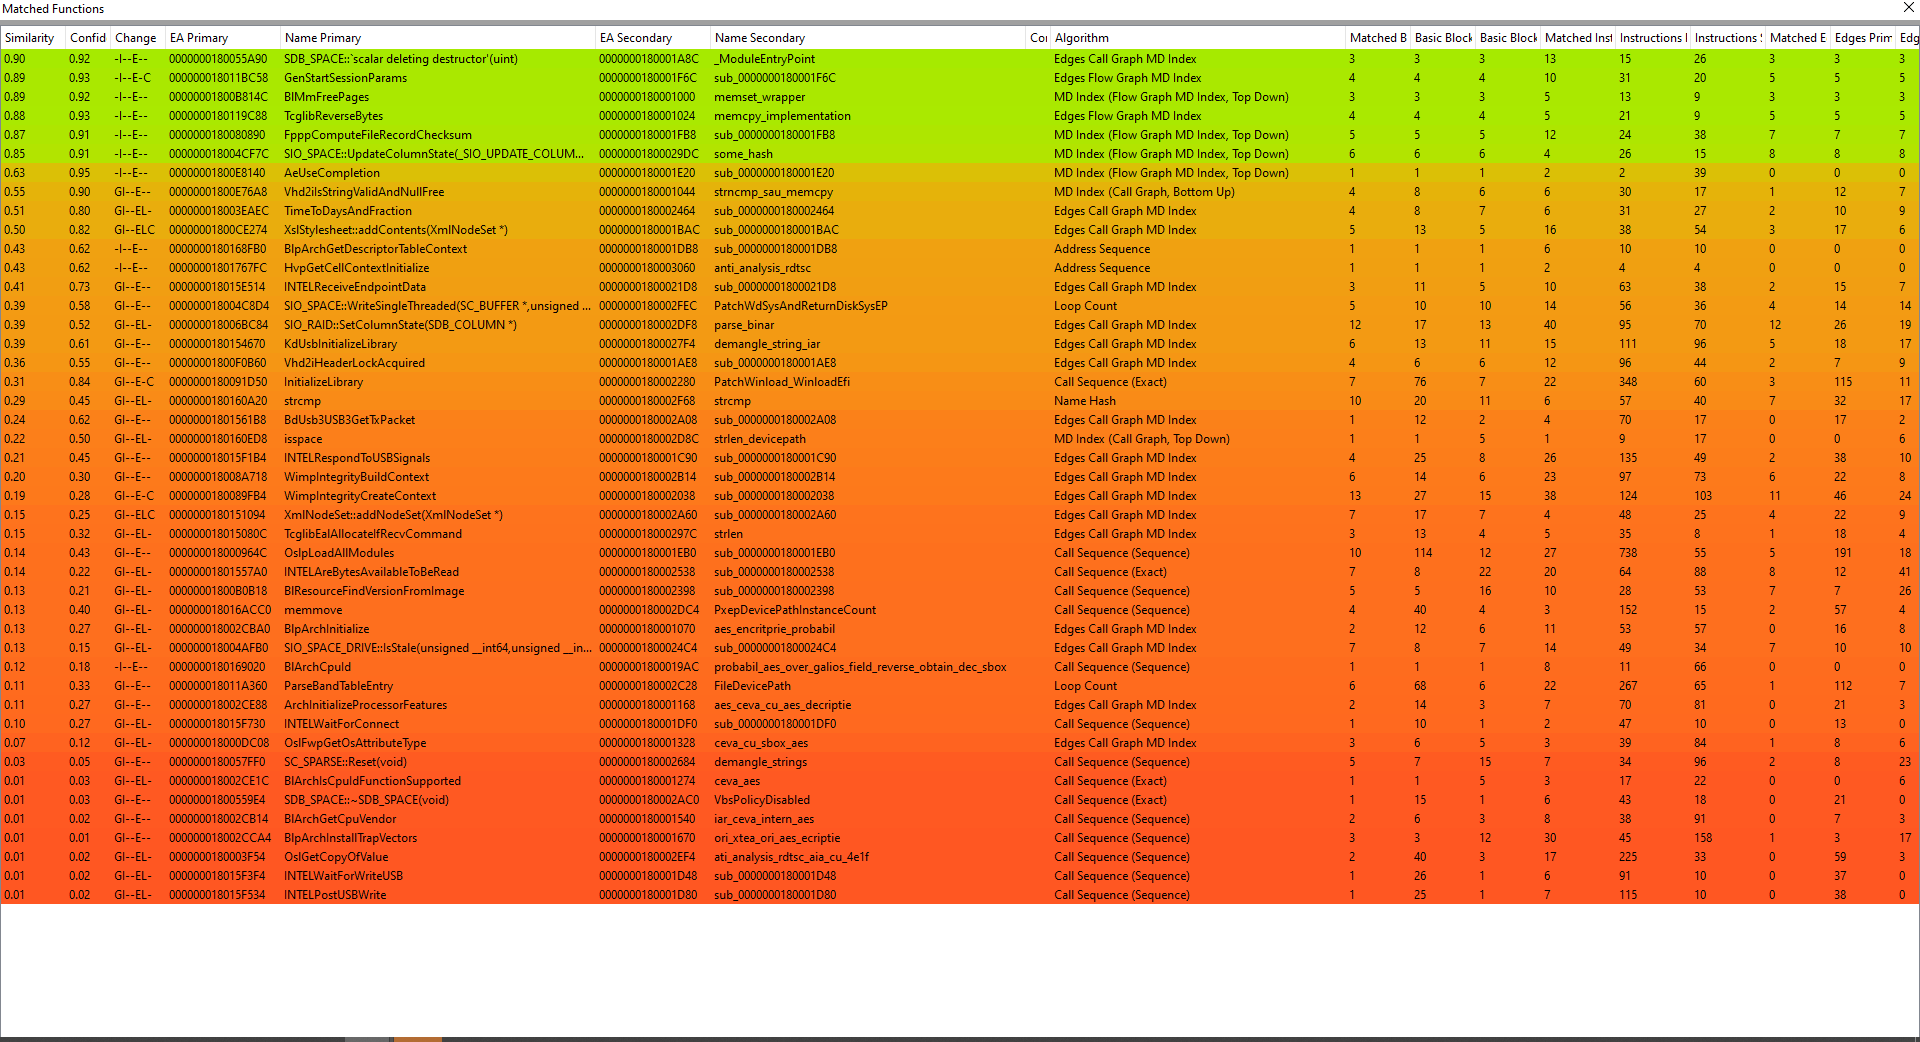
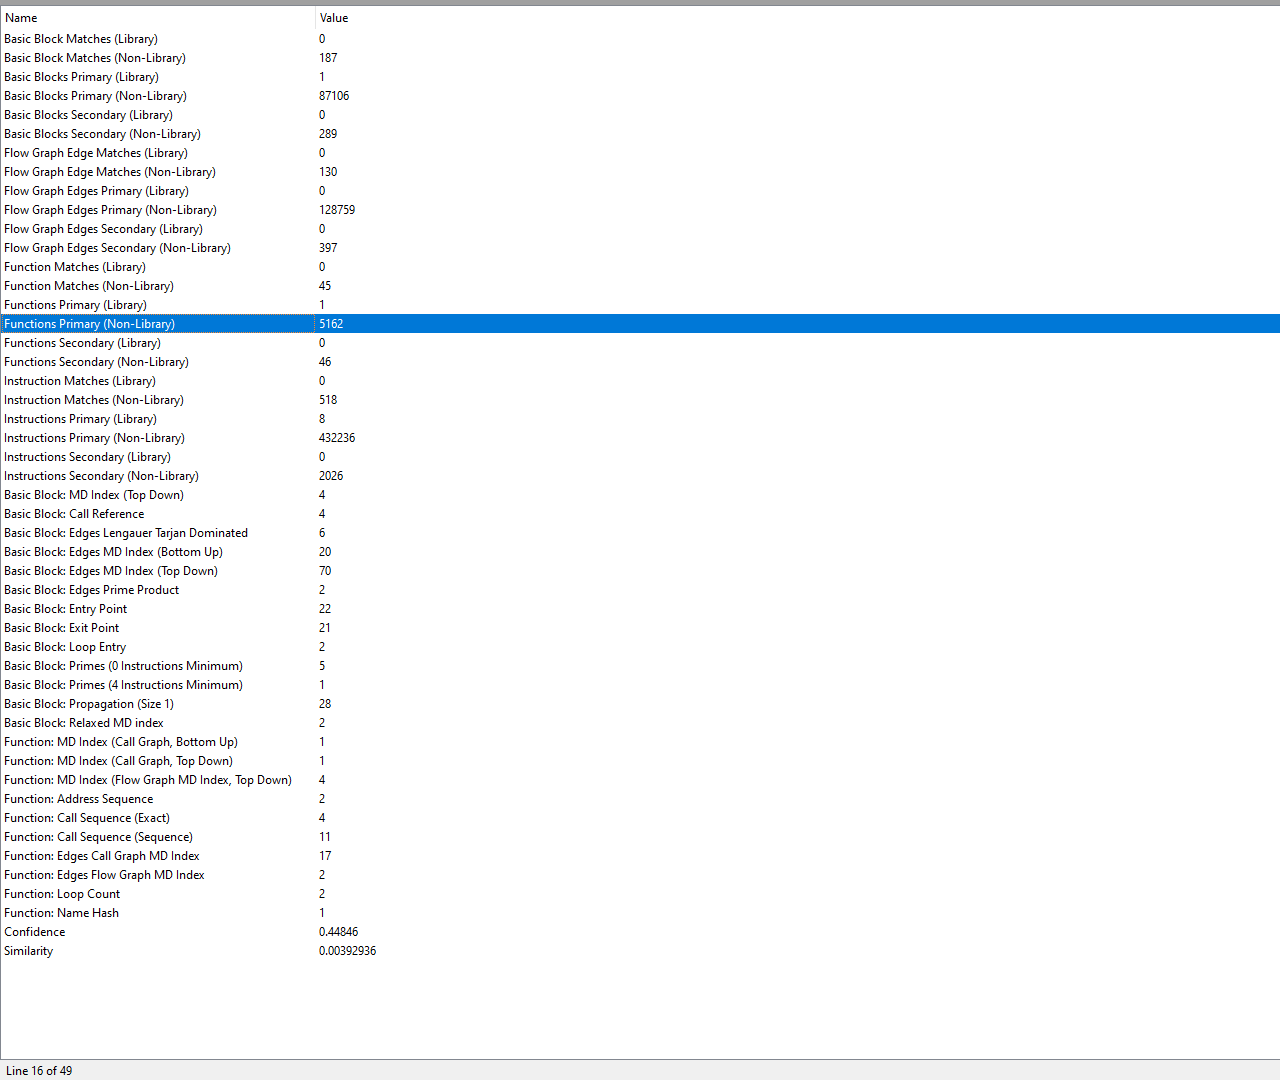
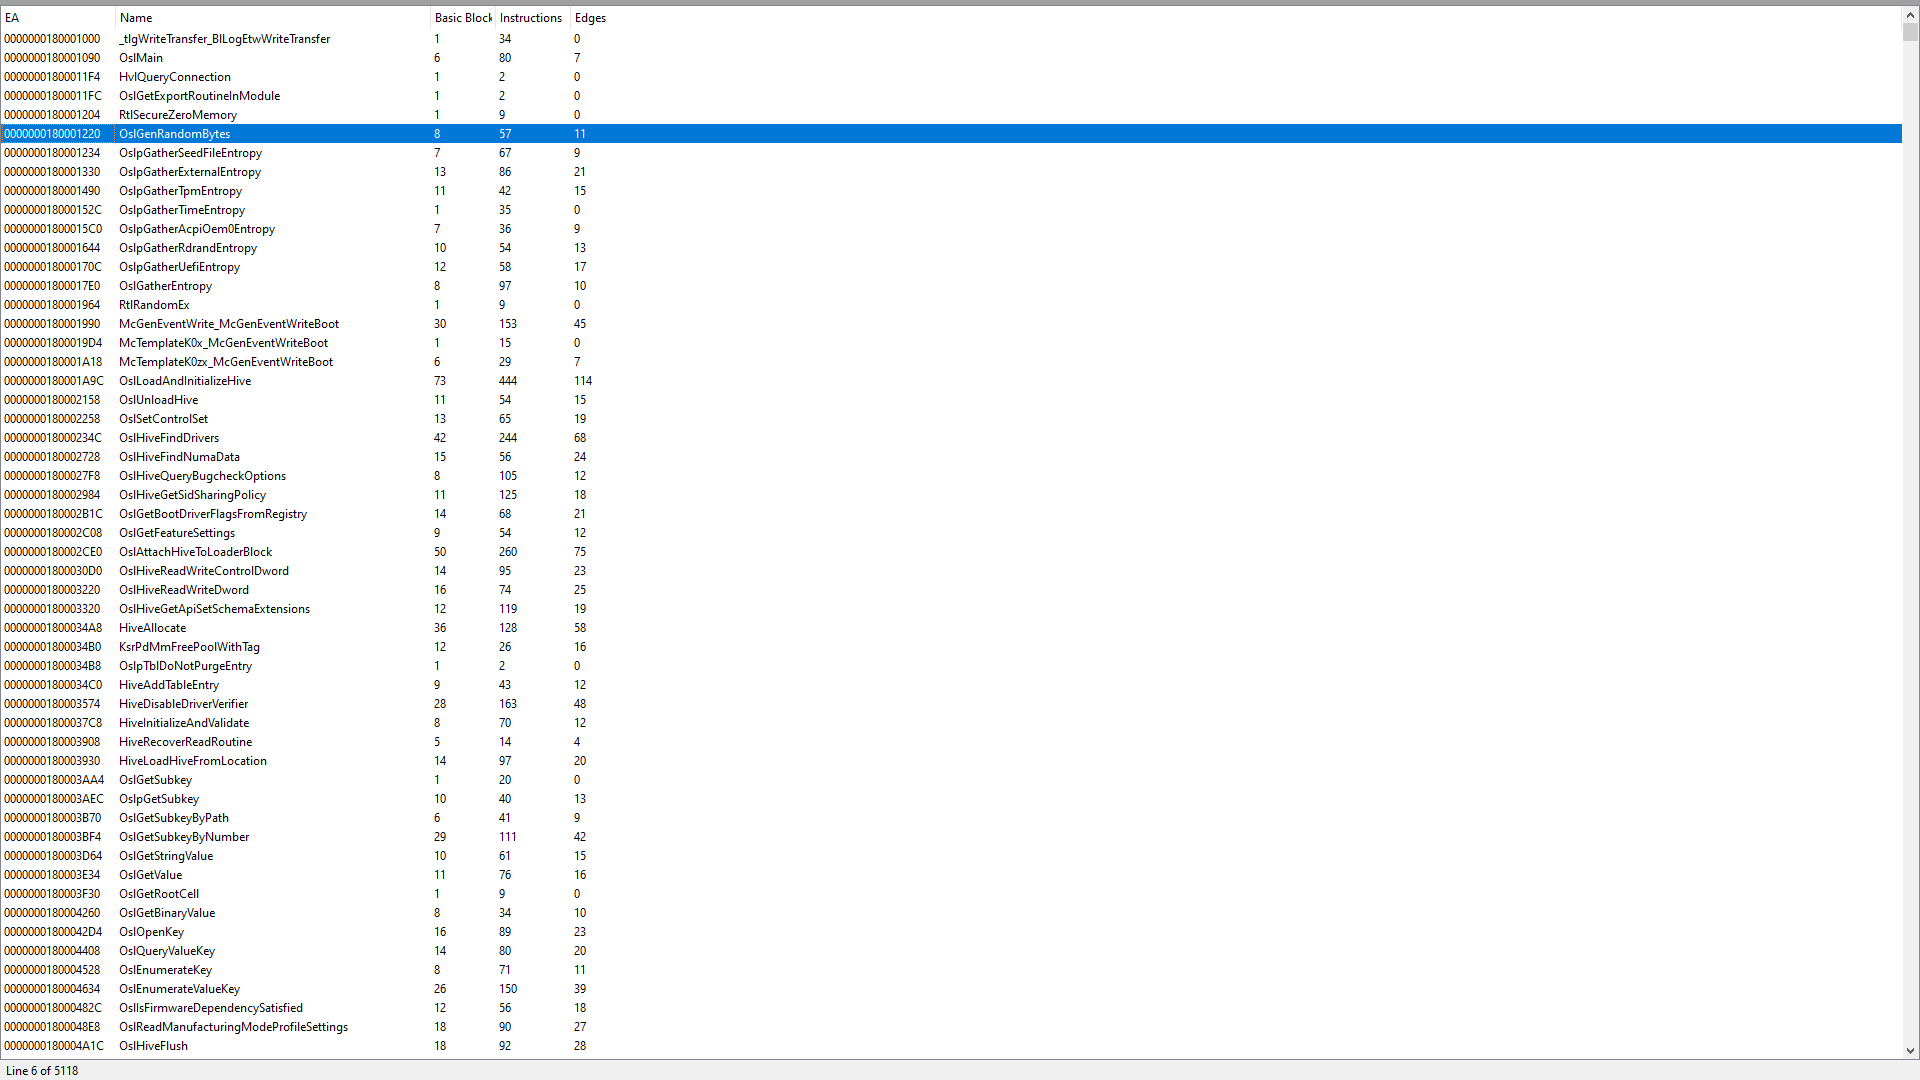
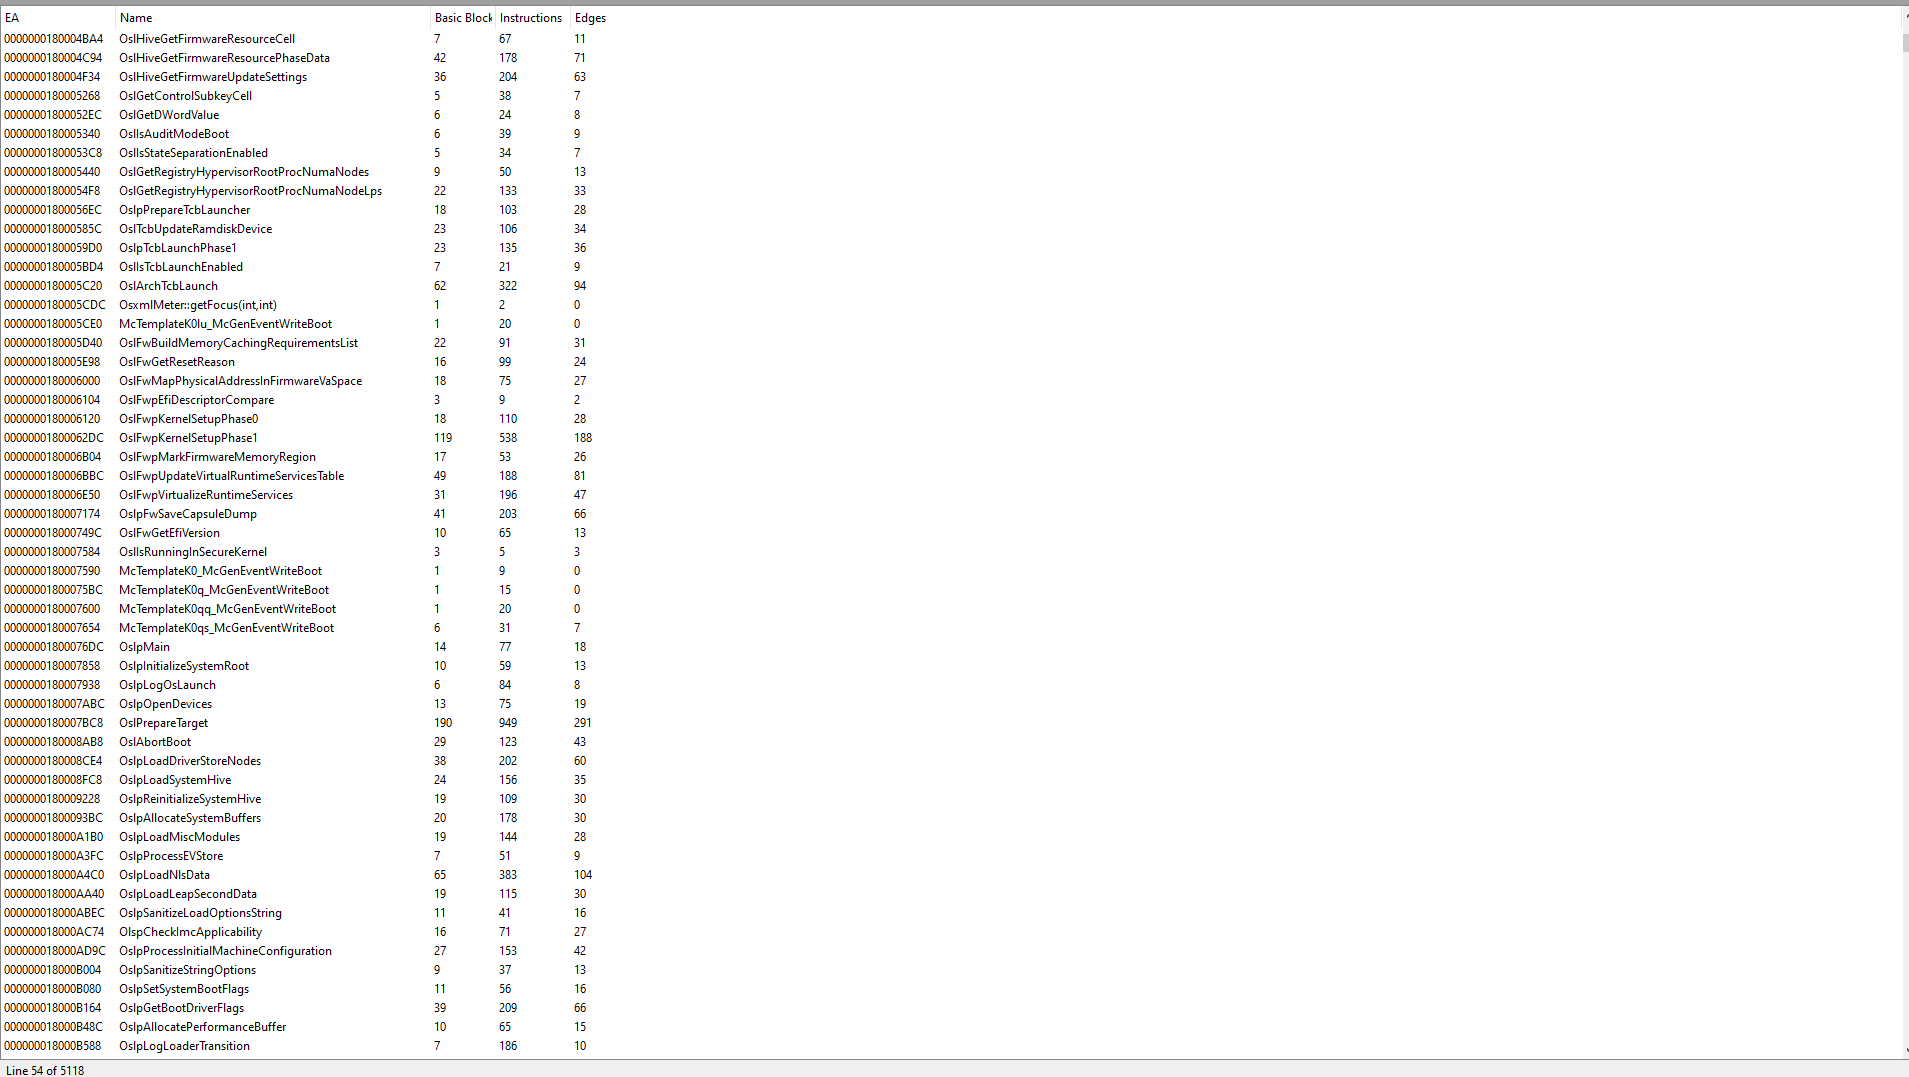
将原始 winload.efi 与 blacklotus 释放的那个进行 BinDiff 比较
 ```
```