 melonattacker/logira
OS-level runtime auditing for unpredictable automation.

OS-level runtime auditing for unpredictable automation.
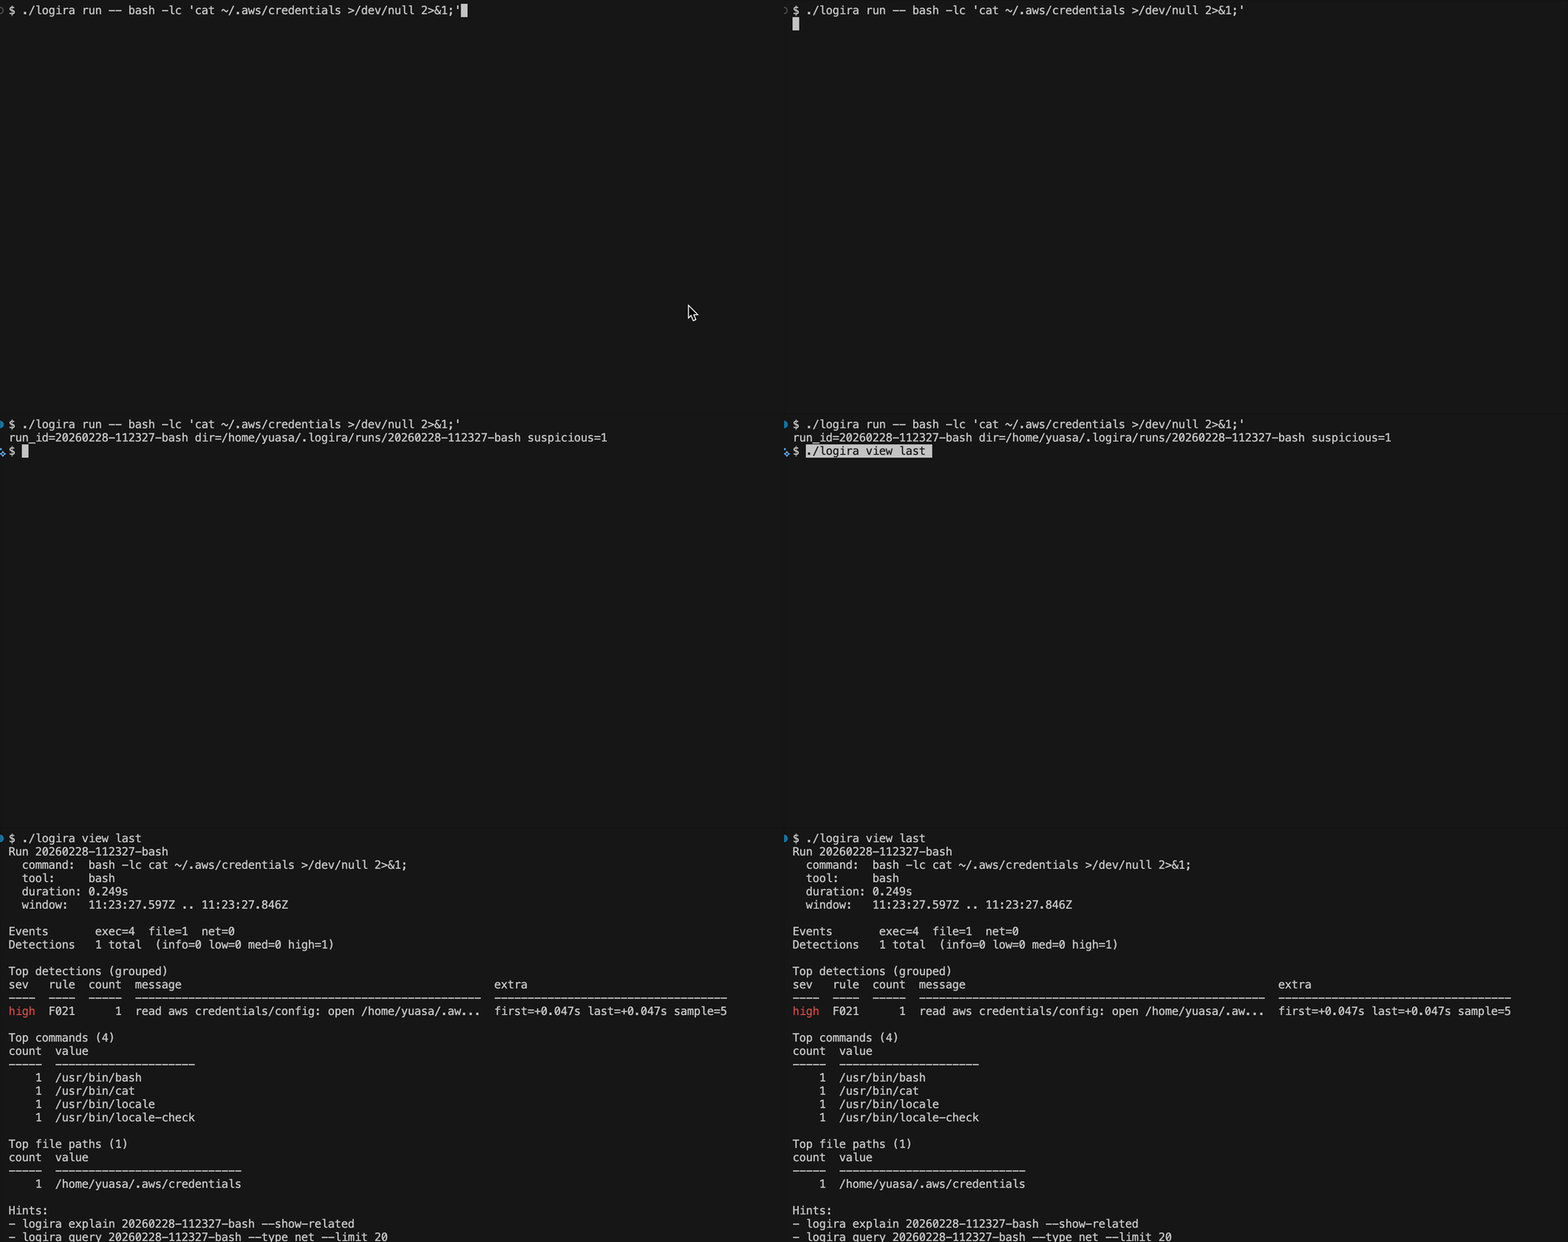
logira is an observe-only Linux CLI that records runtime exec, file, and net events via eBPF. It helps you see what actually happened during AI agent runs and other forms of automation, with per-run local storage for auditing, post-run review, search, and detection triage.
codex --yolo or claude --dangerously-skip-permissions).logira includes an opinionated, observe-only default ruleset aimed at auditing AI agent runs.
You can also append your own per-run rules YAML with logira run --rules <file>.
~/.ssh, ~/.aws, kube/gcloud/docker config, .netrc, .git-credentials, registry creds..netrc, .git-credentials./etc, systemd units, cron, user autostart entries, shell startup files./tmp, /dev/shm, /var/tmp.curl|sh, wget|sh, tunneling/reverse shell tools and flags, base64 decode with shell hints.rm -rf, git clean -fdx, find -delete, mkfs, terraform destroy, and similar commands.Option1. Install via the convenicent script:
curl -fsSL https://raw.githubusercontent.com/melonattacker/logira/main/install.sh | sudo bash
Option2. Manual install from a release tarball:
tar -xzf logira_vX.Y.Z_linux-<arch>.tar.gz
cd logira_vX.Y.Z_linux-<arch>
sudo ./install-local.sh
After reinstall / upgrade:
install.sh runs systemctl enable --now).logirad to ensure the new binary is running.sudo systemctl daemon-reload
sudo systemctl restart logirad.service
sudo systemctl status logirad.service --no-pager
Build:
make build
Start the root daemon (required for tracing):
sudo ./logirad
To run the root daemon in the background, install the unit file from packaging/systemd/logirad.service.
# 1) Generate eBPF objects (only needed if missing)
make generate

# 2) Install the systemd unit
sudo install -D -m 0644 packaging/systemd/logirad.service /etc/systemd/system/logirad.service

# 3) Install the daemon binary (unit defaults to /usr/local/bin/logirad)
sudo install -m 0755 ./logirad /usr/local/bin/logirad

# 4) (Recommended) Point systemd at the eBPF .o files via an environment file.
# This avoids relying on the service working directory.
sudo mkdir -p /etc/logira
sudo tee /etc/logira/logirad.env >/dev/null <<'EOF'
LOGIRA_EXEC_BPF_OBJ=/absolute/path/to/collector/linux/exec/trace_bpfel.o
LOGIRA_NET_BPF_OBJ=/absolute/path/to/collector/linux/net/trace_bpfel.o
LOGIRA_FILE_BPF_OBJ=/absolute/path/to/collector/linux/filetrace/trace_bpfel.o
EOF

# 5) Enable + start
sudo systemctl daemon-reload
sudo systemctl enable --now logirad

# Follow logs
sudo journalctl -u logirad -f

# Check status
systemctl status logirad --no-pager

# Stop + disable
sudo systemctl stop logirad
sudo systemctl disable --now logirad
Run an agent under audit as your normal user (events are auto-saved):
./logira run -- bash -lc 'echo hi > x.txt; curl -s https://example.com >/dev/null'
./logira run --rules ./my-rules.yaml -- bash -lc 'cat ~/.aws/credentials >/dev/null'
Run Codex CLI:
./logira run -- codex --yolo "Update the README to be clearer and add examples."
Run Claude Code CLI:
./logira run -- claude --dangerously-skip-permissions "Find and fix flaky tests."
List runs:
./logira runs
View and explain the last run:
./logira view last
./logira view last --ts both
./logira view last --color always
./logira explain last
./logira explain last --show-related
./logira explain last --drill 35
./logira report last
./logira report last --exec-seq 12
Query events:
./logira query last --type detection
./logira query last --type net --dest 140.82.121.4:443
./logira query last --related-to-detections --type net
./logira query last --contains curl
logira run -- <command...>: run a command under audit and auto-save a new runlogira runs: list saved runslogira view [last|<run-id>]: run dashboard (use --raw for legacy text)logira query [last|<run-id>] [filters...]: search events with type-specific table outputlogira explain [last|<run-id>]: grouped detections by default (--show-related, --drill)logira episode [last|<run-id>] --exec-seq <seq> [--json]: reconstruct one observed execution lineagelogira report [last|<run-id>] [--exec-seq <seq>]: generate a standalone offline HTML audit reportA Run contains the capture session's retained observations. A Process Graph reconstructs observed task identities and relationships within that Run. An Execution Episode selects one exec and follows its observed descendants, including fork-only tasks and later executable replacements.
./logira query last --type exec
./logira episode last --exec-seq 12
./logira episode last --exec-seq 12 --json
Episodes report attributable file/network evidence and explicitly separate uncertain, unrelated, and unattributable observations. Ancestors and siblings do not become members. Missing ancestry or empty activity does not prove inactivity. This is offline, general-purpose OS analysis, independent of agent runtimes and without security or intent judgments.
See Episode identity, attribution, counting, and JSON semantics for the stable output format, legacy limitations, and a shell/descendant example.
Generate a Run Overview without selecting an execution:
./logira report last
Select an observed exec sequence to add its Execution Episode:
./logira query last --type exec
./logira report last --exec-seq 12 --output ./audit.html
Reports are single offline HTML files with embedded CSS and no external runtime dependencies. They preserve Episode attribution and uncertainty boundaries, show capture limitations, and include CLI handoffs to retained source events. They may contain sensitive commands, paths, and network destinations.