
Skip to content
KitploitKITPLOIT
ツールエクスプロイトブログ
Log in
提出
ツールエクスプロイトブログ
提出

ハッキング、侵入テスト、サイバーセキュリティツールをあなたのセキュリティアーセナルに!

Kitploitはハッキング、サイバーセキュリティ、ペネトレーションテストのツールディレクトリです。最新のプロジェクトアップデートを見つけて、脆弱性の発見、システム分析、テストの自動化、セキュリティの強化を行いましょう。

フィードお問い合わせプライバシー© 2026 Kitploit

ツールディレクトリ

カテゴリ

すべてのカテゴリを見る
Loading categories
nightingale — Open-source alerting engine for time-series monitoring data. Connects to Prometheus, VictoriaMetrics, ElasticSearch, and other data sources. Supports 20+ notification channels, alert noise reduction, escalation, and self-healing automation. | Kitploit
ツール/GitHubGitHub/ccfos/nightingale
DevSecOpsIncident Response
GitHubccfos/nightingale

nightingale

Open-source alerting engine for time-series monitoring data. Connects to Prometheus, VictoriaMetrics, ElasticSearch, and other data sources. Supports 20+ notification channels, alert noise reduction, escalation, and self-healing automation.


リポジトリを見るウェブサイト
13.2k1.8k1151日前Kitploit レビュー済み
共有
要求された言語のコンテンツは利用できません。英語版を表示しています。

Nightingale

Open-source alerting for your existing stack

Latest release Go Reference Coverage status Apache-2.0 license GitHub stars Docker pulls Join the Nightingale Slack community

Quick start · Documentation · Download · Releases · Community

English | 中文 | 日本語

Nightingale brings alert rules, event processing, and notification routing into one place. Connect Prometheus, VictoriaMetrics, Elasticsearch, Loki, ClickHouse, and other data sources you already run, then deliver alerts to Slack, PagerDuty, and your team's existing tools.

Self-hosted · Apache-2.0 · Built-in AI agent · MCP server
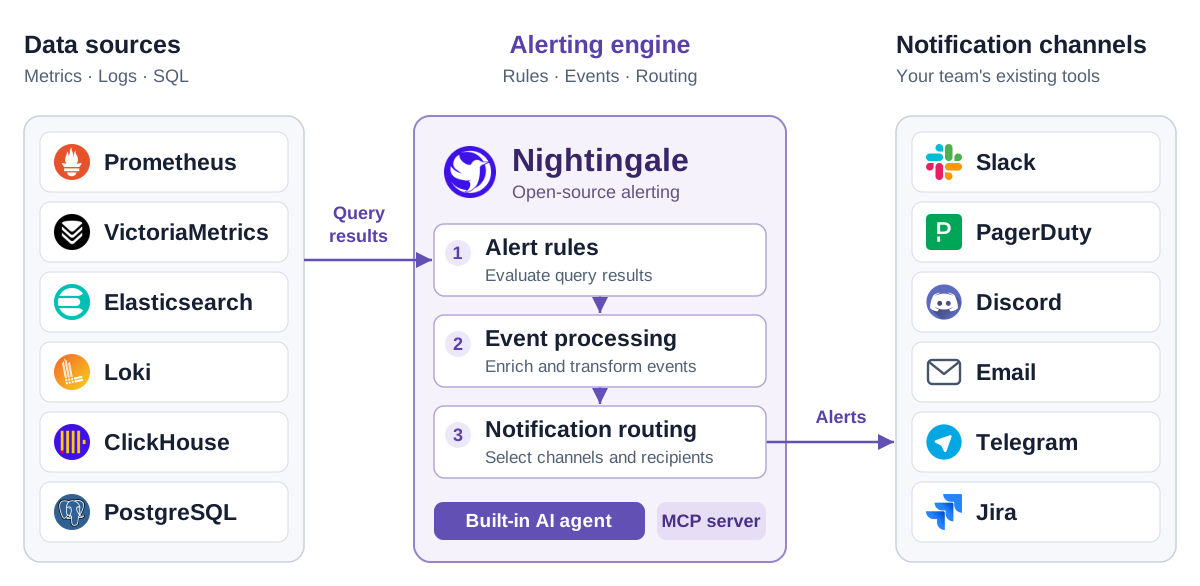
Nightingale queries Prometheus, VictoriaMetrics, Elasticsearch, Loki, ClickHouse, and PostgreSQL, evaluates alert rules, processes events, and routes notifications to Slack, PagerDuty, Discord, Email, Telegram, and Jira. The engine includes an AI agent and MCP server.

Why Nightingale?

  • Give teams ownership of their alerts. Organize rules into business groups, assign team permissions, and manage rules and notification settings through the UI and API.
  • Bring scattered alerting into one place. Evaluate rules against metrics, logs, and SQL data sources while keeping your existing collectors, storage, and Grafana dashboards.
  • Understand what happened to an alert. Inspect rule evaluation records, historical events, and notification results to trace a query through to delivery.

Quick start

With Git and Docker Compose installed, start the included evaluation stack:

git clone https://github.com/ccfos/nightingale.git
cd nightingale/docker/compose-bridge
docker compose up -d

This starts Nightingale, MySQL, Redis, VictoriaMetrics, and Categraf. Open http://localhost:17000 and sign in with root / root.2020.

To get your first alert:

  1. Connect a data source. Add your existing Prometheus-compatible endpoint, or use http://victoriametrics:8428 for the VictoriaMetrics instance in this Compose stack.
  2. Create an alert rule. Choose a business group and data source, then enter a PromQL expression. For an always-firing test, use vector(1) > 0 and set the duration to 0.
  3. Configure delivery. Set up a notification channel, create a notification rule, and attach it to the alert rule. Check that the test notification arrives, then disable the test alert.

The Compose stack uses example credentials and exposes service ports for local evaluation. Change credentials and review network access before deploying on a shared or public host. See deployment options for other ways to run Nightingale.

How it fits into your stack

Nightingale queries your data sources, evaluates alert conditions, processes events, and routes notifications. Your existing data stays in its current stores.

Keep Grafana for visualization and your on-call platform for scheduling, escalation, and incident response. Nightingale also includes dashboards for teams that want to explore data alongside their alerts.

Starting without a monitoring stack? The standalone configuration includes an optional embedded TSDB for small, single-instance deployments. Categraf is an optional collector for hosts, middleware, databases, and network devices.

Key capabilities

CapabilityWhat you can do
Alerting across data sourcesUse PromQL, log queries, or SQL to define conditions. Apply a rule to multiple instances of the same data source type.
Team ownershipGroup rules and dashboards by business group, assign team permissions, and connect OIDC, OAuth2, LDAP, or CAS for sign-in.
Event processing and routingMute notifications, subscribe to alerts, enrich or rewrite labels, and route events through conditional pipelines.
Alert execution recordsReview evaluation queries and results, active and historical events, and notification delivery records.
Reusable integrationsStart with bundled collector configurations, alert rules, and dashboards. Review queries and thresholds for your environment before enabling them.
Distributed evaluationDistribute rules across alerting engines and use n9e-edge to evaluate alerts close to remote data sources.

Notification integrations include Slack, PagerDuty, Discord, Email, Telegram, Mattermost, Jira, and Jira Service Management, with HTTP webhooks and scripts for custom destinations. See the native notification channel reference for configuration details.

For automated responses, connect ibex to run predefined remediation scripts when an alert fires.

Built-in AI agent

Nightingale includes an AI agent you can use directly in the web UI. The agent runs inside Nightingale, calls tools to inspect your monitoring data and configuration, and works through tasks over multiple steps.

  • Investigate alerts. Query related metrics and logs, inspect affected hosts, and explain findings using the data it retrieves.
  • Troubleshoot the alerting process. Inspect rules, evaluation logs, mute settings, event processing, and notification results to find why an alert did not fire or reach its destination.
  • Create and update configuration. Build alert rules and dashboards, generate PromQL and SQL, and configure notification rules, mutes, and subscriptions through conversation. The built-in tools for updating existing alert rules and dashboards present proposed changes for confirmation.
  • Extend it with Skills. Bundled Skills cover common monitoring workflows. Add your team's procedures, reference material, and scripts as custom Skills, including Skills imported from Git.

For example:

Why did this alert fire? Check the affected host's metrics and logs around the trigger time.

Create a memory-usage alert for the production hosts and notify our team in Slack.

ツールをダウンロード

人気

すべて見る →

コミュニティで最も使われているツールを見つけましょう。

  • 1

    OsintHunter

    letox4/osinthunter

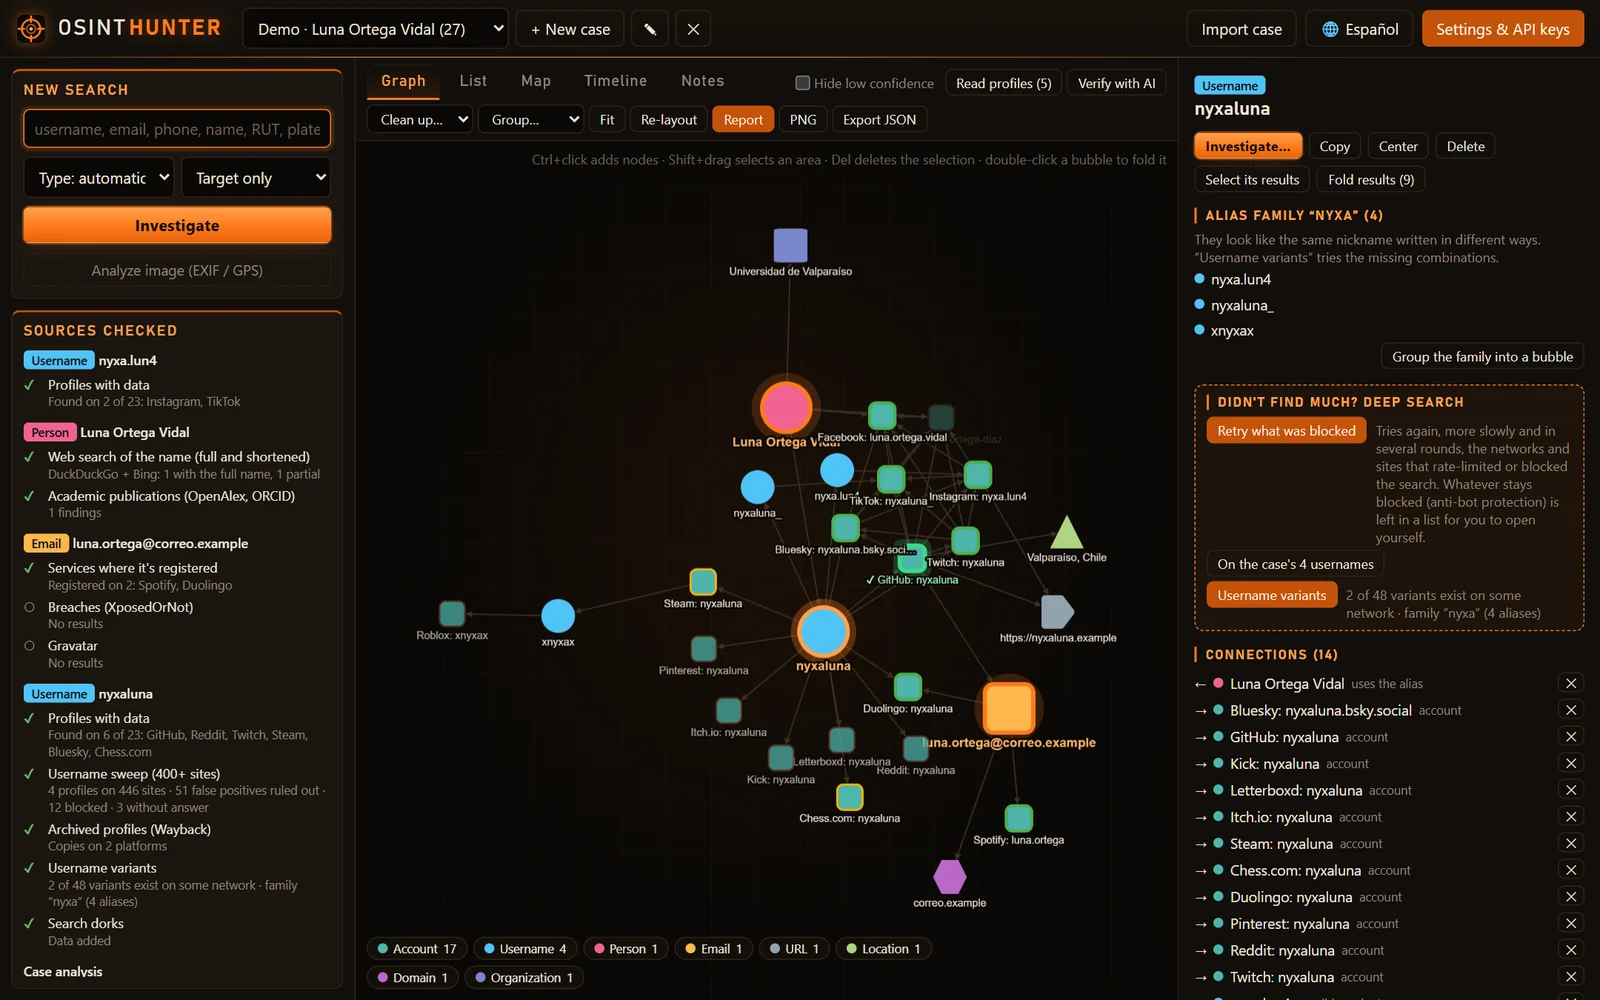
    🎯 究極のOSINTツールキット:調査グラフ、信頼度スコアリング、エイリアスファミリー、マップ、タイムライン、レポート。49個のモジュール、400以上のサイト、APIキー不要。

    732
  • 2

    ghostlock-app

    yukonga/ghostlock-app

    GhostLock ワンタップ実行アプリ(CVE-2026-43499)

    506
  • 3

    ARTEX

    baarai/artex

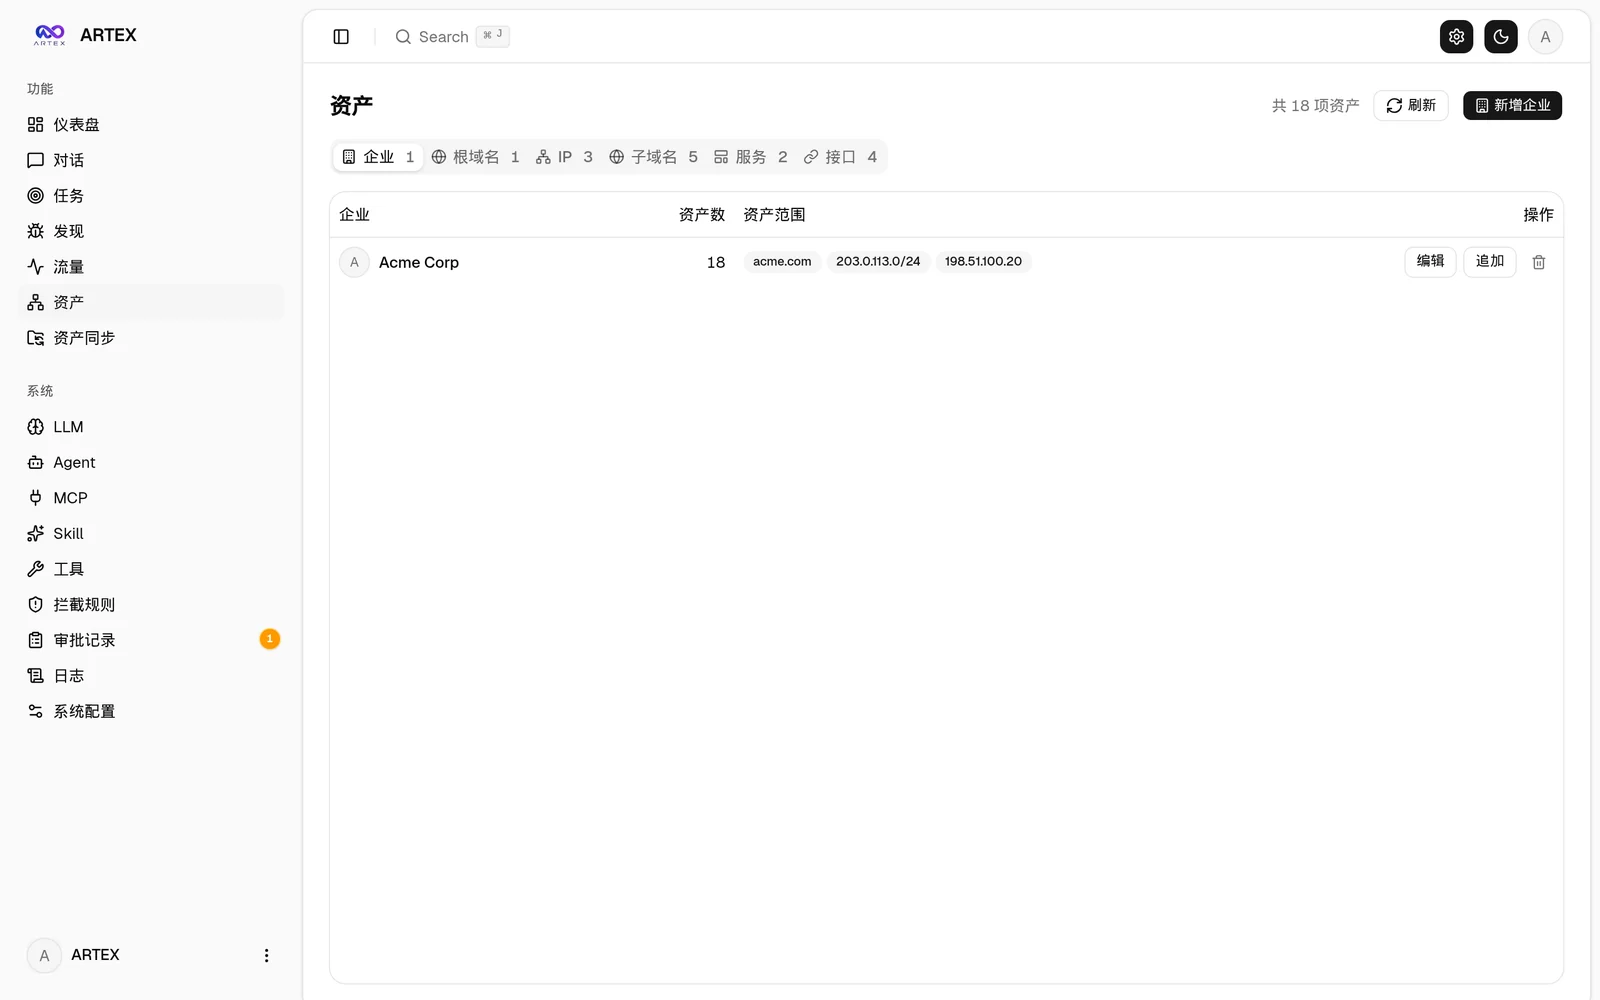
    プランナー/ワーカーエージェント、資産グラフと探索グラフ、MITMトラフィック記録、脆弱性の再テストを備えたLLMマルチエージェント自律ペネトレーションテストプラットフォーム。

    405
  • 4

    redforge

    cybersecurity91/redforge

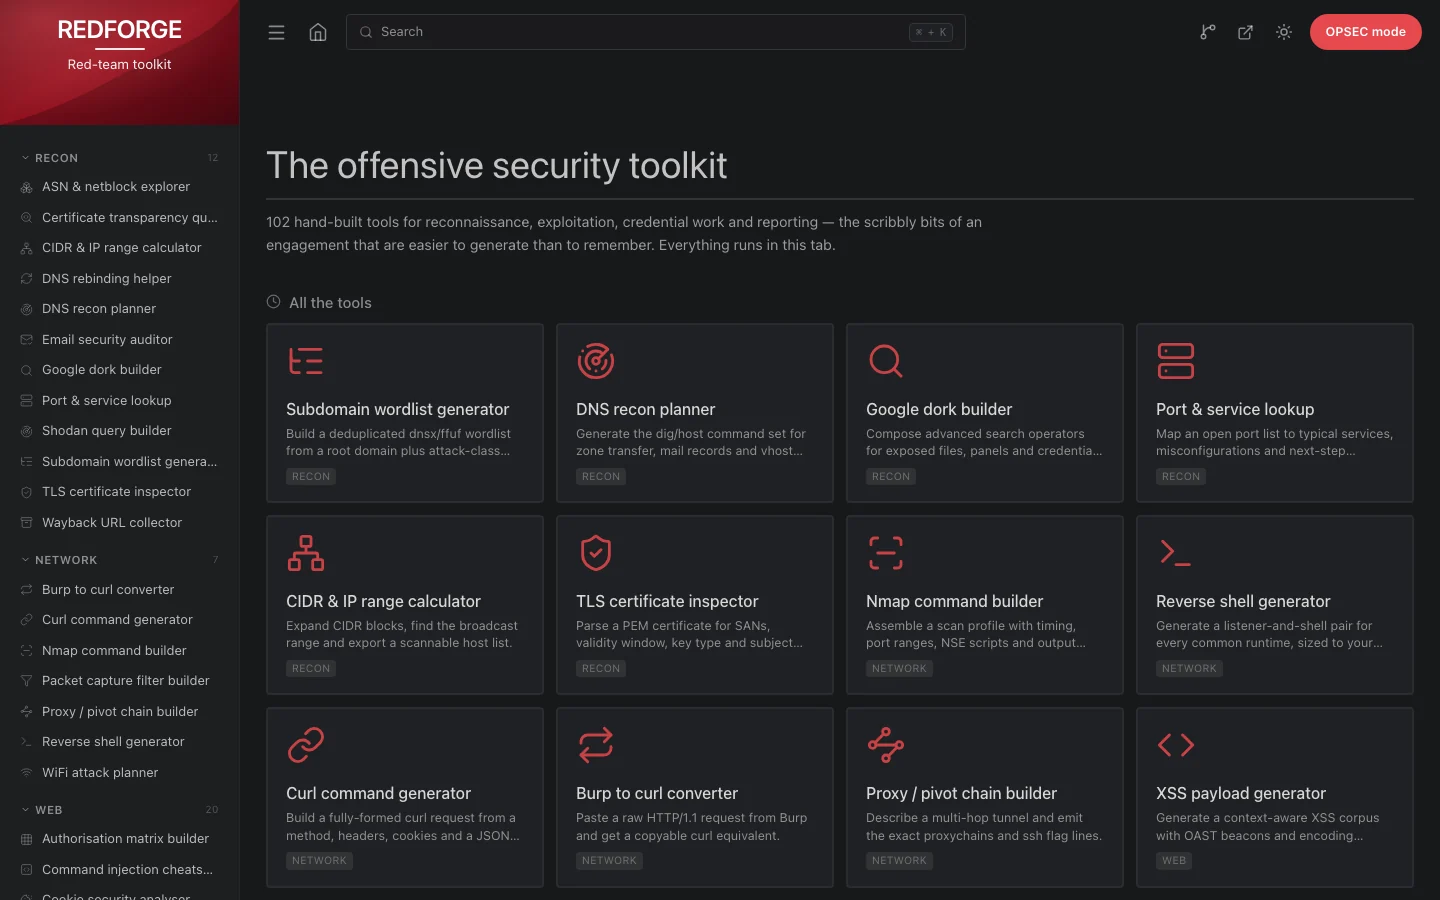
    ブラウザ側のレッドチームツールキット。偵察、ペイロード生成、認証情報攻撃、暗号、エンコーディング、エンゲージメントレポート向けの102のオフラインツールを備えています。

    342
  • 5

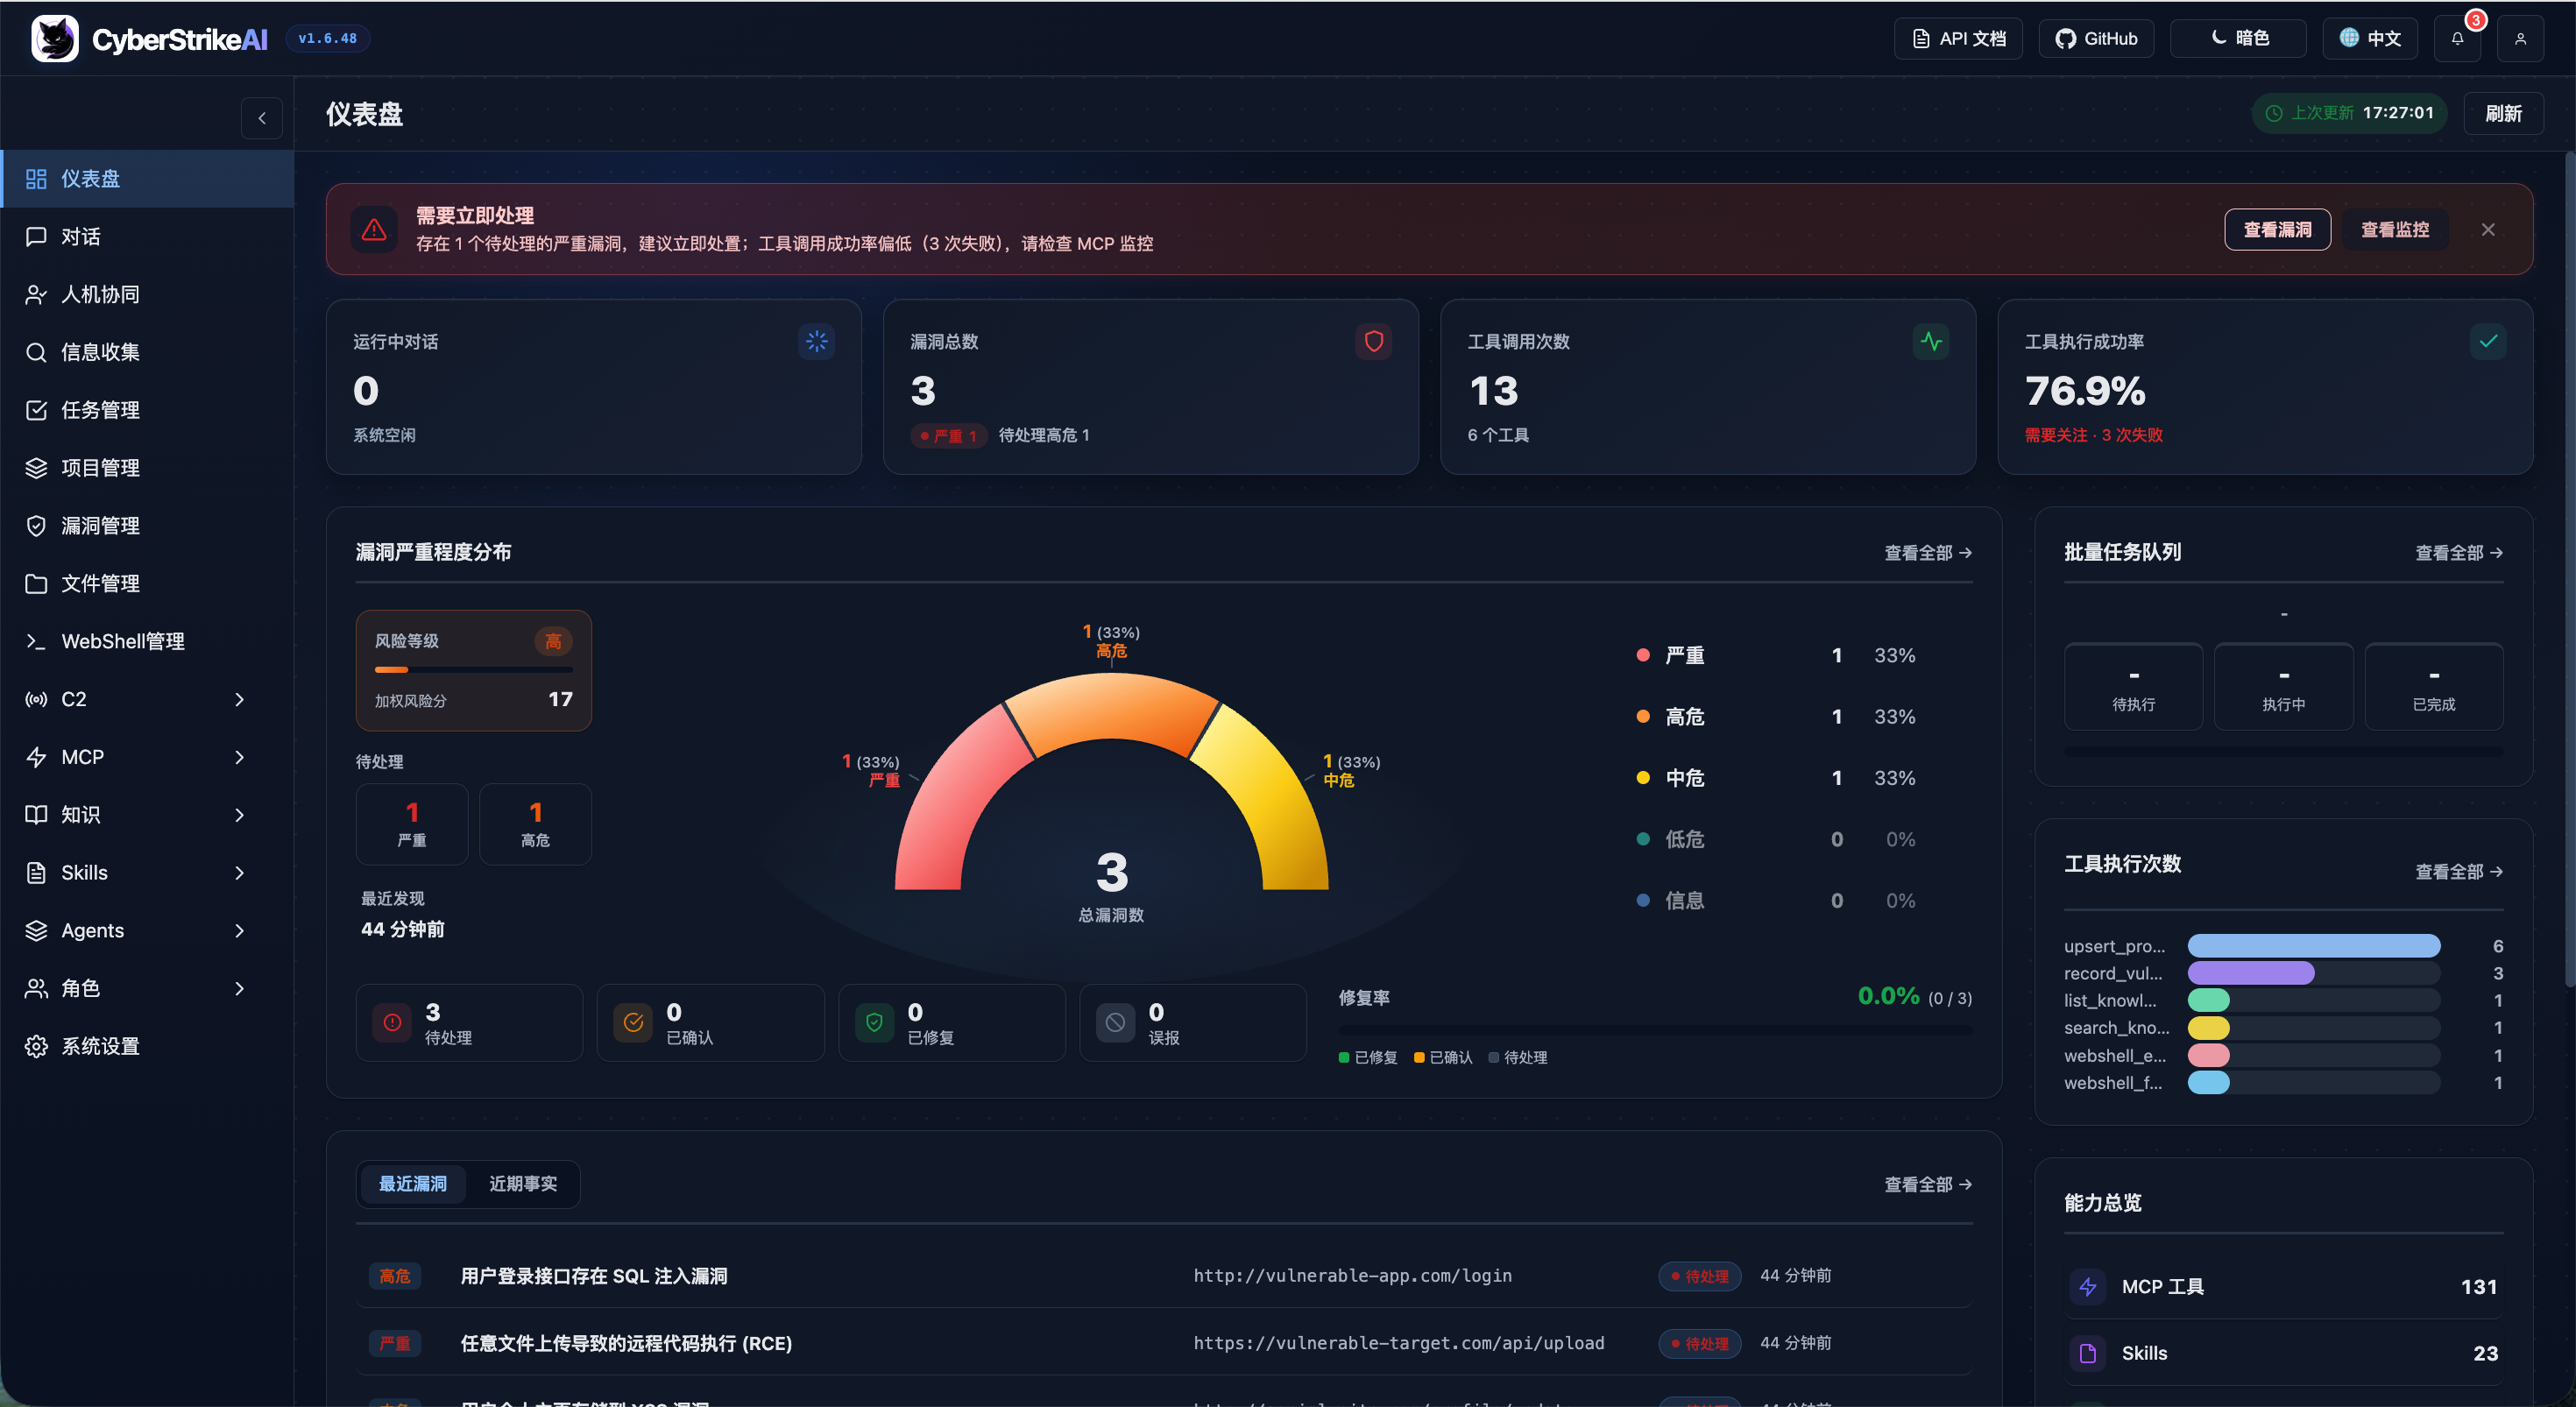
    CyberStrikeAI

    ed1s0nz/cyberstrikeai

    AIネイティブなサイバーセキュリティのためのアクションシステム。意図がガバナンスされた実行に変わり、証拠が運用記憶となり、すべての操作が次の操作を改善する。

    261
  • 6

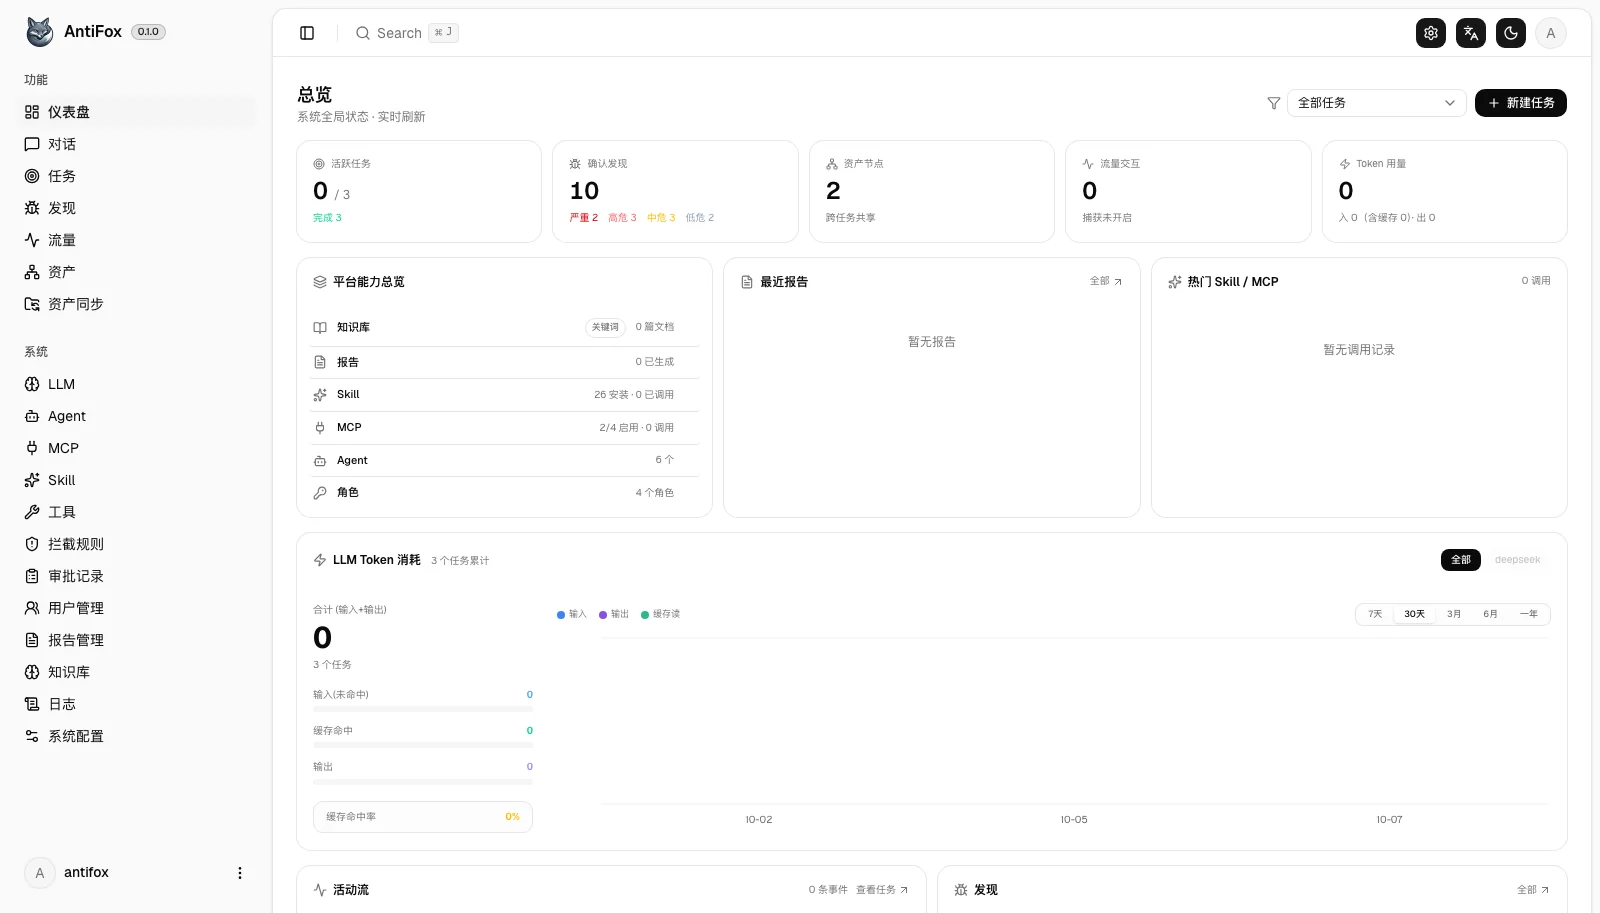
    antifox

    antifox-ai/antifox

    偵察、攻撃対象領域の探索、エクスプロイト検証、証拠に基づくレポート提供を実行するAIマルチエージェント自律ペネトレーションテストプラットフォーム。

    259

すべてのツールを探索

ツールコレクションを閲覧

すべてのツールを見る →