 ddudle/ctxdebug
MCP-powered reverse engineering platform connecting WinDbg, IDA Pro & x64dbg with 160+ AI-accessible debugging and analysis tools.

MCP servers for WinDbg, IDA Pro, and x64dbg
One stdio interface · 160+ tools · Three debuggers, one client.





Quick Start · Architecture · Servers · Workflows · Report an Issue
Website · ctxdebug.xyz · Contact · [email protected] · Status · Public alpha
For authorized reverse engineering, crash analysis, and security research on systems you own or have permission to analyze.
ctxdebug is an MCP (Model Context Protocol) platform that connects WinDbg, IDA Pro 9.x, and x64dbg to AI coding assistants. Use it for crash dump analysis, static review in IDA, and live debugging in x64dbg — without copying output between windows.
One stdio interface. 160+ tools. Three debuggers, one client.
How it works. Each debugger is exposed as an MCP tool server. You talk to Claude, Kiro, or any MCP-compatible client; the client calls the debuggers. No copy-paste, no manual correlation between tools.
Example. You ask: "analyze this crash dump and find the root cause." ctxdebug opens the dump in WinDbg, runs
!analyze -v, takes the faulting address, decompiles the function in IDA Pro, and returns a combined report with pseudocode and the caller chain.
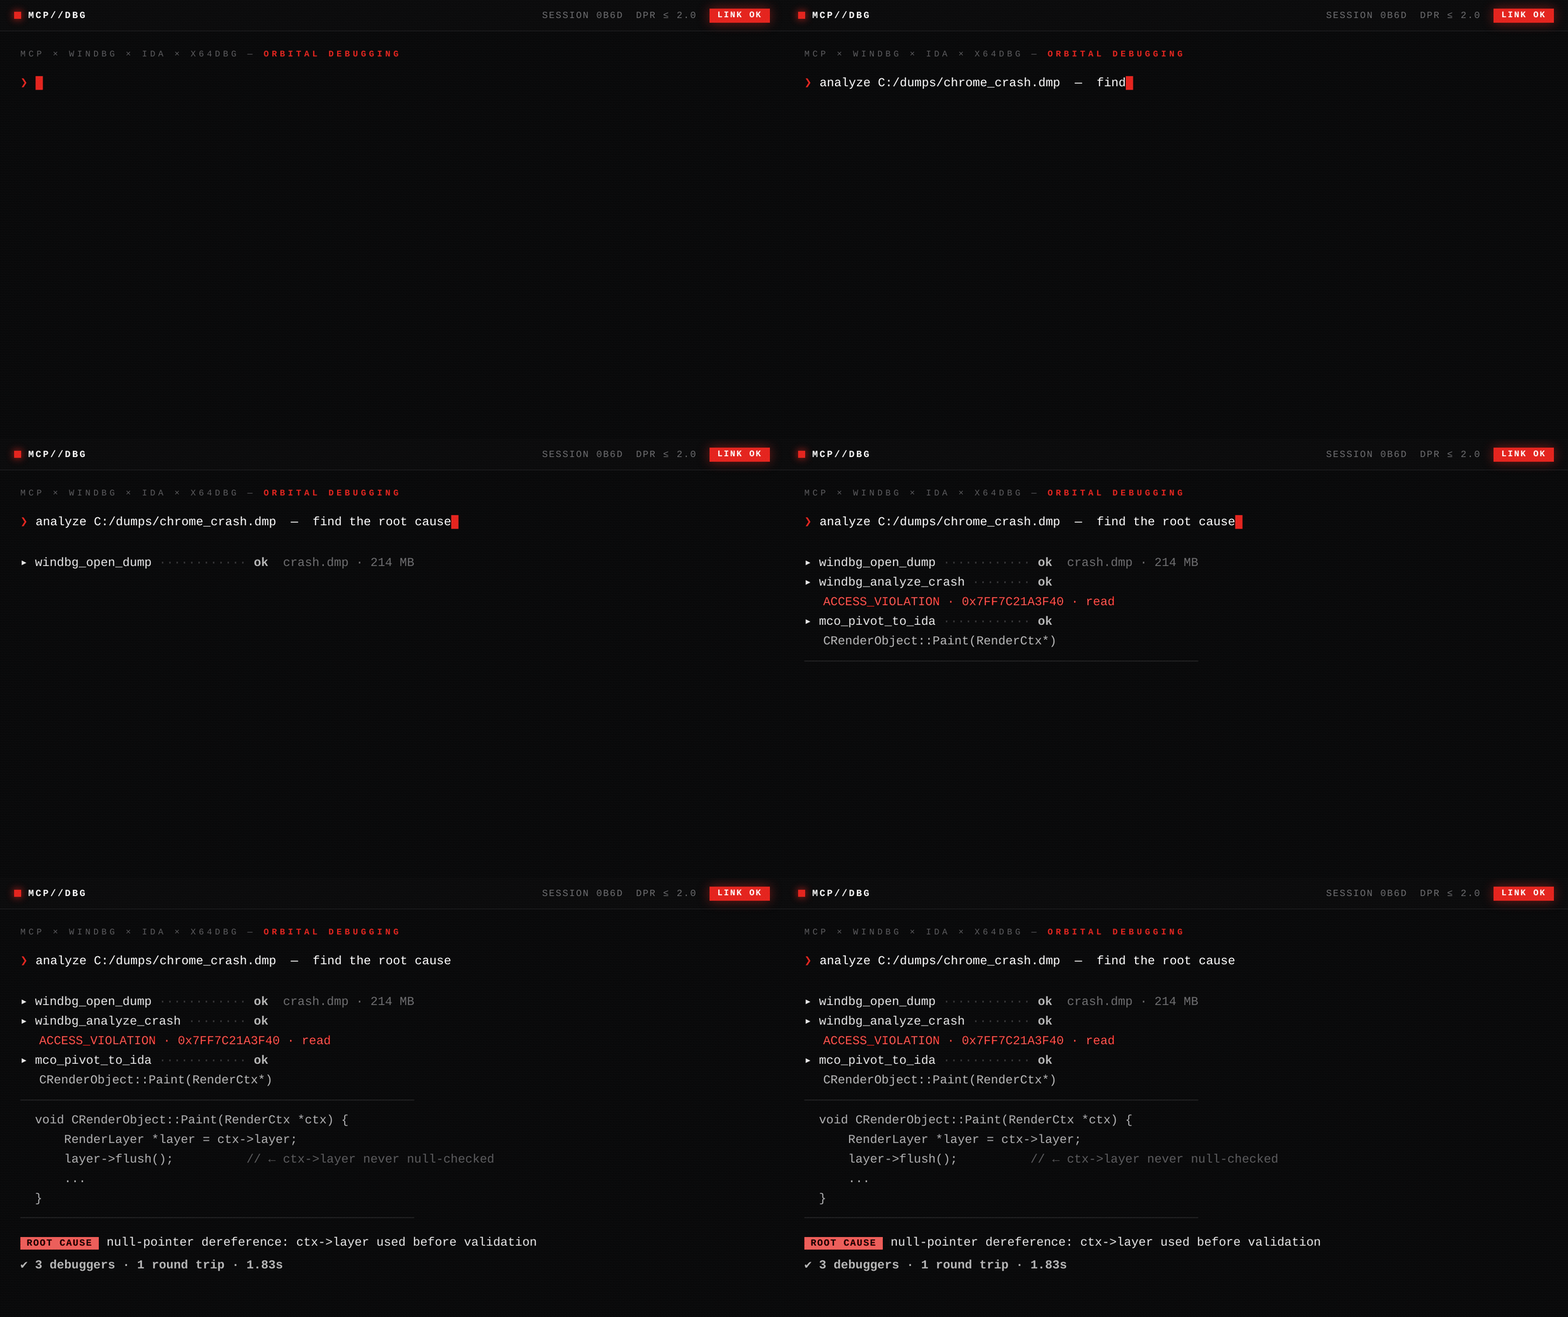
One prompt → WinDbg opens the dump, analyzes the crash, IDA decompiles the faulting function — combined report in ~1.8s.
git clone https://github.com/DdUdle/ctxdebug.git
cd ctxdebug
pip install -e .
Individual servers:
claude mcp add windbg       -- python windbg_mcp.py
claude mcp add ida          -- python ida_mcp.py
claude mcp add x64dbg       -- python -m agent --mcp
claude mcp add mco          -- python mco_orchestrator.py
claude mcp add mco-sessions -- python mco_sessions.py
Or use the unified gateway — one server, every tool:
claude mcp add mco-gateway -- python mco_gateway.py
See mcp_config_example.json for full JSON configuration with environment variables.
Once a server is registered, ask your AI client:
Open C:\dumps\crash.dmp, run a full crash analysis,
and decompile the function at the fault address.
The orchestrator chains windbg_open_dump → windbg_analyze_crash → mco_pivot_to_ida and returns pseudocode with the caller chain.
| Capability | What it does |
|---|---|
| Live debugger control | Run, pause, step, and inspect a process through x64dbg. Set breakpoints on API groups (memory, network, crypto) instead of one address at a time. |
| Cross-debugger pivot | Take an address from a WinDbg crash dump and open it in IDA Pro for decompilation, callers, and callees in one tool call. |
| Goal-driven analysis | The x64dbg server includes an optional ReAct agent (agent_analyze) that plans multi-step goals — for example finding an unpacking loop or listing anti-analysis checks — by chaining tool calls. Works with Claude, Groq, local Ollama, or heuristics only. |
| Persistent notes | The agent stores packer signatures, anti-analysis patterns, and notes from earlier sessions, and can recall them on new targets. |
| Session recording | Tool calls can be logged to SQLite with full-text search (FTS5). Replay a timeline, compare two sessions, or export a Markdown report. |
| Anti-analysis survey | Combines a static scan (IDA imports/patterns) and a dynamic scan (x64dbg PEB/RDTSC) into one report. Optional lab patches (PEB flags, instruction edits) for samples you are authorized to analyze. |
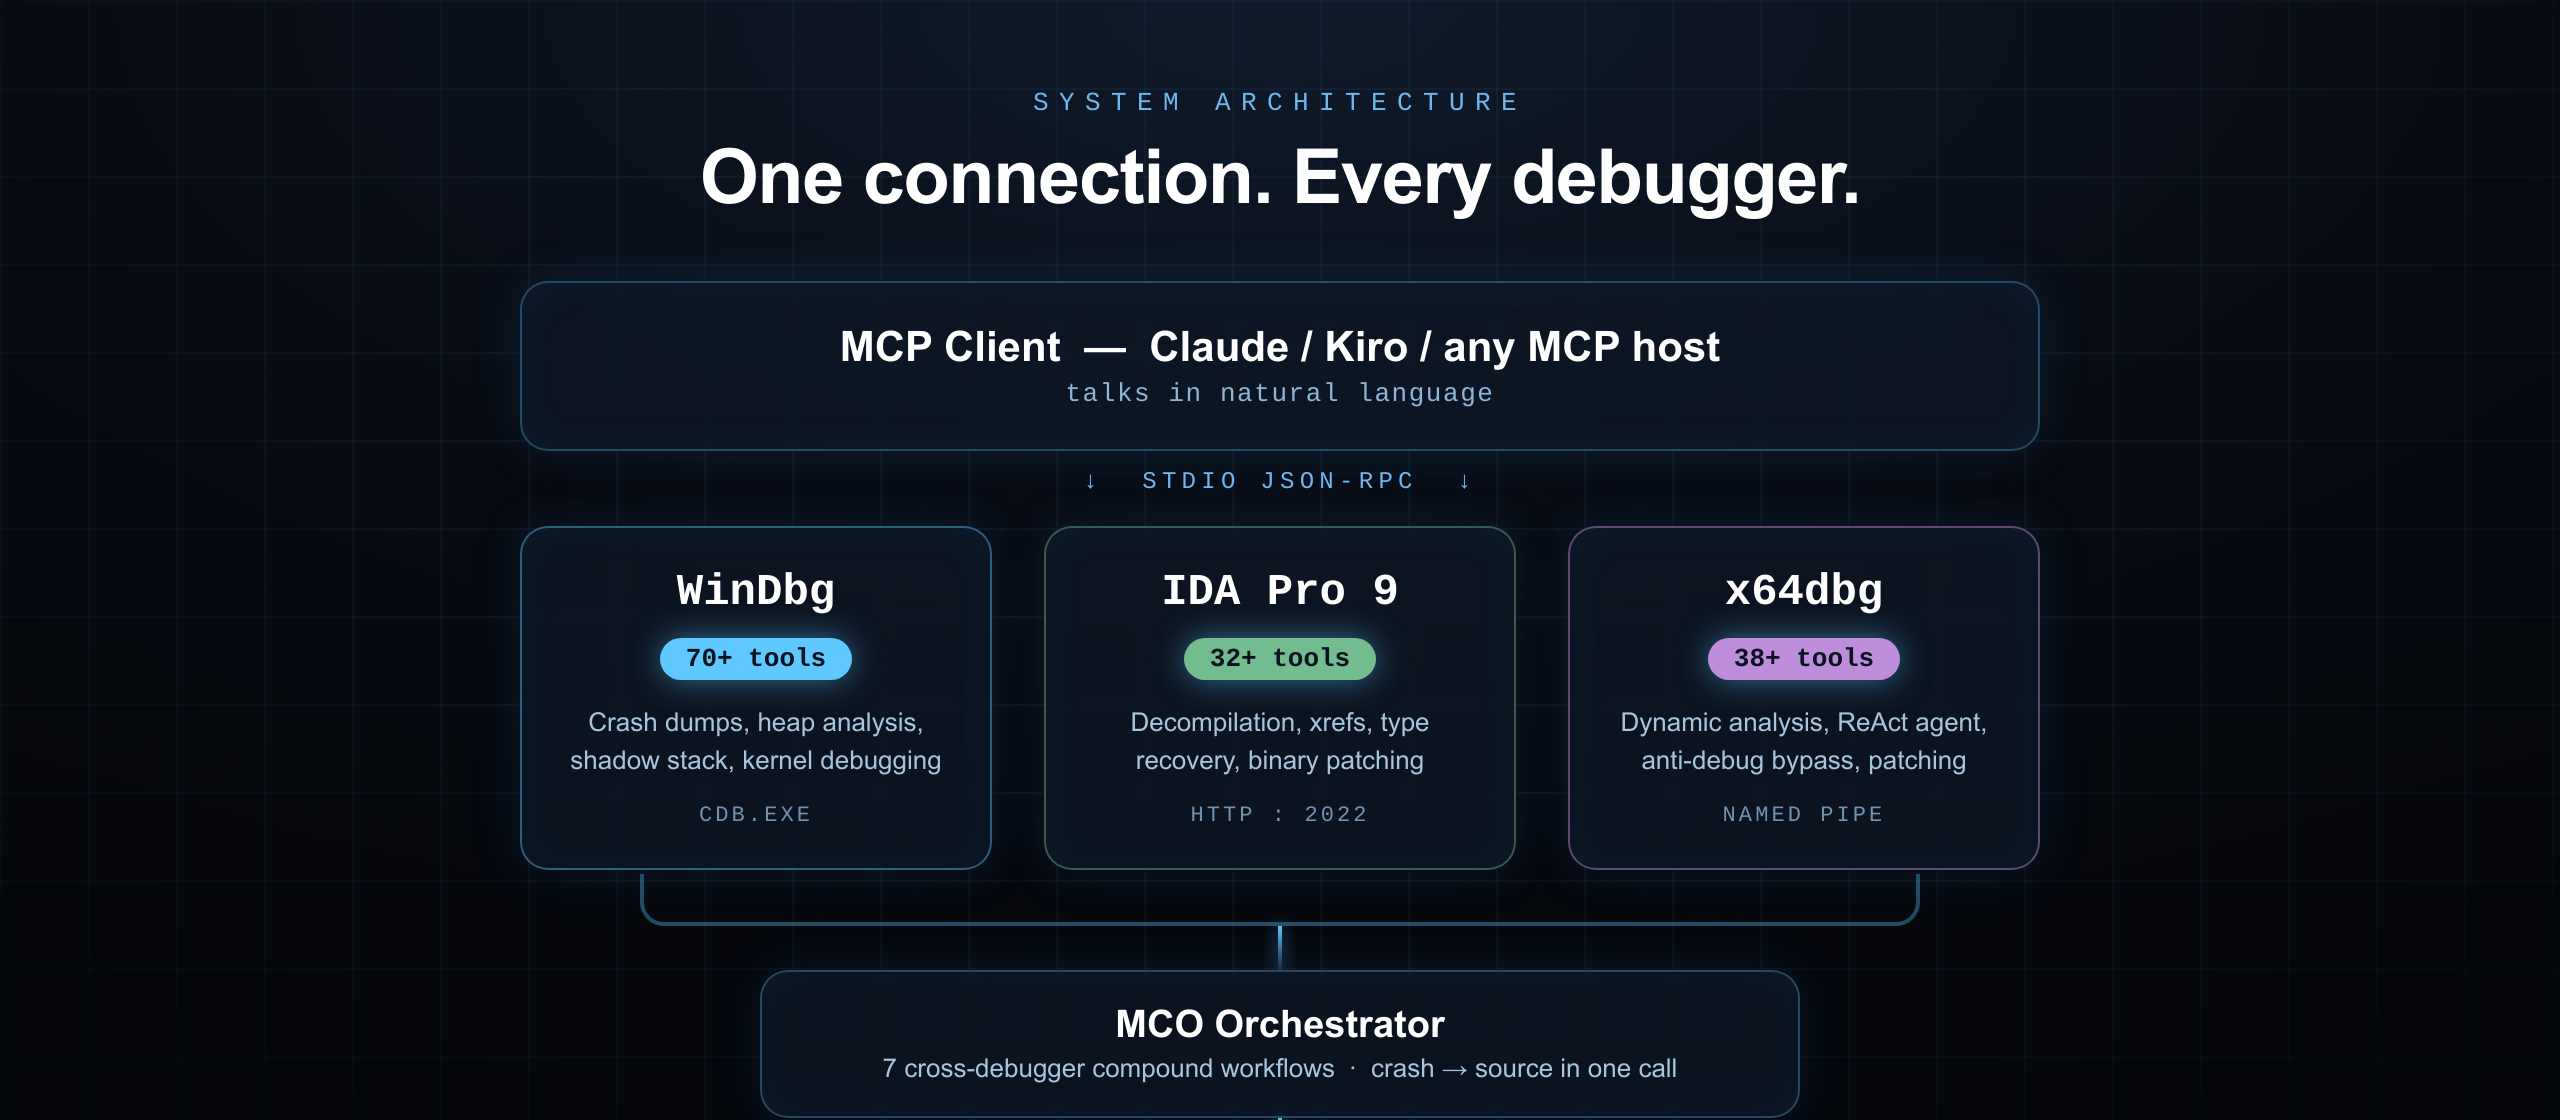
2024-11-05)localhost:2022, auto-discovers the endpoint from 6 candidatesX64A magic + uint32 length + 8-byte padding + JSON)| Server | File | What it does | Tools |
|---|---|---|---|
windbg | windbg_mcp.py | Crash dumps, heap analysis, shadow stack, kernel debugging | 70+ |
ida | ida_mcp.py | Decompilation, xrefs, type recovery, binary patching | 32+ |
x64dbg | agent/ | Dynamic analysis, ReAct agent, memory inspection and patching | 38+ |
mco | mco_orchestrator.py | Cross-debugger compound workflows | 7 |
mco-sessions | mco_sessions.py | Session recording, FTS search, Markdown export | 13 |
mco-gateway | mco_gateway.py | Unified proxy — all servers through one connection | all |
Needs cdb.exe from the Windows SDK. Default path:
C:\Program Files (x86)\Windows Kits\10\Debuggers\x64\cdb.exe
Set WINDBG_MCP_CDB if your path differs. No pre-launch needed — tools open dumps or attach on demand.
Open IDA Pro 9.x with a binary loaded.
In the Python console, run:
exec(open(r'path\to\ctxdebug\ida_server_plugin.py').read())
HTTP server starts on port 2022.
Build the C++ plugin:
cd agent\plugins
build_plugin.bat
Copy mco_agent.dp64 to x64dbg's plugin directory.
Restart x64dbg — the plugin exposes named pipe \\.\pipe\x64dbg_ai_agent.
Crash dump → source (one command)
mco_crash_to_source(dump_path="C:\\dumps\\crash.dmp")
Opens the dump, runs !analyze -v, extracts the faulting address, decompiles the crashing function in IDA, and returns pseudocode with callers.
Anti-analysis report
mco_bossix_report()
bossix_hide()            # PEB flag adjustments (lab)
bossix_patch(address)    # NOP / flip JCC at a check (lab)
