 0xricksanchez/like-dbg
Fully dockerized Linux kernel debugging environment for Linux and MacOS




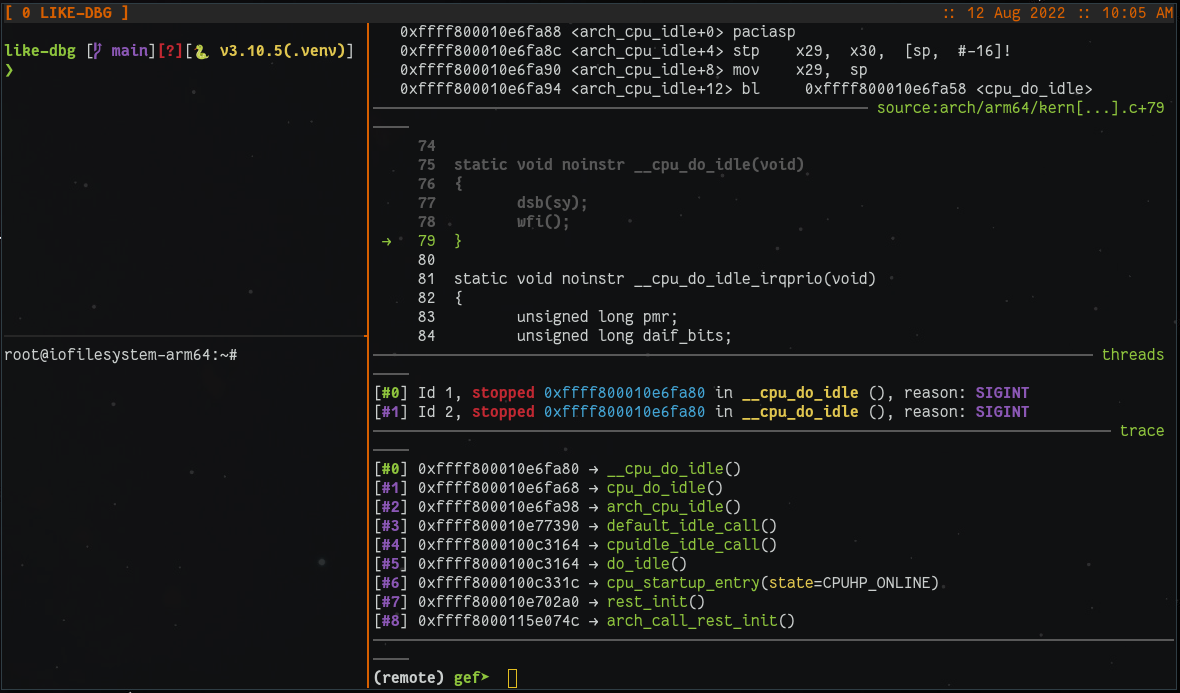
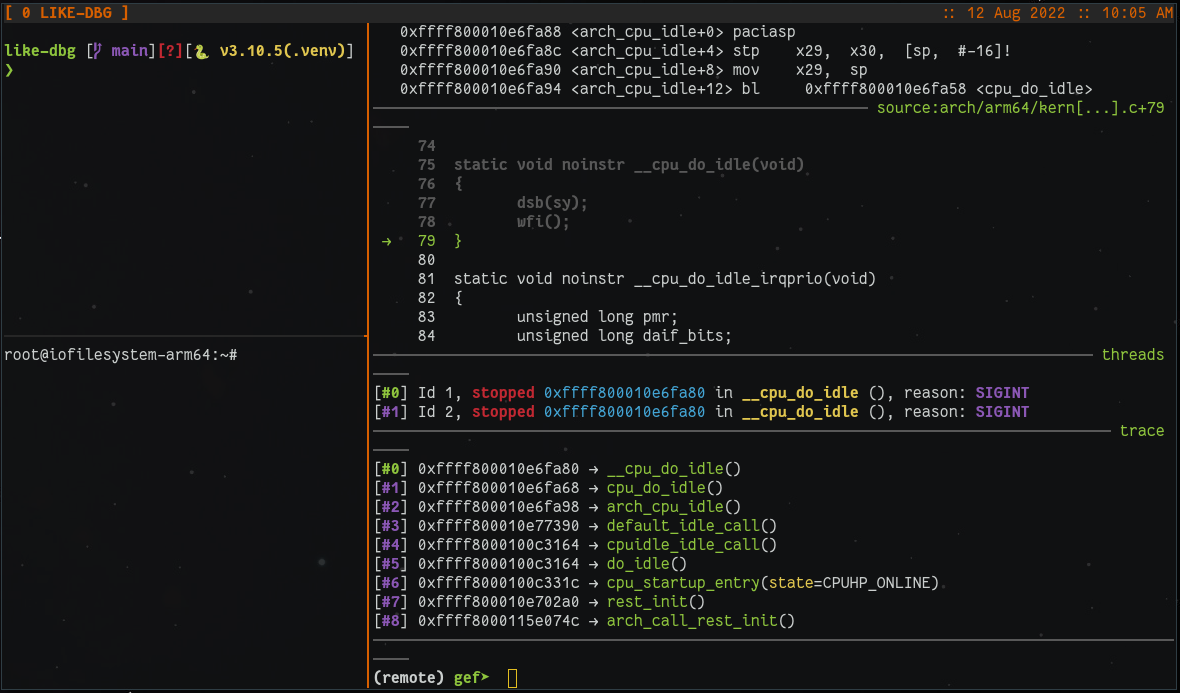
LIKE-DBG (LInux-KErnel-DeBuGger) is a fully containerized Linux kernel debugging and exploitation lab. It builds or adopts a kernel and root filesystem, boots them under QEMU, and drops you into an interactive GDB session (pwndbg or GEF), wiring every piece into a single tmux window.
The point is to remove the boring setup so your time goes to the kernel, not the scaffolding.
Every step runs inside Docker, so the only things you install on the host are Docker, tmux,
Python, and uv. Pick a kernel version (or hand it a CTF
challenge), run one command, and land at start_kernel with full symbols.
One command resolves your config, builds or reuses a kernel and rootfs, boots the guest, and attaches the debugger:
uv run ./start_kgdb
The run is a loop you stay inside: build or adopt a kernel and rootfs, boot it under QEMU (the Debuggee), attach GDB (the Debugger), then edit, deliver, run, crash, root-cause, and repeat.
There are two ways to get a kernel:
bzImage/Image (plus vmlinux
and initramfs if you have them) and it boots that verbatim under GDB. See
docs/ctf-foreign-kernel.md.exploit-dev, hardened, kasan,
ubsan, lockdep, and more) that resolve to kernel config fragments and runtime defaults.
Post-build .config verification catches a profile that did not take. Note that exploit-dev
(the default) only turns KASLR off; SMEP, SMAP, and KPTI stay on unless you switch profiles or
toggle them yourself (see docs/configuration.md).current, task and module walking, symbol lookup); GEF is a one-line switch.--run and --upload deliver an exploit to the live guest over a
9p share or SSH. A single flag-less .c is auto-compiled static-musl to the target arch;
anything else is delivered as-is. See exploit/README.md.--insmod and --rmmod; their symbols auto-load in GDB. See
modules/README.md.--analyze-crash
regenerates a report offline.--run/--insmod always land in the guest whose pane you typed them from.artifacts/runs/<id>/ with resolved
settings, host profile, command records, logs, and pane transcripts.Run as a non-root user in the docker group. Cross-compilation and initramfs work happen inside
containers (a zig cc musl toolchain), so no host cross-toolchain is needed.
# 1. Install dependencies
uv sync

# 2. Start the project tmux server (loads the shipped .tmux.conf)
tmux -L likedbg -f .tmux.conf new -s LIKE-DBG

# 3. Inside that tmux session: build-or-reuse a kernel, boot it, attach the debugger
uv run ./start_kgdb
The first run builds the container images and a kernel, so it takes a while; later runs reuse the cache and start in seconds.
Each boot renames its session after what it is debugging (LIKE-DBG-pawnyable-lk01,
LIKE-DBG-6_6_30-exploit-dev), so a session you left running never blocks the next one and two
challenges can be debugged side by side. Detach with C-b d; tmux -L likedbg ls shows what is
running, and the = below is tmux's exact-match form (without it, a -2 session can win):
tmux -L likedbg attach -t =LIKE-DBG-6_6_30-exploit-dev
From here, read docs/build-your-own-kernel.md for the full workflow, or docs/ctf-foreign-kernel.md if you have a challenge to debug. For a hands-on tour of the whole loop against a bundled vulnerable driver, follow the LK01 walkthrough.
| Document | Covers |
|---|---|
| docs/walkthrough-lk01.md | Start here: a guided end-to-end example against a bundled vulnerable driver, from build to use-after-free to crash report. |
| docs/build-your-own-kernel.md | Build a kernel from source, boot it, then debug and iterate. |
| docs/ctf-foreign-kernel.md | Adopt a provided CTF or foreign kernel and deliver exploits to it. |
| docs/configuration.md | The TOML config stack, debug profiles, and every knob. |
| exploit/README.md | The exploit-dev loop: the auto-compile boundary and the escape hatch. |
| modules/README.md | Out-of-tree custom modules and GDB symbol auto-load. |
modules/lk01/ ships a small, deliberately vulnerable training driver plus a crash PoC, wired
for the full build, load, and exploit loop as a worked example.