
Skip to content
KitploitKITPLOIT
도구블로그
제출
도구블로그
제출

해킹, 침투 테스트 및 사이버 보안 도구를 당신의 보안 무기고에!

Kitploit은 해킹, 사이버 보안 및 침투 테스트 도구 디렉토리입니다. 최신 프로젝트 업데이트를 발견하여 취약점을 찾고, 시스템을 분석하고, 테스트를 자동화하고, 보안을 강화하세요.

··피드·문의·개인정보·© 2026 Kitploit

도구 디렉토리

카테고리

모든 카테고리 보기
Loading categories
mwemu — 악성코드 분석, 셸코드 에뮬레이션 및 페이로드 언패킹을 위한 순수 Rust x86 하드웨어 에뮬레이터 및 Windows 프로세스 시뮬레이터입니다. 32/64비트 PE 실행 파일, Metasploit, Cobalt Strike 및 복잡한 악성코드 계열을 지원합니다. | Kitploit
도구/GitHubGitHub/mwemuorg/mwemu
Exploit FrameworksReverse EngineeringShellcodeMalware AnalysisBinary Analysis
GitHubmwemuorg/mwemu

mwemu

악성코드 분석, 셸코드 에뮬레이션 및 페이로드 언패킹을 위한 순수 Rust x86 하드웨어 에뮬레이터 및 Windows 프로세스 시뮬레이터입니다. 32/64비트 PE 실행 파일, Metasploit, Cobalt Strike 및 복잡한 악성코드 계열을 지원합니다.

저장소 보기
313447일 전Kitploit 검토 완료

인기

모두 보기 →

커뮤니티에서 가장 많이 사용되는 도구를 찾아보세요.

모든 도구 탐색

도구 컬렉션을 둘러보세요

모든 도구 보기 →
공유
웹사이트

MWEmu

CI mwemu crates.io libmwemu crates.io Docs.rs PyPI License: GPL v3 MSRV

공식 문서

mwemu.github.io

이게 뭐죠?

순수 Rust로 구현된 하드웨어 에뮬레이터 + OS 프로세스 시뮬레이터입니다.

이 접근 방식은 악성코드 분석 및 기타 작업(PE, 셸코드 등)에 매우 편리합니다.

OS는 주로 Windows이며, Windows 프로세스를 에뮬레이트하고 Linux에 대한 아주 기본적인 지원을 제공합니다.

하드웨어는 x86 32/64비트이며 빠르고 안정적입니다.

MWEMU 로고

소프트웨어 사용 세 가지 방법

  • mwemu 명령줄 https://github.com/mwemuorg/mwemu
  • libmwemu 크레이트 https://crates.io/crates/libmwemu
  • pymwemu https://pypi.org/project/pymwemu/

scemu에 관한 참고 사항

프로젝트 이름이 scemu에서 mwemu로 변경되었습니다.

동영상

r2con2025 mwemu에서 radare2를 사용하여 에뮬레이션 중 정적 분석 및 시각화를 수행하는 방법

일부 데모

기능

  • 📦 Rust 안전성, 악성코드 에뮬레이션에 적합.

    • 모든 의존성이 Rust로 구현됨.
  • ⚡ 매우 빠른 에뮬레이션

    • 벤치마크
    • 초당 25,767,432 명령어
    • 모든 명령어를 출력(-vv) 시 초당 680,000 명령어
    • 직접 테스트해 보세요: time mwemu -f test/exe64win_enigma.bin -6 -v -c 20000000 --cmd q
  • iced-x86 Rust 디스어셈블러라는 훌륭한 라이브러리를 기반으로 함.

  • 명령줄 도구, Rust 라이브러리, Python 라이브러리.

  • 반복 탐지기.

  • 메모리 및 레지스터 추적.

  • 색상화.

  • 특정 시점에 중지하고 상태를 탐색하거나 수정.

  • 339개의 CPU 명령어 구현.

  • 15개 DLL의 260개 32비트 WinAPI 구현.

  • 10개 DLL의 204개 64비트 WinAPI 구현.

  • 모든 Linux 시스템 호출.

  • SEH 체인.

  • 벡터 예외 처리기.

  • PEB, TEB 구조.

  • 동적 링크.

  • IAT 바인딩.

  • 지연 로딩.

  • 메모리 할당기.

  • int3에 반응.

  • 디버그되지 않은 CPUID.

  • 32비트 및 64비트 셸코드 에뮬레이션.

  • PE32 및 PE64 실행 파일 에뮬레이션.

  • 알려진 페이로드로 완전 에뮬레이션:

    • metasploit 셸코드
    • metasploit 인코더
    • cobalt strike
    • shellgen
    • guloader (아직 완벽하지는 않지만 디버거보다 더 멀리 도달)
    • mars stealer pe32
    • bumblebee
  • 복잡한 악성코드 함수로 부분 에뮬레이션:

    • guloader
    • xloader
    • danabot

pymwemu와 악성코드

  • raccoon, 문자열 복호화
  • vidar, 문자열 복호화
  • xloader, 전체 복호화, 키 생성, URL 암호화 빌드
  • lokibot, API 난독화 해제
  • mars, 언패킹 및 IOC 획득
  • shikata, 디코딩 및 IOC 획득
  • danabot, 문자열 복호화
  • zloader, 문자열 복호화
  • bumblebee, 25,515,274,634 명령어 에뮬레이션 후 언패킹
  • enigma loader, API 난독화 해제 및 드롭 복호화
  • bugsleep, 언팩
  • gozi, BSS 복호화 및 DGA 예측

에뮬레이션 순간 포착

에뮬레이션 중에 에뮬레이션된 CPU 명령어 수를 볼 수 있으며, 이는 에뮬레이션 순간의 고유 ID입니다.

-c 플래그를 사용하면 특정 순간에 에뮬레이션을 중단하고 콘솔로 상황을 검사할 수 있습니다.

사용법

root@kitploit:~
MWEMU emulator for malware 0.7.11
@sha0coder

USAGE:
    mwemu [FLAGS] [OPTIONS]

FLAGS:
    -6, --64bits         enable 64bits architecture emulation
        --banzai         skip unimplemented instructions, and keep up emulating what can be emulated
        --flags          trace the flags hex value in every instruction.
    -F, --fpu            trace the fpu states.
    -h, --handle         handle Ctrl+C to spawn console
        --help           Prints help information
    -l, --loops          show loop interations, it is slow.
    -m, --memory         trace all the memory accesses read and write.
    -n, --nocolors       print without colors for redirectin to a file >out
    -r, --regs           print the register values in every step.
    -p, --stack_trace    trace stack on push/pop
    -t, --test           test mode
        --version        Prints version information
    -v, --verbose        -vv for view the assembly, -v only messages, without verbose only see the api calls and goes
                         faster

OPTIONS:
    -A, --args <ARGS>                  provide arguments to the EXE like: --args '"aa" "bb"'
        --cmd <COMMAND>                launch a console command
    -b, --base <ADDRESS>               set base address for code
    -c, --console <NUMBER>             select in which moment will spawn the console to inspect.
    -C, --console_addr <ADDRESS>       spawn console on first eip = address
    -d, --dump <FILE>                  load from dump.
    -a, --entry <ADDRESS>              entry point of the shellcode, by default starts from the beginning.
    -e, --exit <POSITION>              exit position of the shellcode
    -f, --filename <FILE>              set the shellcode binary file.
    -i, --inspect <DIRECTION>          monitor memory like: -i 'dword ptr [ebp + 0x24]
        --iso <ISO>                    extract genuine system32 DLLs from a Windows ISO and use them as the maps folder, e.g. --iso ~/Downloads/win11.iso
    -L, --log <LOG_FILENAME>           log output to file
    -M, --maps <PATH>                  select the memory maps folder
        --mxcsr <MXCSR>                set mxcsr register
        --r10 <R10>                    set r10 register
        --r11 <R11>                    set r11 register
        --r12 <R12>                    set r12 register
        --r13 <R13>                    set r13 register
        --r14 <R14>                    set r14 register
        --r15 <R15>                    set r15 register
        --r8 <R8>                      set r8 register
        --r9 <R9>                      set r9 register
        --rax <RAX>                    set rax register
        --rbp <RBP>                    set rbp register
        --rbx <RBX>                    set rbx register
        --rcx <RCX>                    set rcx register
        --rdi <RDI>                    set rdi register
        --rdx <RDX>                    set rdx register
    -R, --reg <REGISTER1,REGISTER2>    trace a specific register in every step, value and content
        --rflags <RFLAGS>              set rflags register
        --rsi <RSI>                    set rsi register
        --rsp <RSP>                    set rsp register
    -x, --script <SCRIPT>              launch an emulation script, see scripts_examples folder
        --stack_address <ADDRESS>      set stack address
    -s, --string <ADDRESS>             monitor string on a specific address
    -T, --trace <TRACE_FILENAME>       output trace to specified file
    -S, --trace_start <TRACE_START>    start trace at specified position
    -V, --verbose_at <NUMBER>          start displaying assembly at specific position (is like -vv enabled in specific
                                       moment)

명령줄 예제

64비트는 -6 플래그가 필요하며, -vv는 ASM 보기, -c는 특정 순간에 콘솔을 띄우는 데 사용:

root@kitploit:~
cargo run --release -- -f /tmp/shellcode.bin -6 -vv -c 19291
cargo run --release -- -f /bin/ls -6 -A '"-l"' -v 
cargo run --release -- -f calc.exe -6 --winver win11
cargo run --release -- -f calc.exe -6 --winver win11 --syscall-mode

테스트

make tests

일부 사용 사례

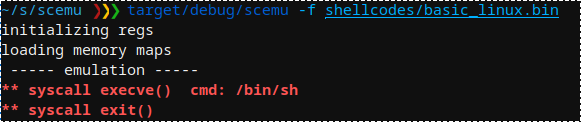
mwemu는 execve() 인터럽트를 감지하는 간단한 셸코드를 에뮬레이트합니다. 참고로 이 도구의 이름을 scemu에서 mwemu로 변경했습니다(이탈리아어로 scemu는 나쁜 단어입니다). 기본 셸코드 탐색

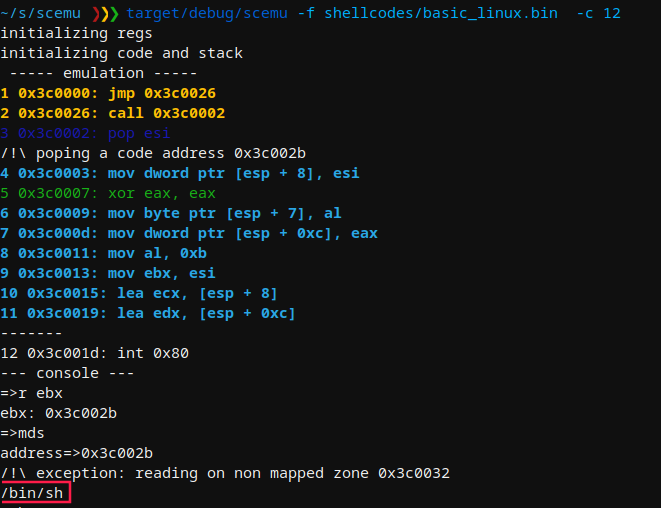
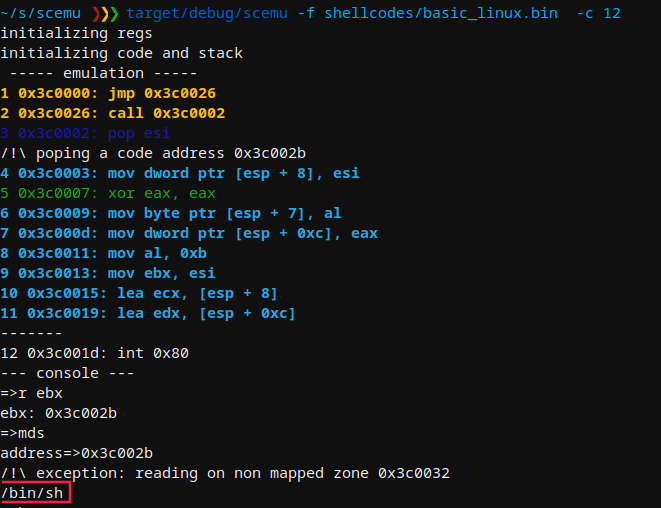
중지할 줄을 선택하고 메모리를 검사합니다. 기본 셸코드 검사

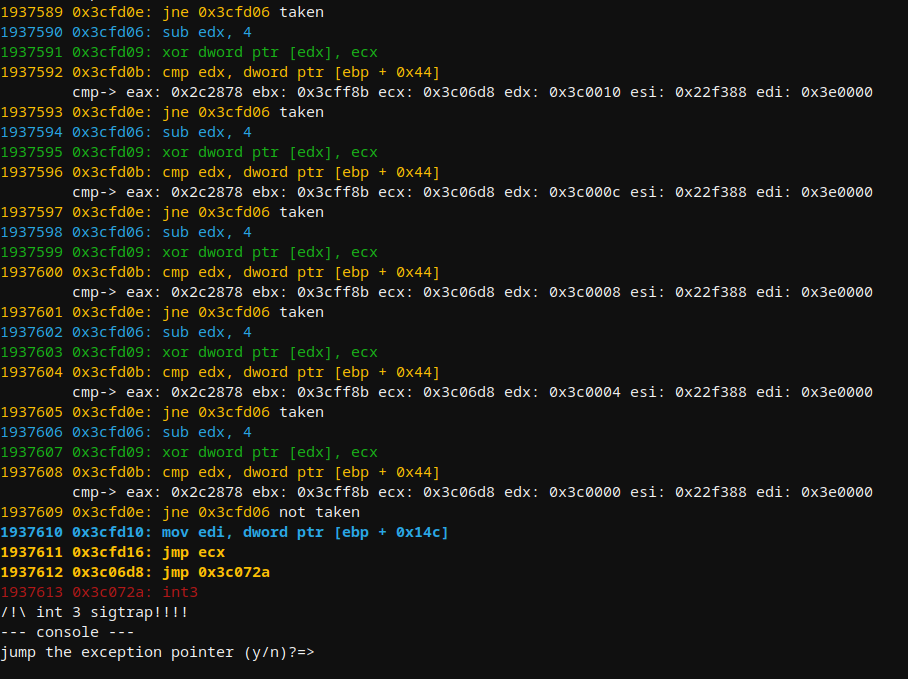
Linux에서 GuLoader win32의 약 200만 명령어를 에뮬레이션하고 도중에 CPUID 및 기타 트릭을 위조한 후 디버거를 혼동시키기 위해 sigtrap에 도달합니다. 예외 처리기

API 로더의 메모리 덤프 예시. 예외 처리기

기본적으로 여러 맵이 있으며, LoadLibraryA와 같은 API 또는 콘솔에서 수동으로 더 생성할 수 있습니다. 예외 처리기

메시지를 출력하는 LdrLoadDll() 기반의 기본 Windows 셸코드 에뮬레이션: msgbox

콘솔을 통해 CPU의 현재 상태를 보고 편집할 수 있습니다:

root@kitploit:~
--- console ---
=>h
--- help ---
q ...................... quit
cls .................... clear screen
h ...................... help
s ...................... stack
v ...................... vars
r ...................... register show all
r reg .................. show reg
rc ..................... register change
f ...................... show all flags
fc ..................... clear all flags
fz ..................... toggle flag zero
fs ..................... toggle flag sign
c ...................... continue
ba ..................... breakpoint on address
bi ..................... breakpoint on instruction number
bmr .................... breakpoint on read memory
bmw .................... breakpoint on write memory
bc ..................... clear breakpoint
n ...................... next instruction
eip .................... change eip
push ................... push dword to the stack
pop .................... pop dword from stack
fpu .................... fpu view
md5 .................... check the md5 of a memory map
seh .................... view SEH
veh .................... view vectored execption pointer
m ...................... memory maps
ma ..................... memory allocs
mc ..................... memory create map
mn ..................... memory name of an address
ml ..................... memory load file content to map
mr ..................... memory read, speficy ie: dword ptr [esi]
mw ..................... memory read, speficy ie: dword ptr [esi]  and then: 1af
md ..................... memory dump
mrd .................... memory read dwords
mds .................... memory dump string
mdw .................... memory dump wide string
mdd .................... memory dump to disk
mt ..................... memory test
ss ..................... search string
sb ..................... search bytes
sba .................... search bytes in all the maps
ssa .................... search string in all the maps
ll ..................... linked list walk
d ...................... dissasemble
dt ..................... dump structure
enter .................. step into

Cobalt Strike API 로더는 metasploit과 동일하며, 이를 에뮬레이션: API 로더

Cobalt Strike API 호출: Cobalt Strike

Metasploit rshell API 호출: MSF rshell

Metasploit SGN 인코더가 다형성을 숨기기 위해 약간의 FPU 사용: MSF 인코딩

FPU로 시작하는 Metasploit shikata-ga-nai 인코더: MSF 인코딩

PEB 구조 표시:

root@kitploit:~
=>dt
structure=>peb
address=>0x7ffdf000
PEB {
    reserved1: [
        0x0,
        0x0,
    ],
    being_debugged: 0x0,
    reserved2: 0x0,
    reserved3: [
        0xffffffff,
        0x400000,
    ],
    ldr: 0x77647880,
    process_parameters: 0x2c1118,
    reserved4: [
        0x0,
        0x2c0000,
        0x77647380,
    ],
    alt_thunk_list_ptr: 0x0,
    reserved5: 0x0,
    reserved6: 0x6,
    reserved7: 0x773cd568,
    reserved8: 0x0,
    alt_thunk_list_ptr_32: 0x0,
    reserved9: [
        0x0,
...

PEB_LDR_DATA 구조 표시:

root@kitploit:~
=>dt
structure=>PEB_LDR_DATA
address=>0x77647880
PebLdrData {
    length: 0x30,
    initializated: 0x1,
    sshandle: 0x0,
    in_load_order_module_list: ListEntry {
        flink: 0x2c18b8,
        blink: 0x2cff48,
    },
    in_memory_order_module_list: ListEntry {
        flink: 0x2c18c0,
        blink: 0x2cff50,
    },
    in_initialization_order_module_list: ListEntry {
        flink: 0x2c1958,
        blink: 0x2d00d0,
    },
    entry_in_progress: ListEntry {
        flink: 0x0,
        blink: 0x0,
    },
}
=>

LDR_DATA_TABLE_ENTRY 및 첫 번째 모듈 이름 표시:

root@kitploit:~
=>dt
structure=>LDR_DATA_TABLE_ENTRY
address=>0x2c18c0
LdrDataTableEntry {
    reserved1: [
        0x2c1950,
        0x77647894,
    ],
    in_memory_order_module_links: ListEntry {
        flink: 0x0,
        blink: 0x0,
    },
    reserved2: [
        0x0,
        0x400000,
    ],
    dll_base: 0x4014e0,
    entry_point: 0x1d000,
    reserved3: 0x40003e,
    full_dll_name: 0x2c1716,
    reserved4: [
        0x0,
        0x0,
        0x0,
        0x0,
        0x0,
        0x0,
        0x0,
        0x0,
    ],
    reserved5: [
        0x17440012,
        0x4000002c,
        0xffff0000,
    ],
    checksum: 0x1d6cffff,
    reserved6: 0xa640002c,
    time_date_stamp: 0xcdf27764,
}
=>

악성코드가 예외에 무언가를 숨기고 있음:

root@kitploit:~
3307726 0x4f9673: push  ebp
3307727 0x4f9674: push  edx
3307728 0x4f9675: push  eax
3307729 0x4f9676: push  ecx
3307730 0x4f9677: push  ecx
3307731 0x4f9678: push  4F96F4h
3307732 0x4f967d: push  dword ptr fs:[0]
Reading SEH 0x0
-------
3307733 0x4f9684: mov   eax,[51068Ch]
--- console ---
=>

예외 구조를 살펴보겠습니다:

root@kitploit:~
--- console ---
=>r esp
        esp: 0x22de98
=>dt
structure=>cppeh_record
address=>0x22de98
CppEhRecord {
    old_esp: 0x0,
    exc_ptr: 0x4f96f4,
    next: 0xfffffffe,
    exception_handler: 0xfffffffe,
    scope_table: PScopeTableEntry {
        enclosing_level: 0x278,
        filter_func: 0x51068c,
        handler_func: 0x288,
    },
    try_level: 0x288,
}
=>

여기에 오류 루틴 0x4f96f4와 필터 0x51068c가 있습니다.

스타 기록

Star History Chart

도구 다운로드