
Skip to content
KitploitKITPLOIT
도구익스플로잇블로그
Log in
제출
도구익스플로잇블로그
제출

해킹, 침투 테스트 및 사이버 보안 도구를 당신의 보안 무기고에!

Kitploit은 해킹, 사이버 보안 및 침투 테스트 도구 디렉토리입니다. 최신 프로젝트 업데이트를 발견하여 취약점을 찾고, 시스템을 분석하고, 테스트를 자동화하고, 보안을 강화하세요.

피드문의개인정보© 2026 Kitploit

도구 디렉토리

카테고리

모든 카테고리 보기
Loading categories
nightingale — Open-source alerting engine for time-series monitoring data. Connects to Prometheus, VictoriaMetrics, ElasticSearch, and other data sources. Supports 20+ notification channels, alert noise reduction, escalation, and self-healing automation. | Kitploit
도구/GitHubGitHub/ccfos/nightingale
DevSecOpsIncident Response
GitHubccfos/nightingale

nightingale

Open-source alerting engine for time-series monitoring data. Connects to Prometheus, VictoriaMetrics, ElasticSearch, and other data sources. Supports 20+ notification channels, alert noise reduction, escalation, and self-healing automation.


저장소 보기웹사이트
13.2k1.8k1153일 전Kitploit 검토 완료
공유
요청한 언어로 콘텐츠를 사용할 수 없습니다. 영어 버전을 표시합니다.

Nightingale

Open-source alerting for your existing stack

Latest release Go Reference Coverage status Apache-2.0 license GitHub stars Docker pulls Join the Nightingale Slack community

Quick start · Documentation · Download · Releases · Community

English | 中文 | 日本語

Nightingale brings alert rules, event processing, and notification routing into one place. Connect Prometheus, VictoriaMetrics, Elasticsearch, Loki, ClickHouse, and other data sources you already run, then deliver alerts to Slack, PagerDuty, and your team's existing tools.

Self-hosted · Apache-2.0 · Built-in AI agent · MCP server
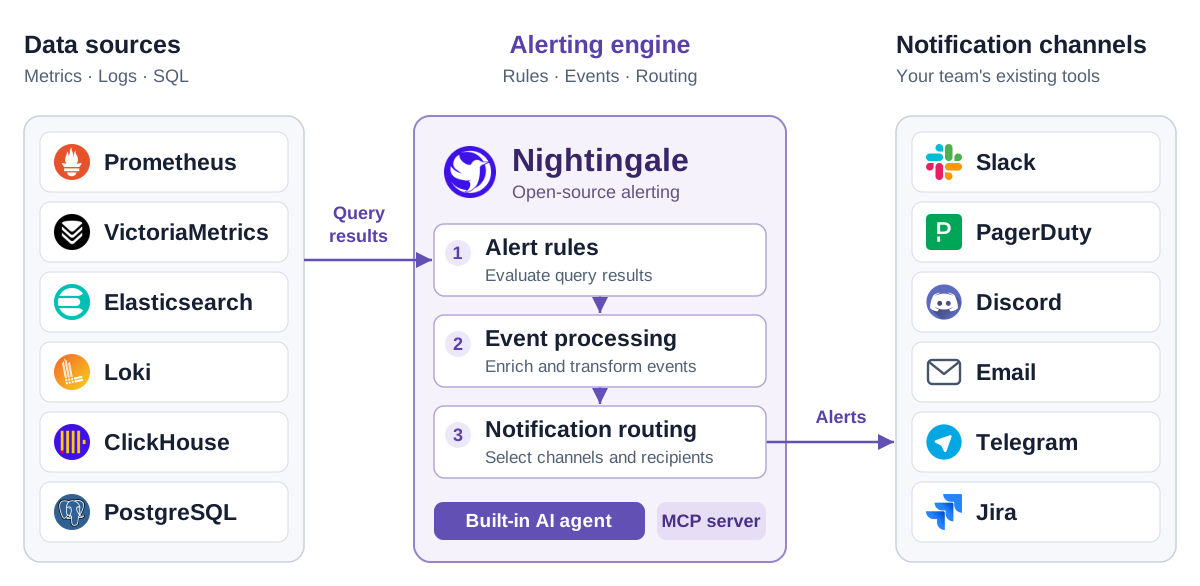
Nightingale queries Prometheus, VictoriaMetrics, Elasticsearch, Loki, ClickHouse, and PostgreSQL, evaluates alert rules, processes events, and routes notifications to Slack, PagerDuty, Discord, Email, Telegram, and Jira. The engine includes an AI agent and MCP server.

Why Nightingale?

  • Give teams ownership of their alerts. Organize rules into business groups, assign team permissions, and manage rules and notification settings through the UI and API.
  • Bring scattered alerting into one place. Evaluate rules against metrics, logs, and SQL data sources while keeping your existing collectors, storage, and Grafana dashboards.
  • Understand what happened to an alert. Inspect rule evaluation records, historical events, and notification results to trace a query through to delivery.

Quick start

With Git and Docker Compose installed, start the included evaluation stack:

git clone https://github.com/ccfos/nightingale.git
cd nightingale/docker/compose-bridge
docker compose up -d

This starts Nightingale, MySQL, Redis, VictoriaMetrics, and Categraf. Open http://localhost:17000 and sign in with root / root.2020.

To get your first alert:

  1. Connect a data source. Add your existing Prometheus-compatible endpoint, or use http://victoriametrics:8428 for the VictoriaMetrics instance in this Compose stack.
  2. Create an alert rule. Choose a business group and data source, then enter a PromQL expression. For an always-firing test, use vector(1) > 0 and set the duration to 0.
  3. Configure delivery. Set up a notification channel, create a notification rule, and attach it to the alert rule. Check that the test notification arrives, then disable the test alert.

The Compose stack uses example credentials and exposes service ports for local evaluation. Change credentials and review network access before deploying on a shared or public host. See deployment options for other ways to run Nightingale.

How it fits into your stack

Nightingale queries your data sources, evaluates alert conditions, processes events, and routes notifications. Your existing data stays in its current stores.

Keep Grafana for visualization and your on-call platform for scheduling, escalation, and incident response. Nightingale also includes dashboards for teams that want to explore data alongside their alerts.

Starting without a monitoring stack? The standalone configuration includes an optional embedded TSDB for small, single-instance deployments. Categraf is an optional collector for hosts, middleware, databases, and network devices.

Key capabilities

CapabilityWhat you can do
Alerting across data sourcesUse PromQL, log queries, or SQL to define conditions. Apply a rule to multiple instances of the same data source type.
Team ownershipGroup rules and dashboards by business group, assign team permissions, and connect OIDC, OAuth2, LDAP, or CAS for sign-in.
Event processing and routingMute notifications, subscribe to alerts, enrich or rewrite labels, and route events through conditional pipelines.
Alert execution recordsReview evaluation queries and results, active and historical events, and notification delivery records.
Reusable integrationsStart with bundled collector configurations, alert rules, and dashboards. Review queries and thresholds for your environment before enabling them.
Distributed evaluationDistribute rules across alerting engines and use n9e-edge to evaluate alerts close to remote data sources.

Notification integrations include Slack, PagerDuty, Discord, Email, Telegram, Mattermost, Jira, and Jira Service Management, with HTTP webhooks and scripts for custom destinations. See the native notification channel reference for configuration details.

For automated responses, connect ibex to run predefined remediation scripts when an alert fires.

Built-in AI agent

Nightingale includes an AI agent you can use directly in the web UI. The agent runs inside Nightingale, calls tools to inspect your monitoring data and configuration, and works through tasks over multiple steps.

  • Investigate alerts. Query related metrics and logs, inspect affected hosts, and explain findings using the data it retrieves.
  • Troubleshoot the alerting process. Inspect rules, evaluation logs, mute settings, event processing, and notification results to find why an alert did not fire or reach its destination.
  • Create and update configuration. Build alert rules and dashboards, generate PromQL and SQL, and configure notification rules, mutes, and subscriptions through conversation. The built-in tools for updating existing alert rules and dashboards present proposed changes for confirmation.
  • Extend it with Skills. Bundled Skills cover common monitoring workflows. Add your team's procedures, reference material, and scripts as custom Skills, including Skills imported from Git.

For example:

Why did this alert fire? Check the affected host's metrics and logs around the trigger time.

Create a memory-usage alert for the production hosts and notify our team in Slack.

도구 다운로드

인기

모두 보기 →

커뮤니티에서 가장 많이 사용되는 도구를 찾아보세요.

  • 1

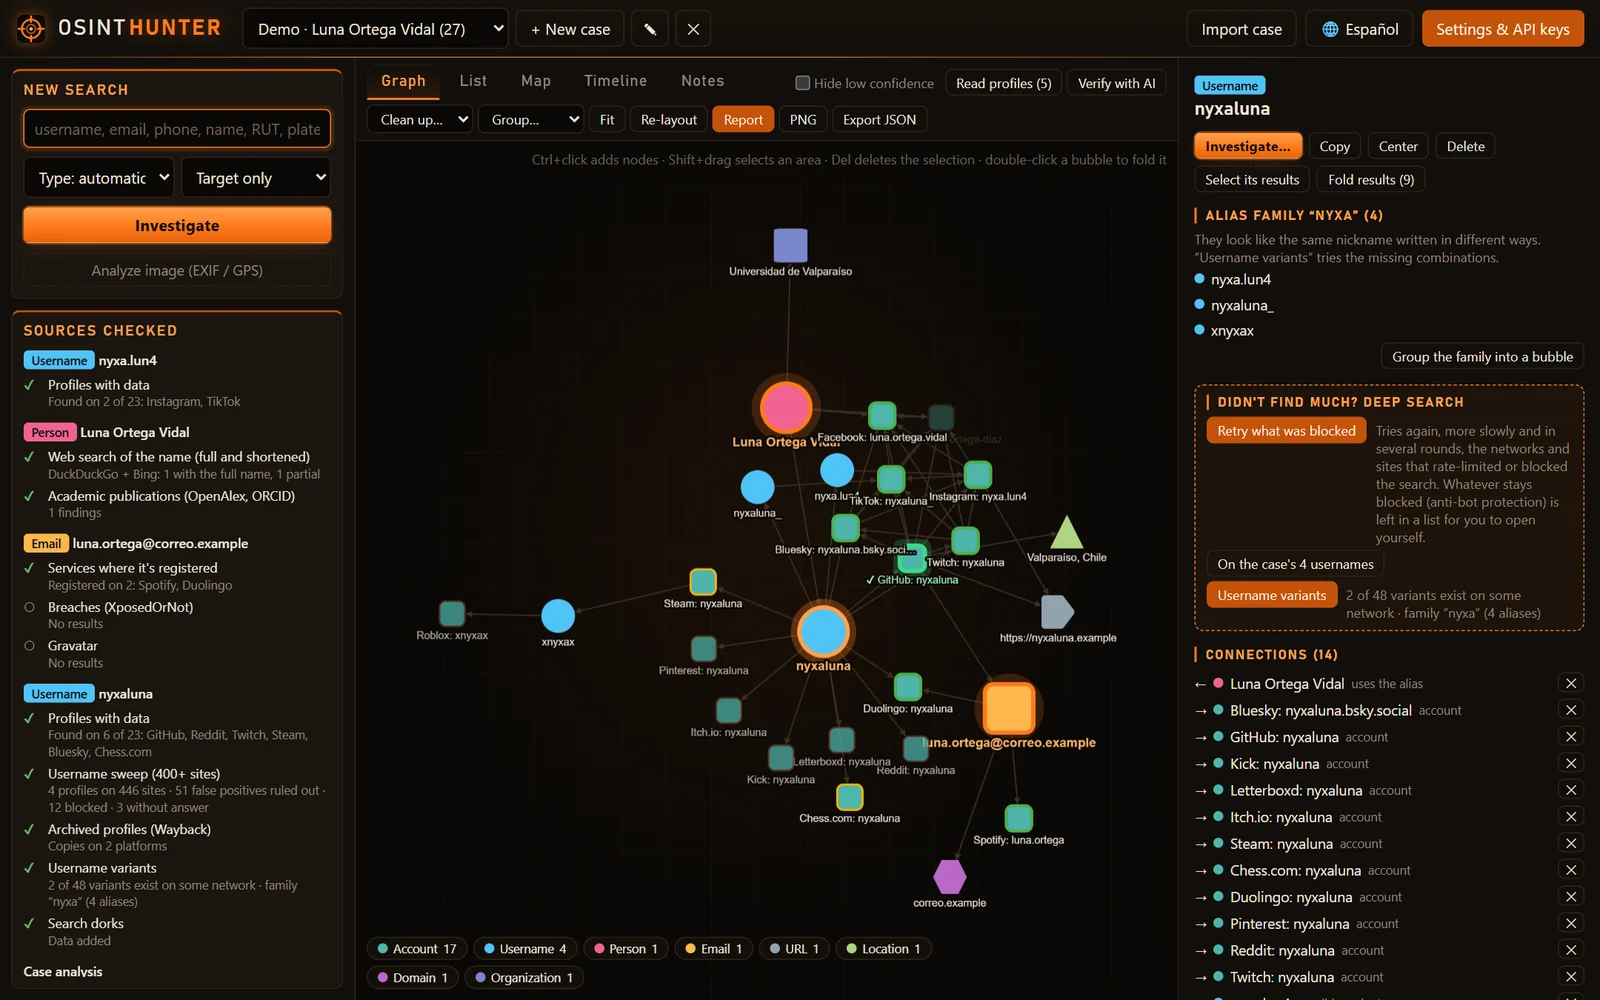
    OsintHunter

    letox4/osinthunter

    🎯 궁극의 OSINT 툴킷: 조사 그래프, 신뢰도 점수 산정, 별칭 패밀리, 지도, 타임라인 및 보고서. 49개 모듈, 400개 이상 사이트, API 키 불필요.

    911
  • 2

    ghostlock-app

    yukonga/ghostlock-app

    # GhostLock 원탭 실행 앱 (CVE-2026-43499)

    707
  • 3

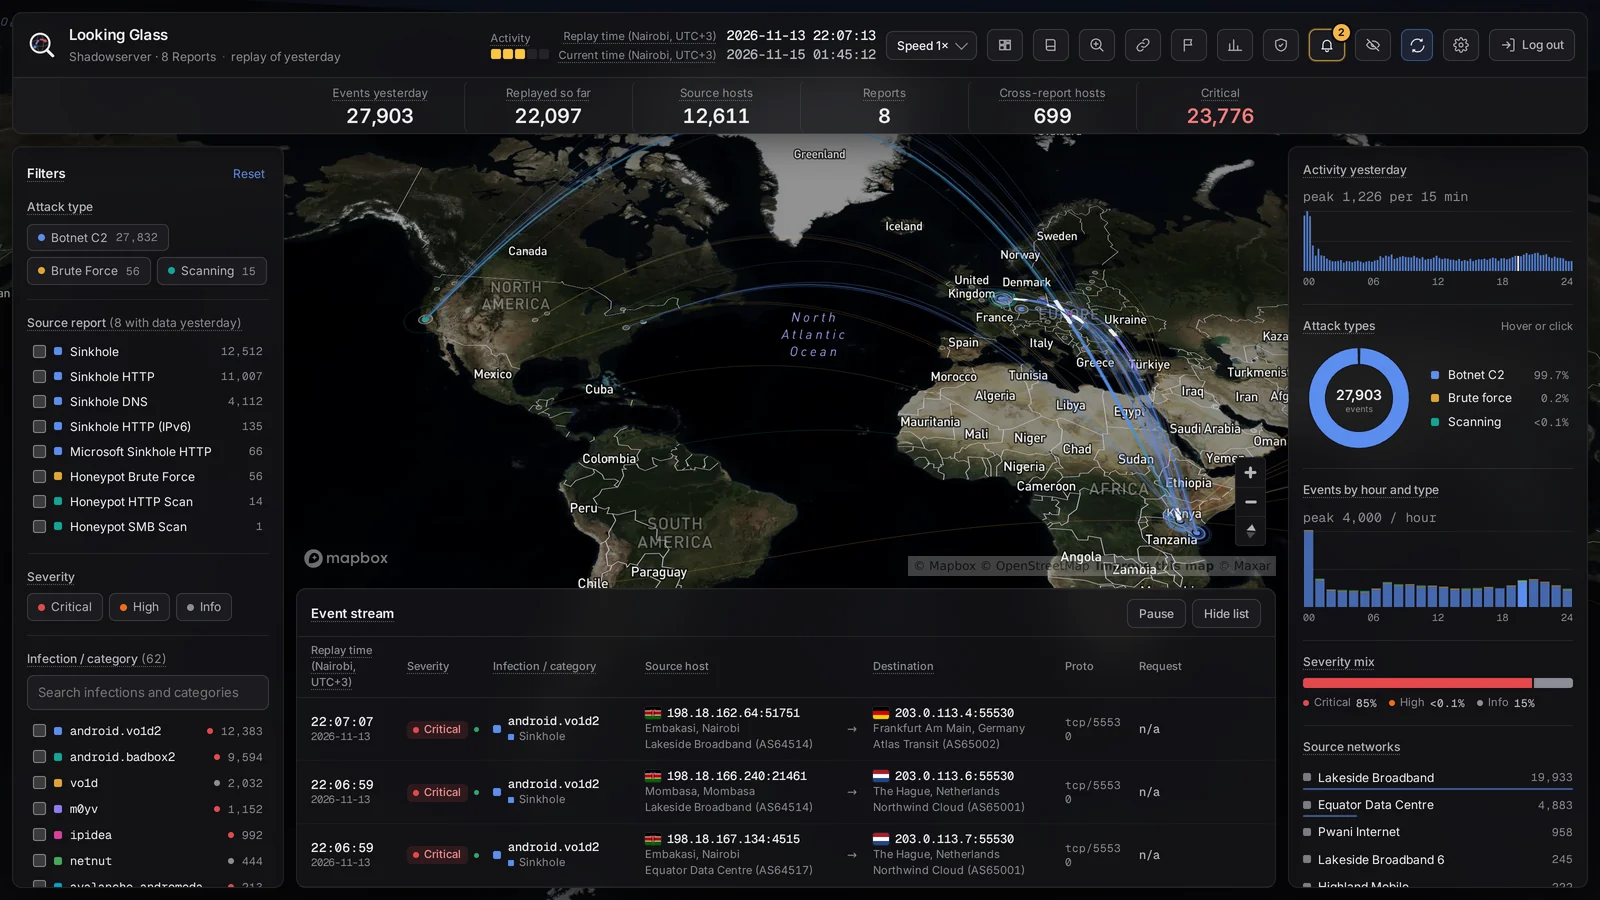
    looking-glass

    anonghosty/looking-glass

    Shadowserver 보고서를 MongoDB로 수집하고 이를 대화형 지도, 분석, 발견 사항, 권고 및 경영진 대시보드로 재생하는 CSIRT 플랫폼입니다.

    431
  • 4

    jumpserver

    jumpserver/jumpserver

    JumpServer는 오픈소스 권한 접근 관리(PAM) 플랫폼으로, DevOps 및 IT 팀이 웹 브라우저를 통해 SSH, RDP, Kubernetes, 데이터베이스 및 RemoteApp 엔드포인트에 주문형 보안 액세스를 제공합니다.

    405
  • 5

    SafeLine

    chaitin/safeline

    악성 HTTP 트래픽을 필터링하고 SQL 인젝션, XSS, 봇 공격을 차단하며, 속도 제한 및 동적 HTML/JS 암호화를 제공하는 자체 호스팅 WAF 및 리버스 프록시입니다.

    352
  • 6

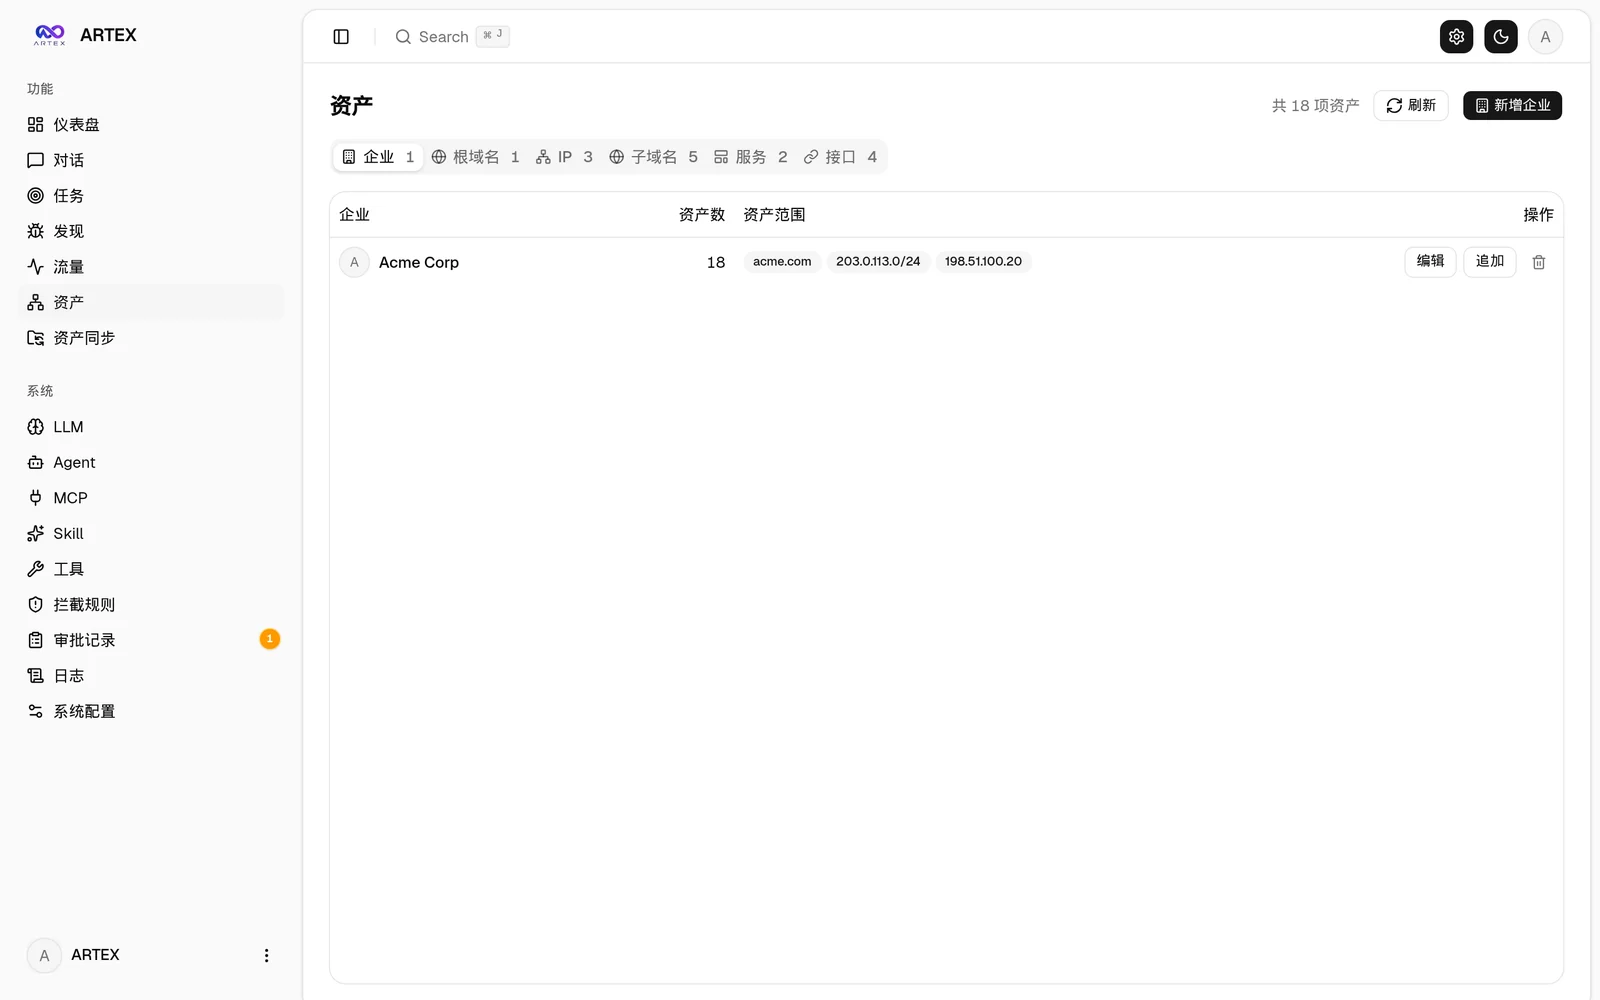
    ARTEX

    baarai/artex

    LLM 멀티 에이전트 자율 침투 테스트 플랫폼으로, 플래너/워커 에이전트, 자산 및 탐색 그래프, MITM 트래픽 기록, 취약점 재테스트 기능을 제공합니다.

    342

모든 도구 탐색

도구 컬렉션을 둘러보세요

모든 도구 보기 →