
Skip to content
KitploitKITPLOIT
도구익스플로잇블로그
Log in
제출
도구익스플로잇블로그
제출

해킹, 침투 테스트 및 사이버 보안 도구를 당신의 보안 무기고에!

Kitploit은 해킹, 사이버 보안 및 침투 테스트 도구 디렉토리입니다. 최신 프로젝트 업데이트를 발견하여 취약점을 찾고, 시스템을 분석하고, 테스트를 자동화하고, 보안을 강화하세요.

피드문의개인정보© 2026 Kitploit

도구 디렉토리

카테고리

모든 카테고리 보기
Loading categories
mac-monitor — Advanced macOS system monitor leveraging Apple Endpoint Security to collect, enrich, and display process, file, memory, and XPC events for malware triage, threat hunting, and forensic analysis. | Kitploit
도구/GitHubGitHub/brandon7cc/mac-monitor
Dynamic Analysis (Sandboxing)ForensicsMalware AnalysisLearning & EducationIncident Response
GitHubbrandon7cc/mac-monitor

mac-monitor

Advanced macOS system monitor leveraging Apple Endpoint Security to collect, enrich, and display process, file, memory, and XPC events for malware triage, threat hunting, and forensic analysis.

저장소 보기
1.4k66476일 전Kitploit 검토 완료
공유
요청한 언어로 콘텐츠를 사용할 수 없습니다. 영어 버전을 표시합니다.

Welcome to Mac Monitor

Feature overview

Mac Monitor is an advanced, stand-alone system monitoring tool tailor-made for macOS security research, malware triage, and system troubleshooting. Built on Apple's Endpoint Security (ES) and System Extension APIs, it collects and enriches process, interprocess, memory, XPC and file events, and helps you surface only the ones relevant to you.

OBTS v8.0 Presentation

Introducing the Next Generation of Mac Monitor:

  • 📊 Slides
  • 📺 YouTube

Requirements

  • Processor: We recommend an Apple Silicon machine, but Intel works too!
  • System memory: 4GB+ is recommended
  • macOS version: 13.1+ (Ventura)

How can I install this thing?

☕️ (Recommended) Homebrew

  • brew install --cask mac-monitor

📦 Installer package

  • Download the latest installer from releases.

Install

  • Open Mac Monitor.app and "Allow" the System Extension when prompted.
  • Turn on Full Disk Access for Mac Monitor Security Extension in System Settings.
  • 🏎️ Click "Start". Done!

Settings > General > Check Now looks for updates.
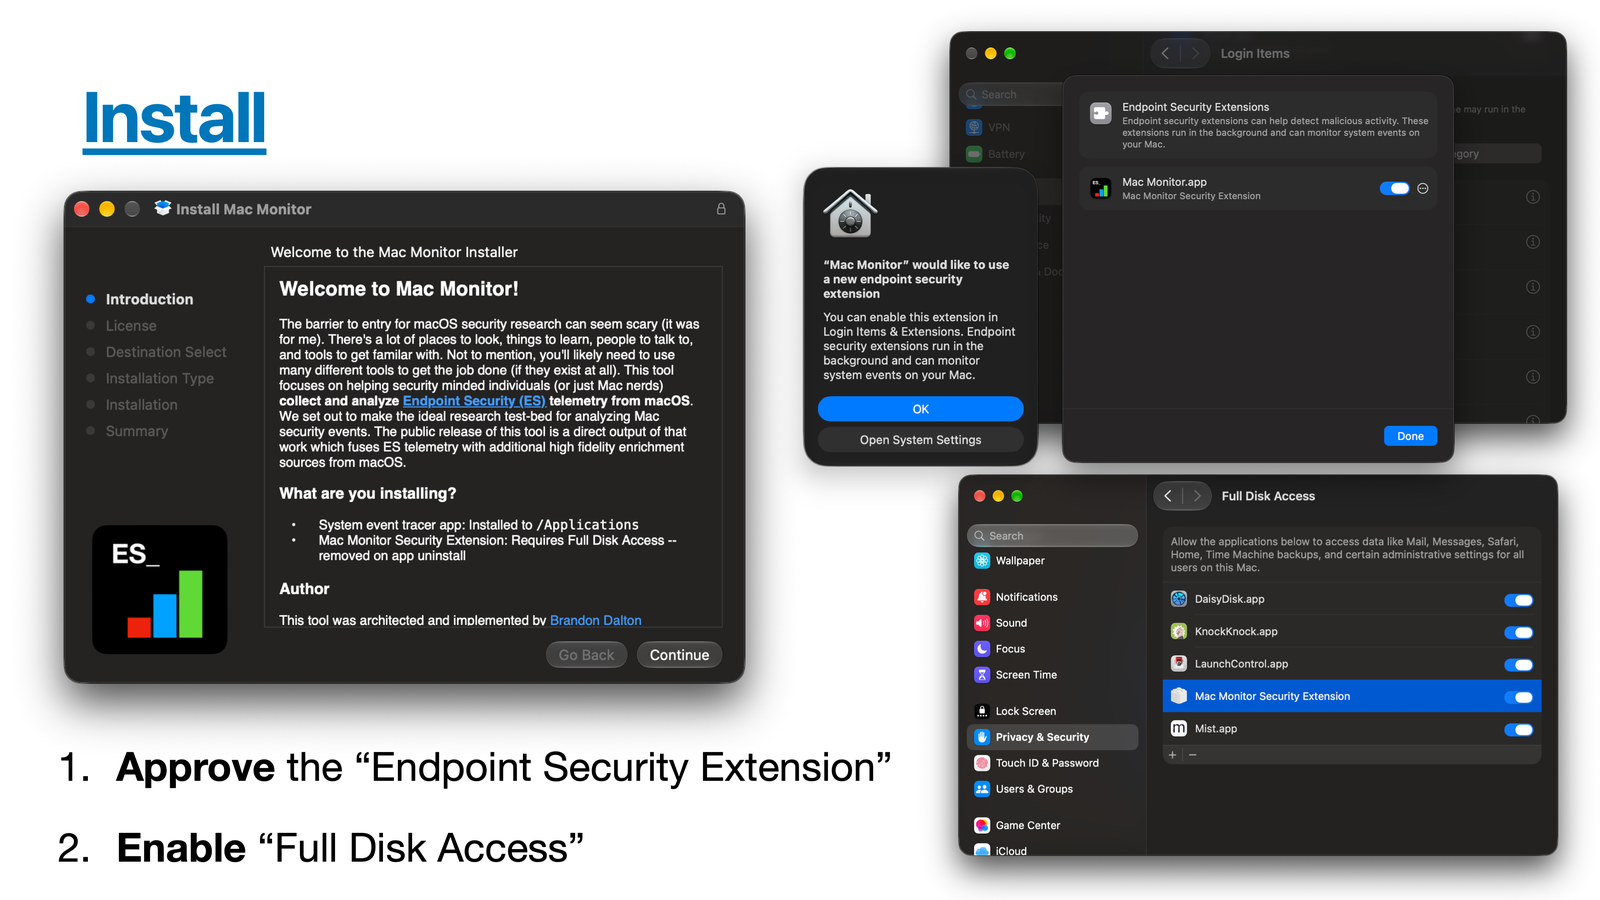
Install process

Install footprint

  • App: /Applications/Mac Monitor.app (com.swiftlydetecting.agent)
  • Security Extension: com.swiftlydetecting.agent.securityextension
  • Command line tool: inside the app, linked to /usr/local/bin/macmonitor if you install it from Settings
  • Saved sets: mutes.json and indicators.json in /Library/Application Support/com.swiftlydetecting.agent.securityextension/

Uninstall

  • From the Finder delete the app and authenticate to remove the System Extension. It's that easy!
  • Or run Mac Monitor.app/Contents/SharedSupport/uninstall.sh, which also removes the saved sets and the macmonitor link.

Path mutes

Mac Monitor keeps one saved mute set. It survives restarts, applies right away, and is shared with sudo macmonitor.

  • Settings > Path Muting shows it. Right click an event to add a mute.
  • Import, export or reset it there too. Import reads 2.1 exports, so export your mutes from 2.1 before updating.
  • Endpoint Security matches resolved paths: use /private/tmp/..., not /tmp/....

Command line

macmonitor streams events to a terminal or a pipe while Mac Monitor keeps recording. Install it from Settings > Command Line.

sudo macmonitor stream                     # Mac Monitor's default events
sudo macmonitor stream exec fork exit      # only these events
sudo macmonitor stream all | jq -c .       # every event, as JSONL
sudo macmonitor stream exec --for 30s      # 30 seconds of execs
sudo macmonitor stream close --every close # every close, not only those of modified files

# an osascript script asking for a password, as macOS stealers do
sudo macmonitor stream exec --target '/osascript$' \
    --predicate 'event.exec.script_content CONTAINS[c] "display dialog" AND event.exec.script_content CONTAINS[c] "password"'

sudo macmonitor mute list                  # the saved mute set
sudo macmonitor indicators list            # this Mac's indicators, with each one's severity
sudo macmonitor indicators show 'Plist modified'  # every detail of one, by name or ID
sudo macmonitor indicators edit 'Plist modified' --severity medium  # change one, keeping its ID
sudo macmonitor stream --indicator 'Plist modified'  # events the Security Extension matched to it
macmonitor validate trace.jsonl            # check an export against the schema
macmonitor status                          # versions, what the Security Extension needs, and who is capturing
  • Text on a terminal, JSONL when piped: the same records as Export telemetry, an eslogger superset.
  • macmonitor help <command> covers every option.
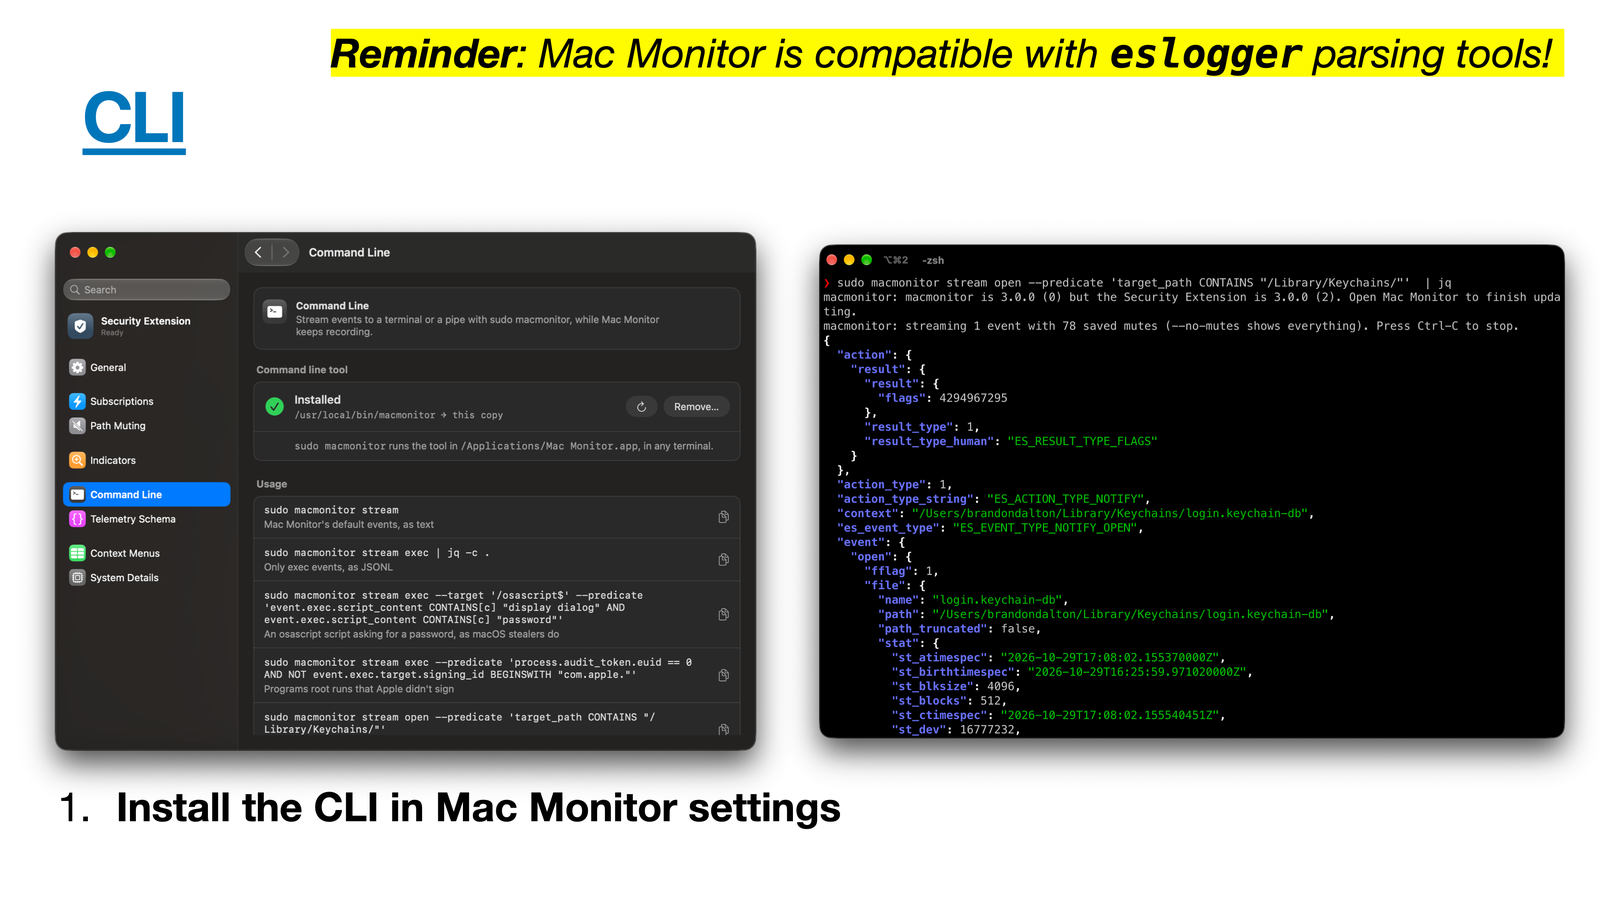
The command line tool

What are some standout features?

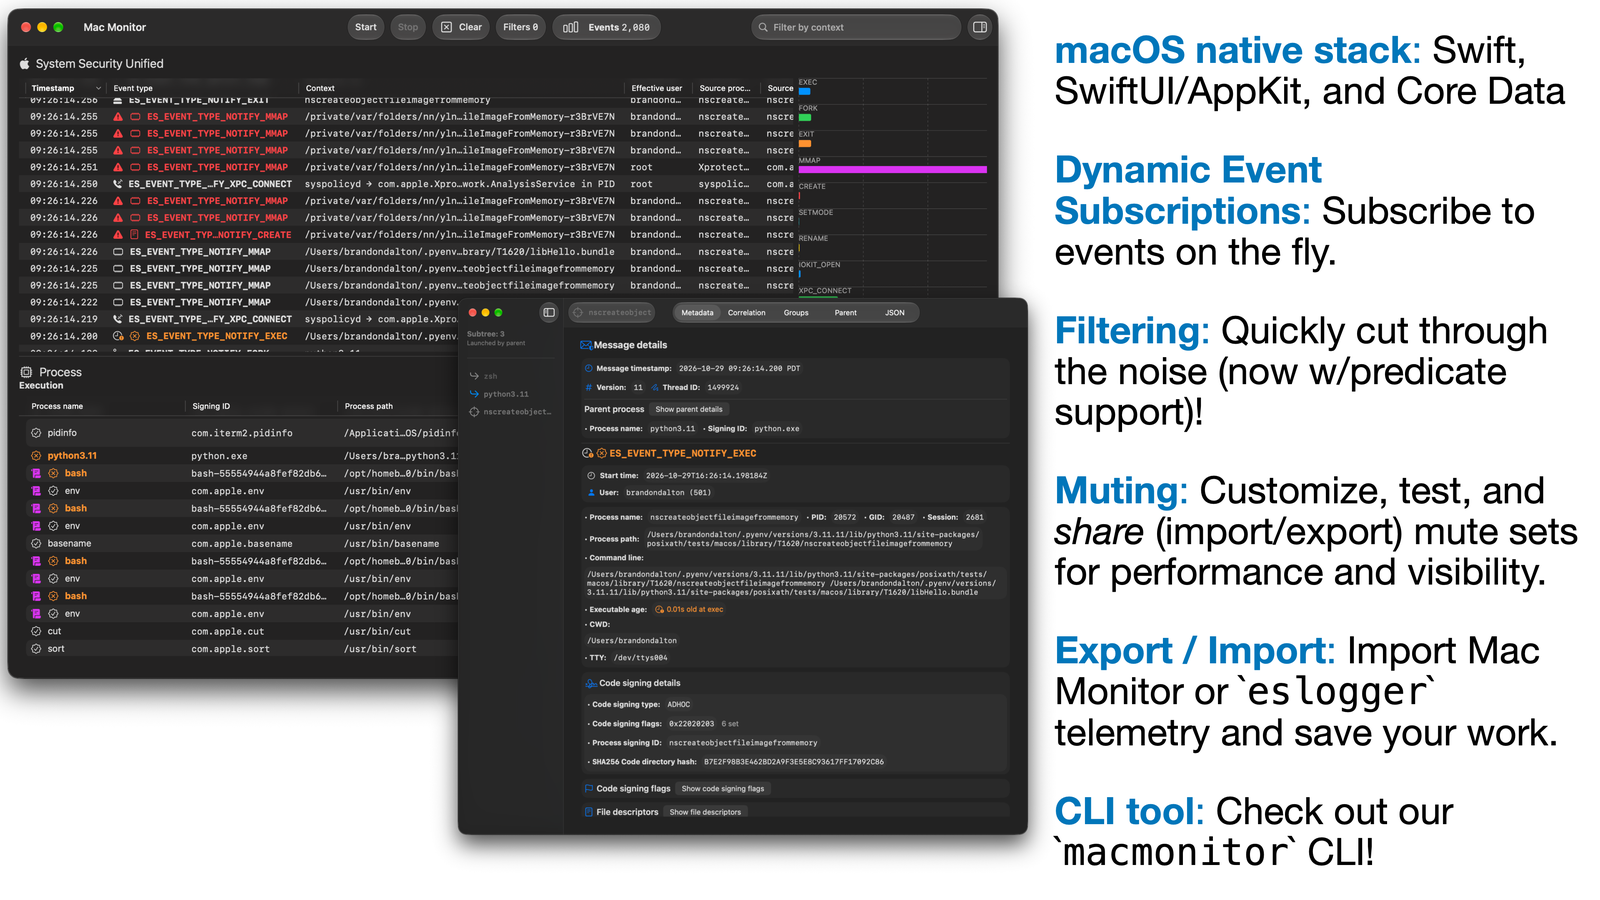
  • High fidelity ES events, enriched: code signing, quarantine, script content, and the process that really launched each one.
    • More on each event: a process's age, the bundle behind a background item, an mmap's protections, what a setmode added, and the driver behind an IOKit open.
  • File type identification: mmaps, modified closes and renames say what a file is from its content, never its name: a Mach-O, a script, an archive, a disk image. Search event.close.mach_o_type == "MH_EXECUTE" for executables written to disk.
  • Dynamic event subscriptions: change what you subscribe to on the fly to cut down on noise.
  • Path muting at the API level: es_mute_path and es_mute_path_events, with every ES_MUTE_PATH_TYPE_*.
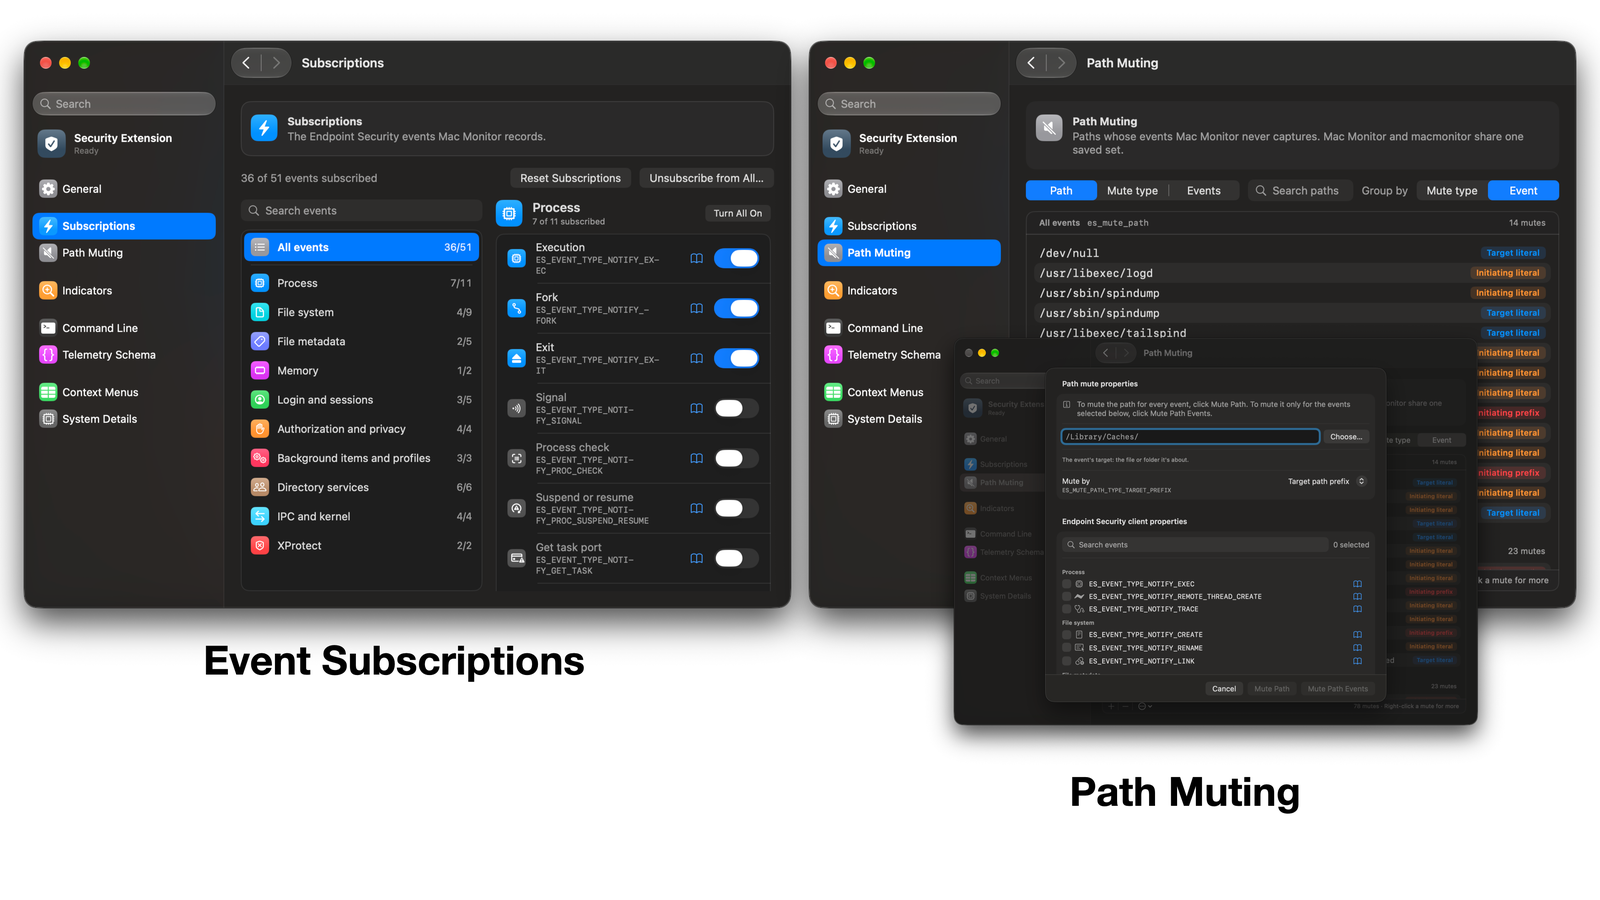
Path muting and event subscriptions

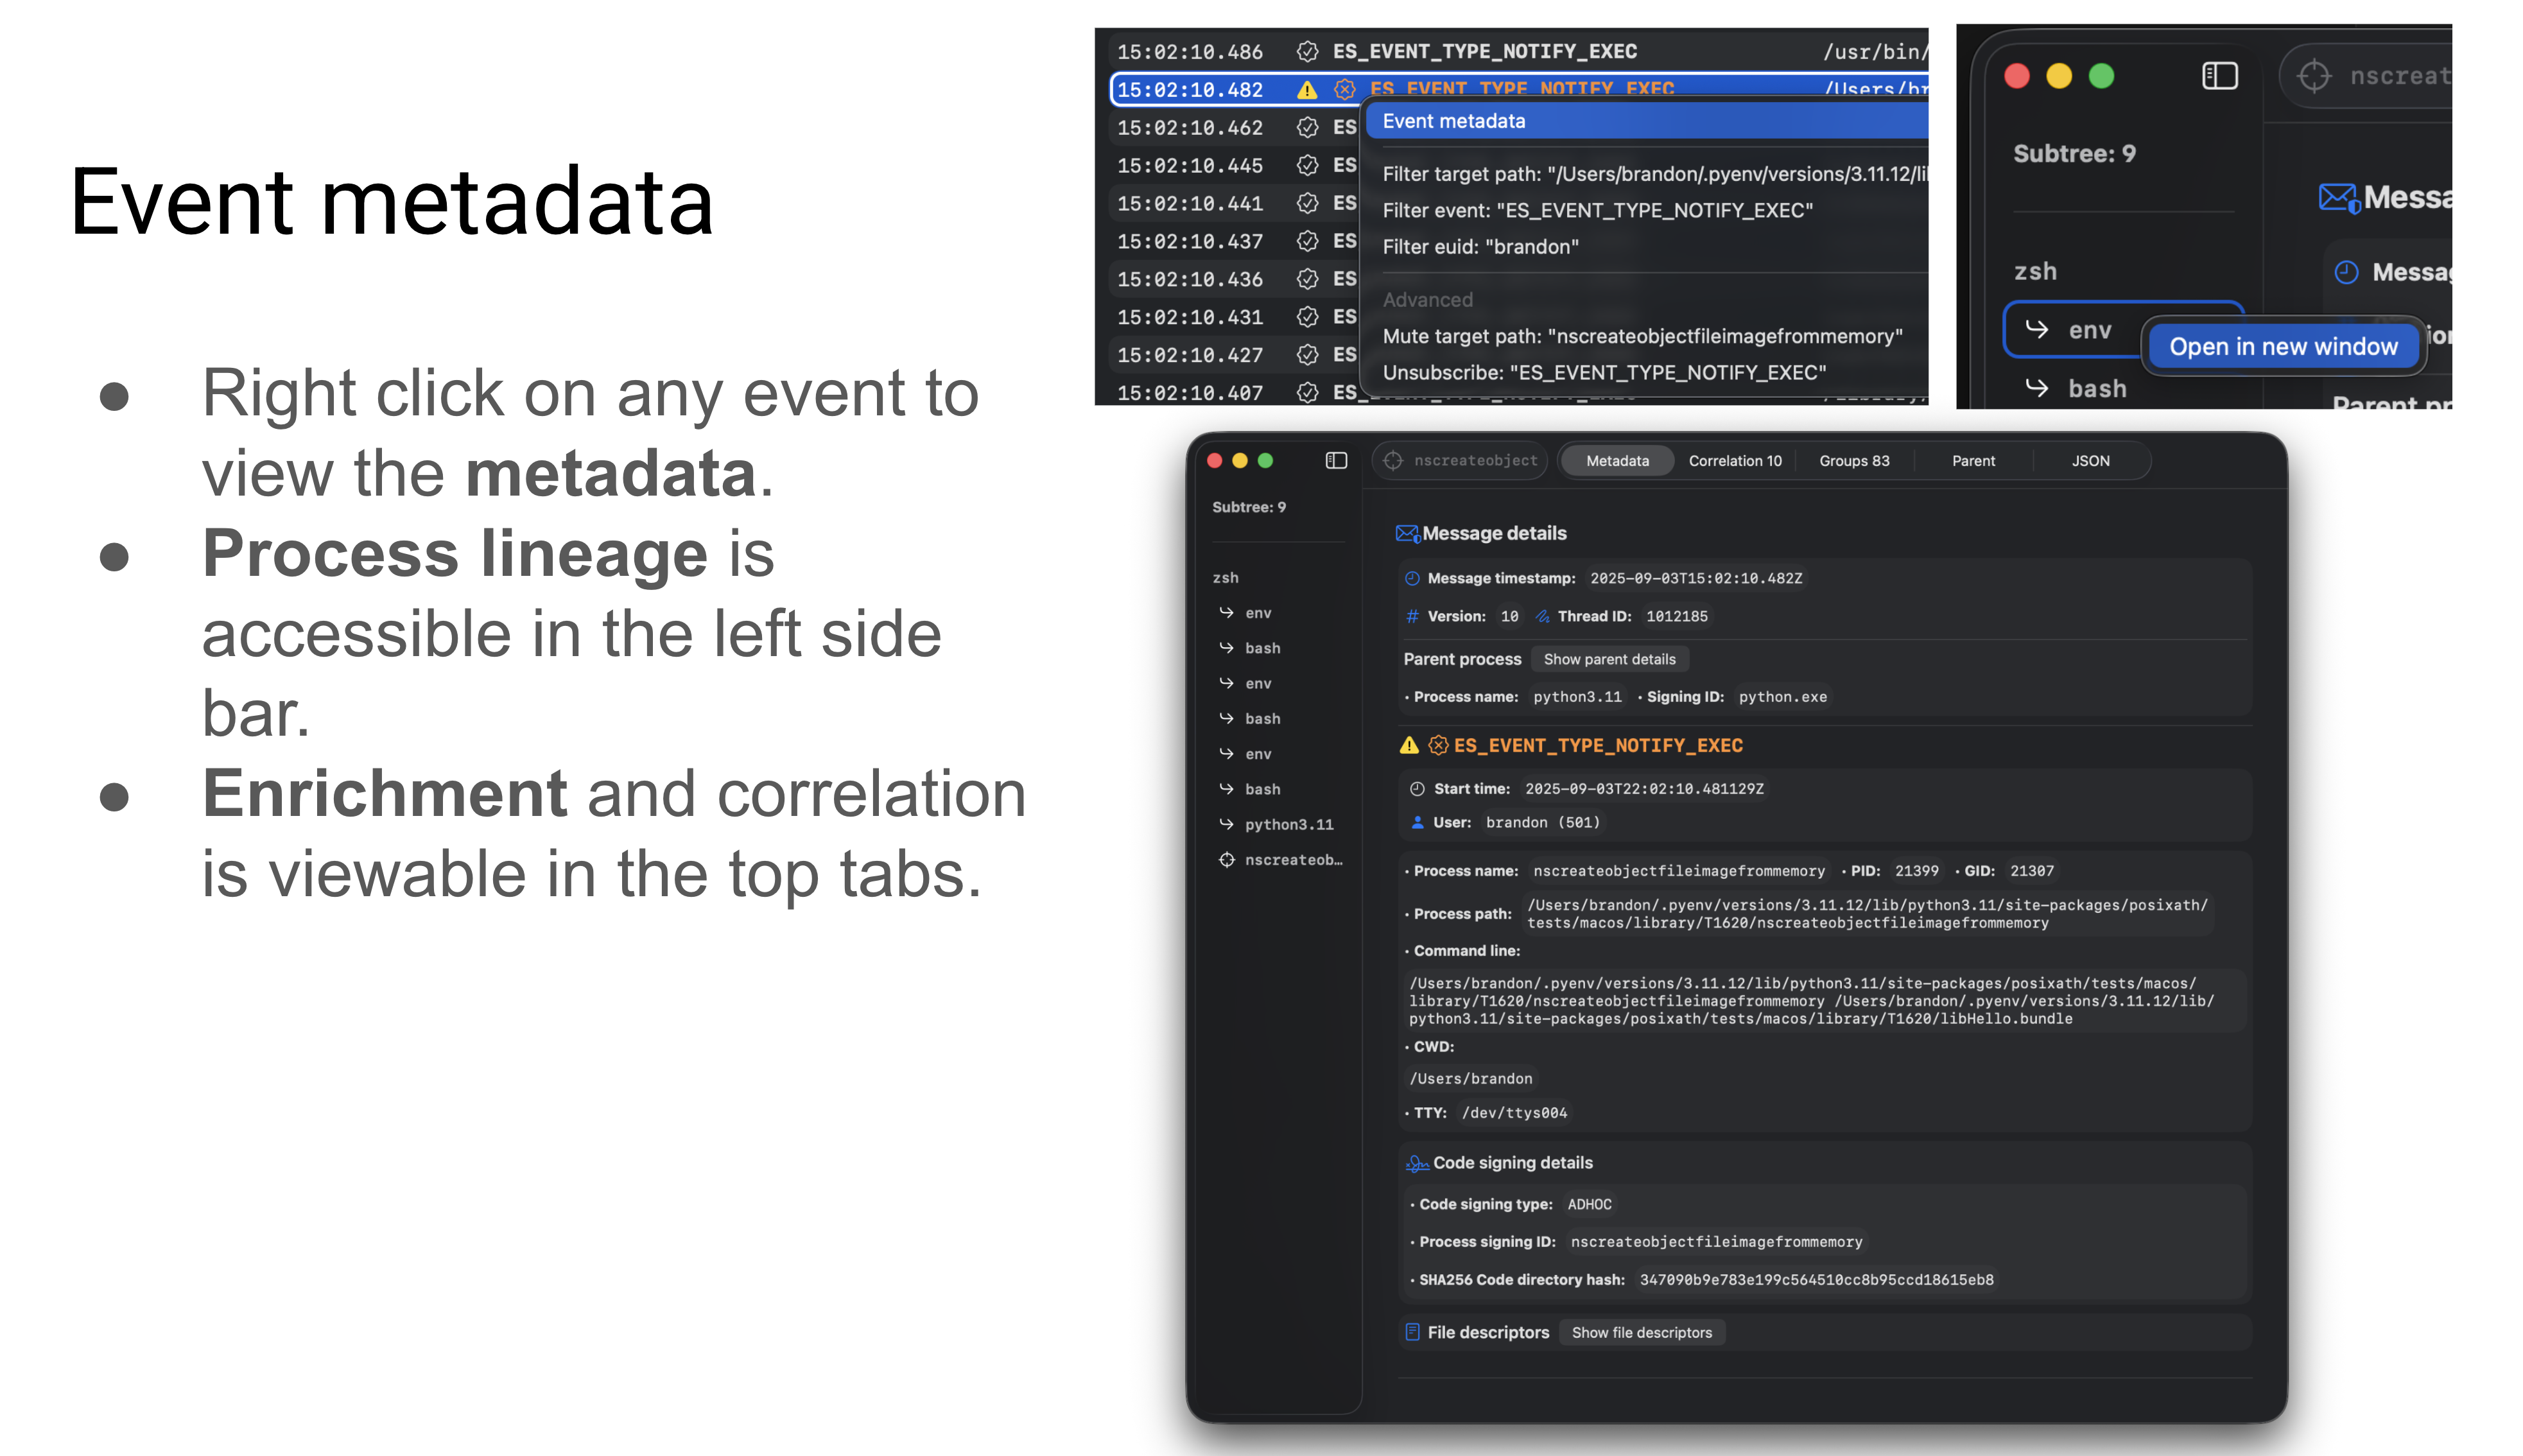
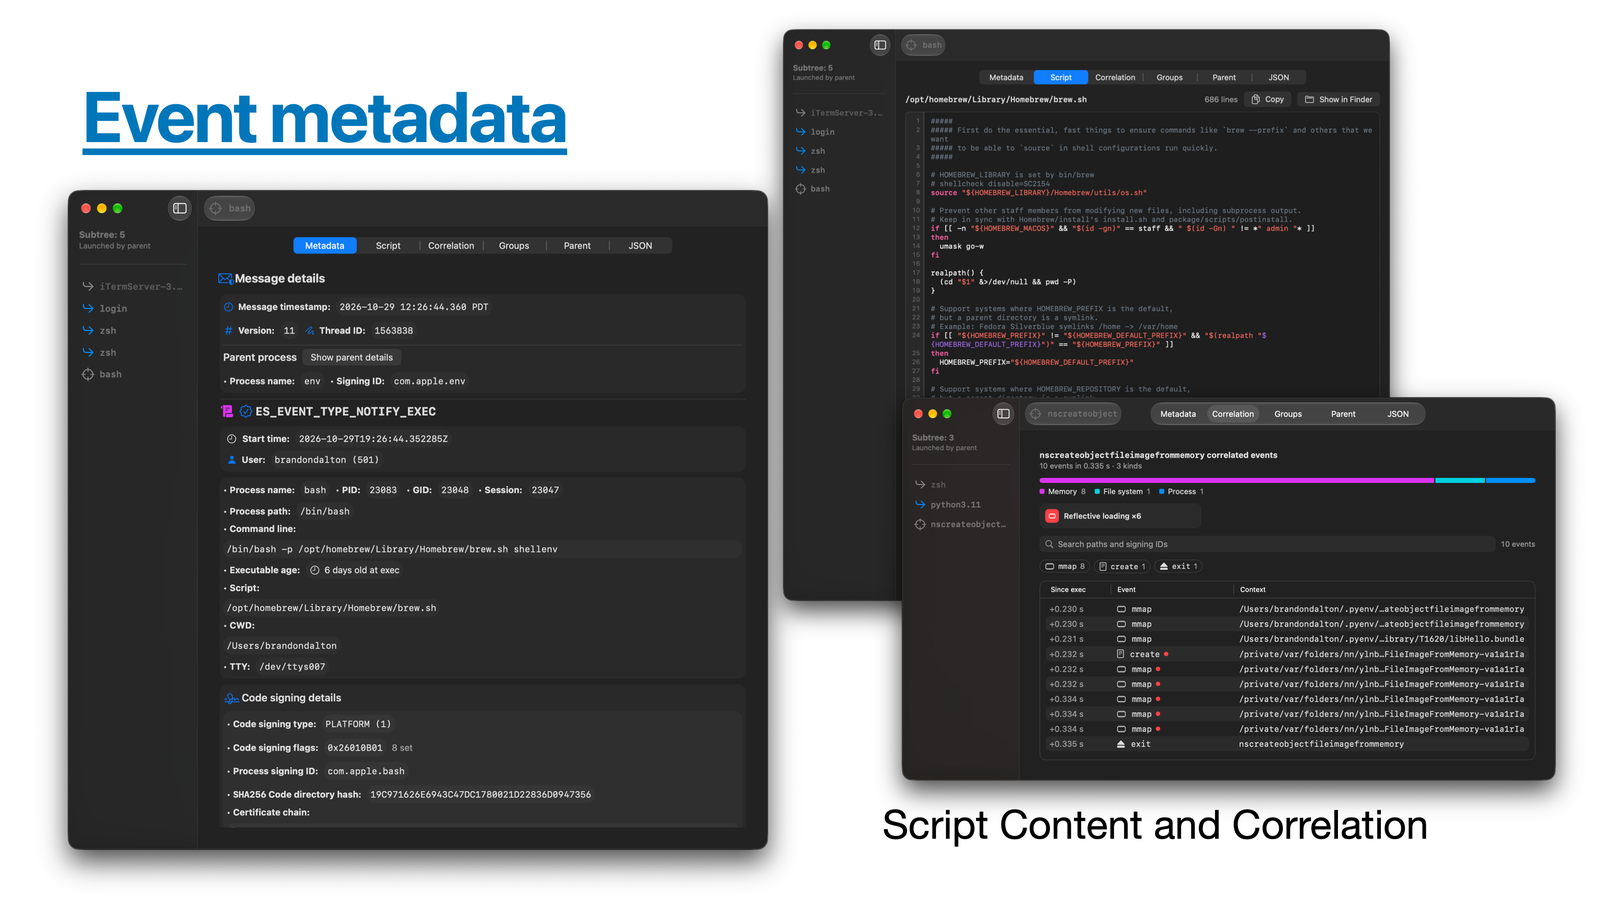
  • Event facts: double click any event for its metadata, script, correlated events, process group and JSON. Right click for filtering, muting and unsubscribing.
  • Event correlation: every event a process caused, linked to it, with a summary and indicator cards.
  • Process subtree: Event Facts' sidebar shows the process's lineage. Click any process to open its facts.

Event facts overview

  • Indicators: predicates that point out events worth a look. Change Mac Monitor's own or write your own in Settings > Indicators.
    • They run in the Security Extension, so every record and every macmonitor stream lists what it matched, and Mac Monitor can notify you of a High or Medium match. 43 ship by default, each with a severity and an ATT&CK tactic.
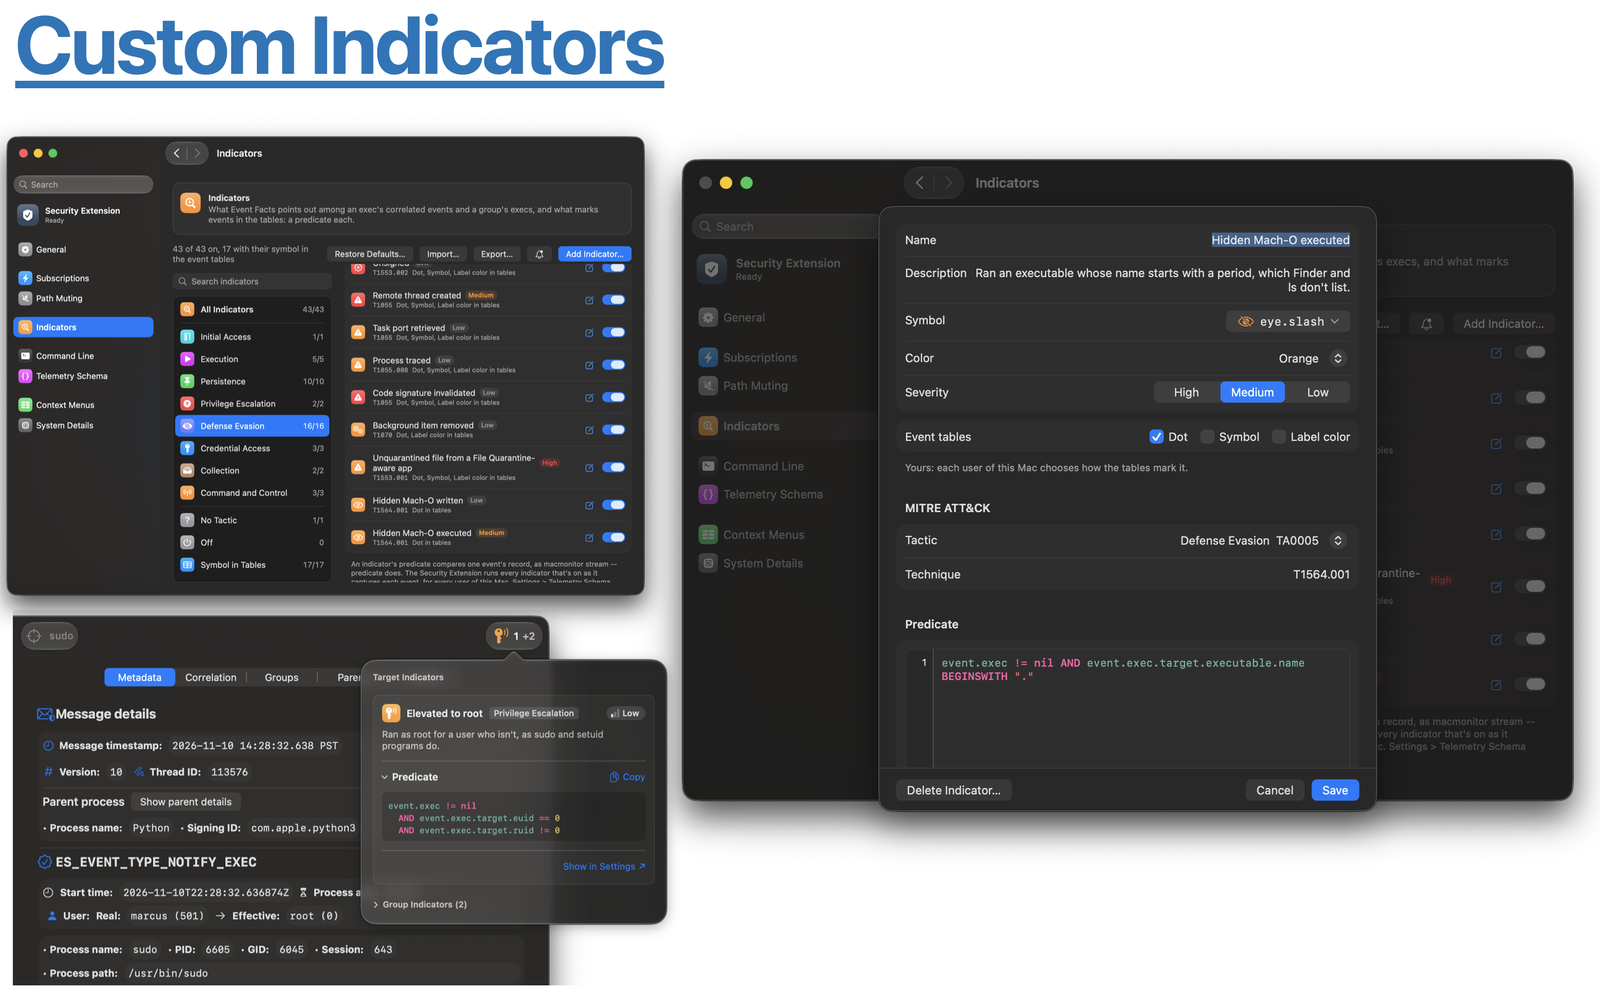
Custom indicators

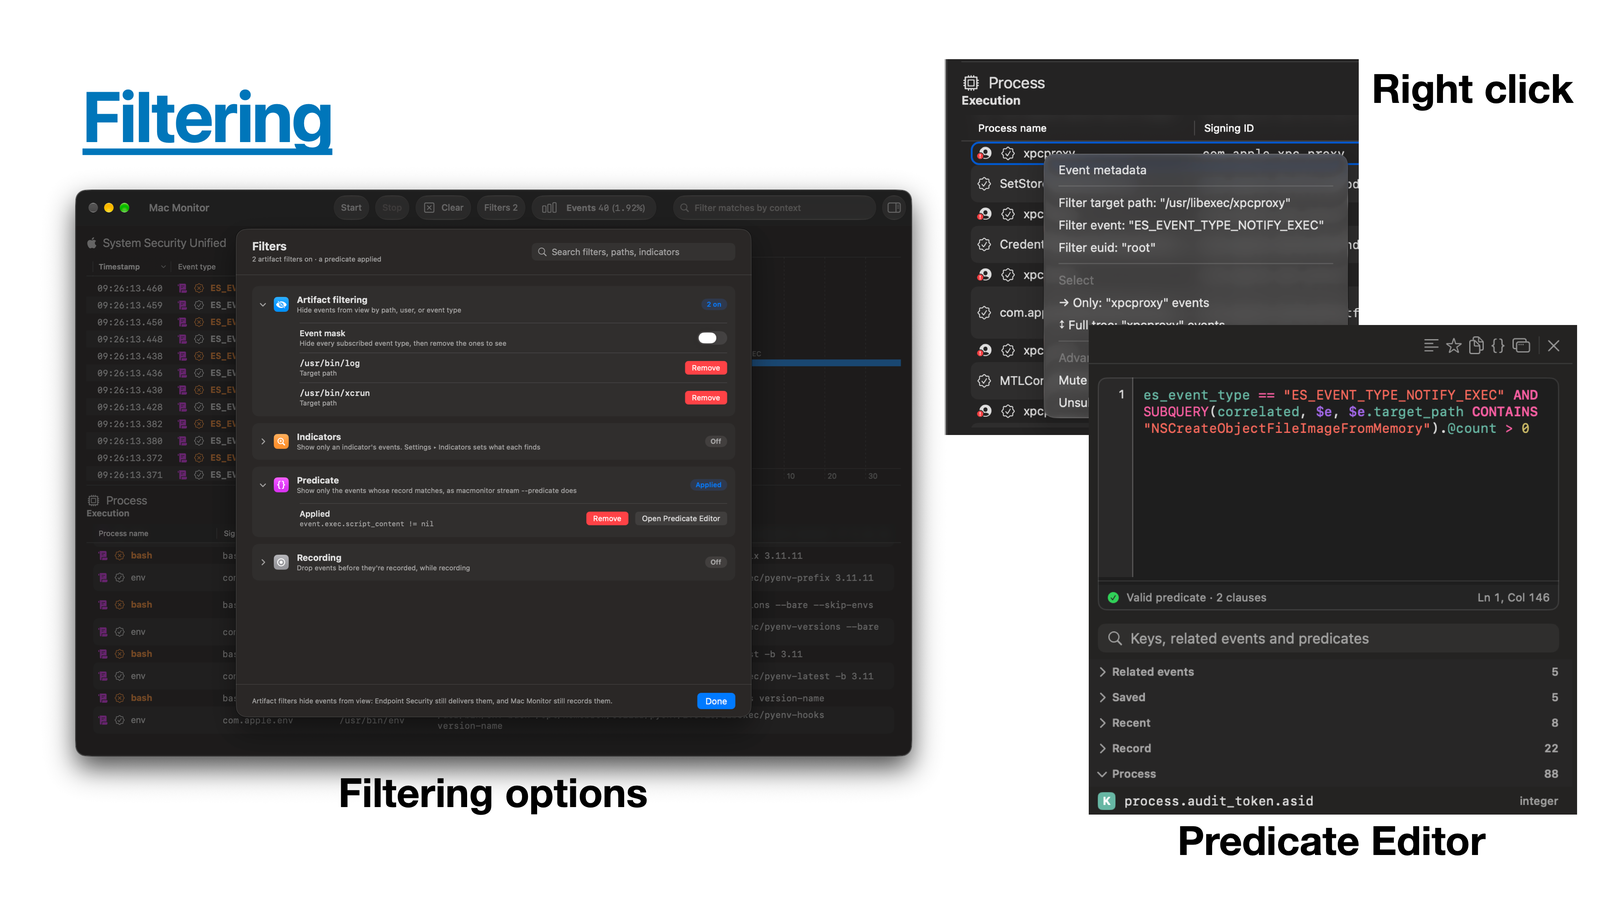
  • Filtering: hide events by type, process or path without losing them, or drop events while recording.
    • Or filter with a predicate in the predicate editor (View > Predicate Editor, ⌥⌘F).

Filtering and the predicate editor

  • Export and open traces: export JSON or JSONL, and open Mac Monitor or eslogger traces (File > Open Trace...).
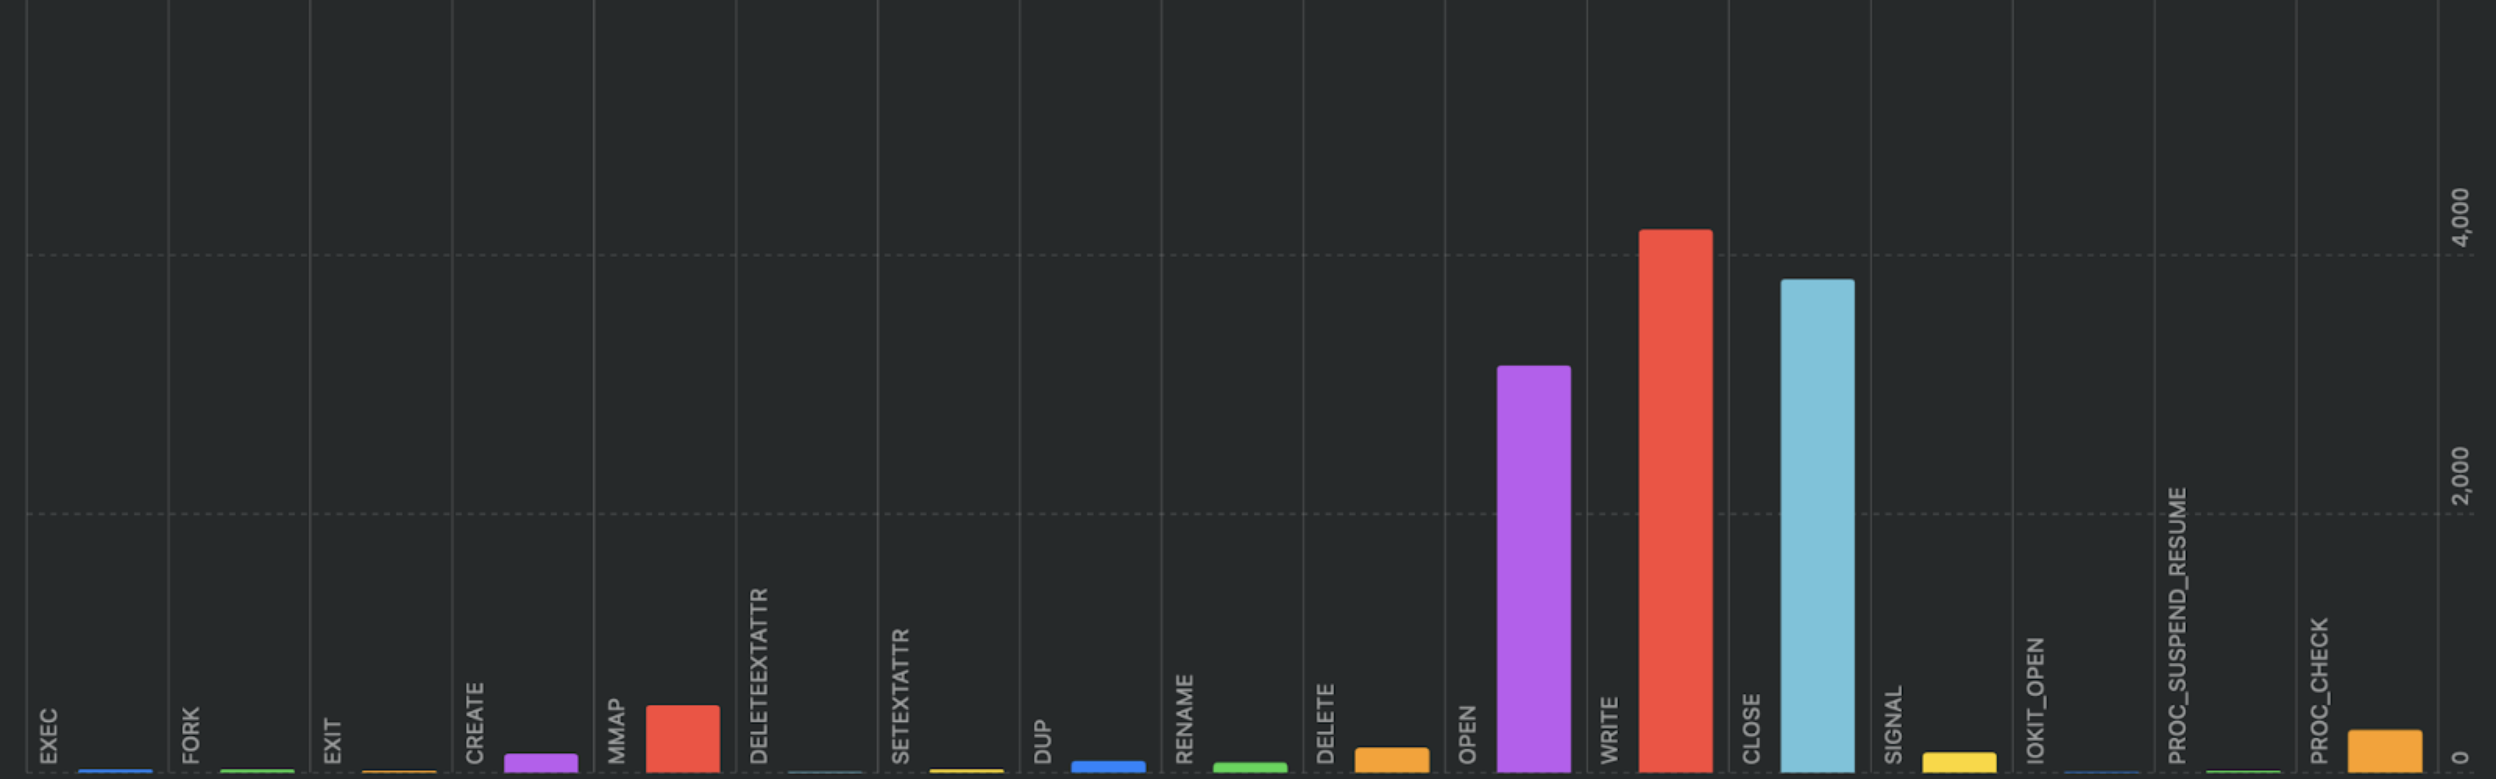

  • Event distribution chart: spot noisy events at a glance. Show or hide it with the chart button in the toolbar.

Event distribution chart

도구 다운로드

인기

모두 보기 →

커뮤니티에서 가장 많이 사용되는 도구를 찾아보세요.

아직 인기 데이터가 없습니다.

모든 도구 탐색

도구 컬렉션을 둘러보세요

모든 도구 보기 →