 1ultimat3/pcapviz
pcap 파일을 기반으로 네트워크 토폴로지를 시각화하고 그래프 통계를 수집합니다.

PcapViz는 네트워크 장치의 패킷 정보를 사용하여 네트워크를 장치 토폴로지 및 정보 흐름으로 그립니다. (tcpcap 또는 다른 캡처 소프트웨어로 캡처한 pcap 파일에서). 필터링하고 선택적으로 3개의 "계층" 중 하나에서 캡처된 패킷을 표시합니다. 이 계층은:
각 계층은 동일한 네트워크 패킷 집합에서 별개의 네트워크 그래프를 생성합니다. 이 분리를 통해 다른 시각화 패키지처럼 혼합하지 않고 각 수준에서 데이터 흐름을 훨씬 쉽게 볼 수 있습니다. 주요 토폴로지 노드를 결정하거나 데이터 유출 시도 패턴을 더 쉽게 발견할 수 있습니다.
usage: main.py [-h] [-i [PCAPS [PCAPS ...]]] [-o OUT] [-g GRAPHVIZ] [--layer2]
               [--layer3] [--layer4] [-fi] [-fo] [-G GEOPATH] [-l GEOLANG]
               [-E LAYOUTENGINE] [-s SHAPE]

pcap topology and message mapper

optional arguments:
  -h, --help            show this help message and exit
  -i [PCAPS [PCAPS ...]], --pcaps [PCAPS [PCAPS ...]]
                        space delimited list of capture files to be analyzed
  -o OUT, --out OUT     topology will be stored in the specified file
  -g GRAPHVIZ, --graphviz GRAPHVIZ
                        graph will be exported to the specified file (dot
                        format)
  --layer2              device topology network graph
  --layer3              ip message graph. Default
  --layer4              tcp/udp message graph
  -fi, --frequent-in    print frequently contacted nodes to stdout
  -fo, --frequent-out   print frequent source nodes to stdout
  -G GEOPATH, --geopath GEOPATH
                        path to maxmind geodb data
  -l GEOLANG, --geolang GEOLANG
                        Language to use for geoIP names
  -E LAYOUTENGINE, --layoutengine LAYOUTENGINE
                        Graph layout method - dot, sfdp etc.
  -s SHAPE, --shape SHAPE
                        Graphviz node shape - circle, diamond, box etc.
통신 그래프 그리기(계층 2), 세그먼트
python main.py -i tests/test.pcap -o test2.png --layer2

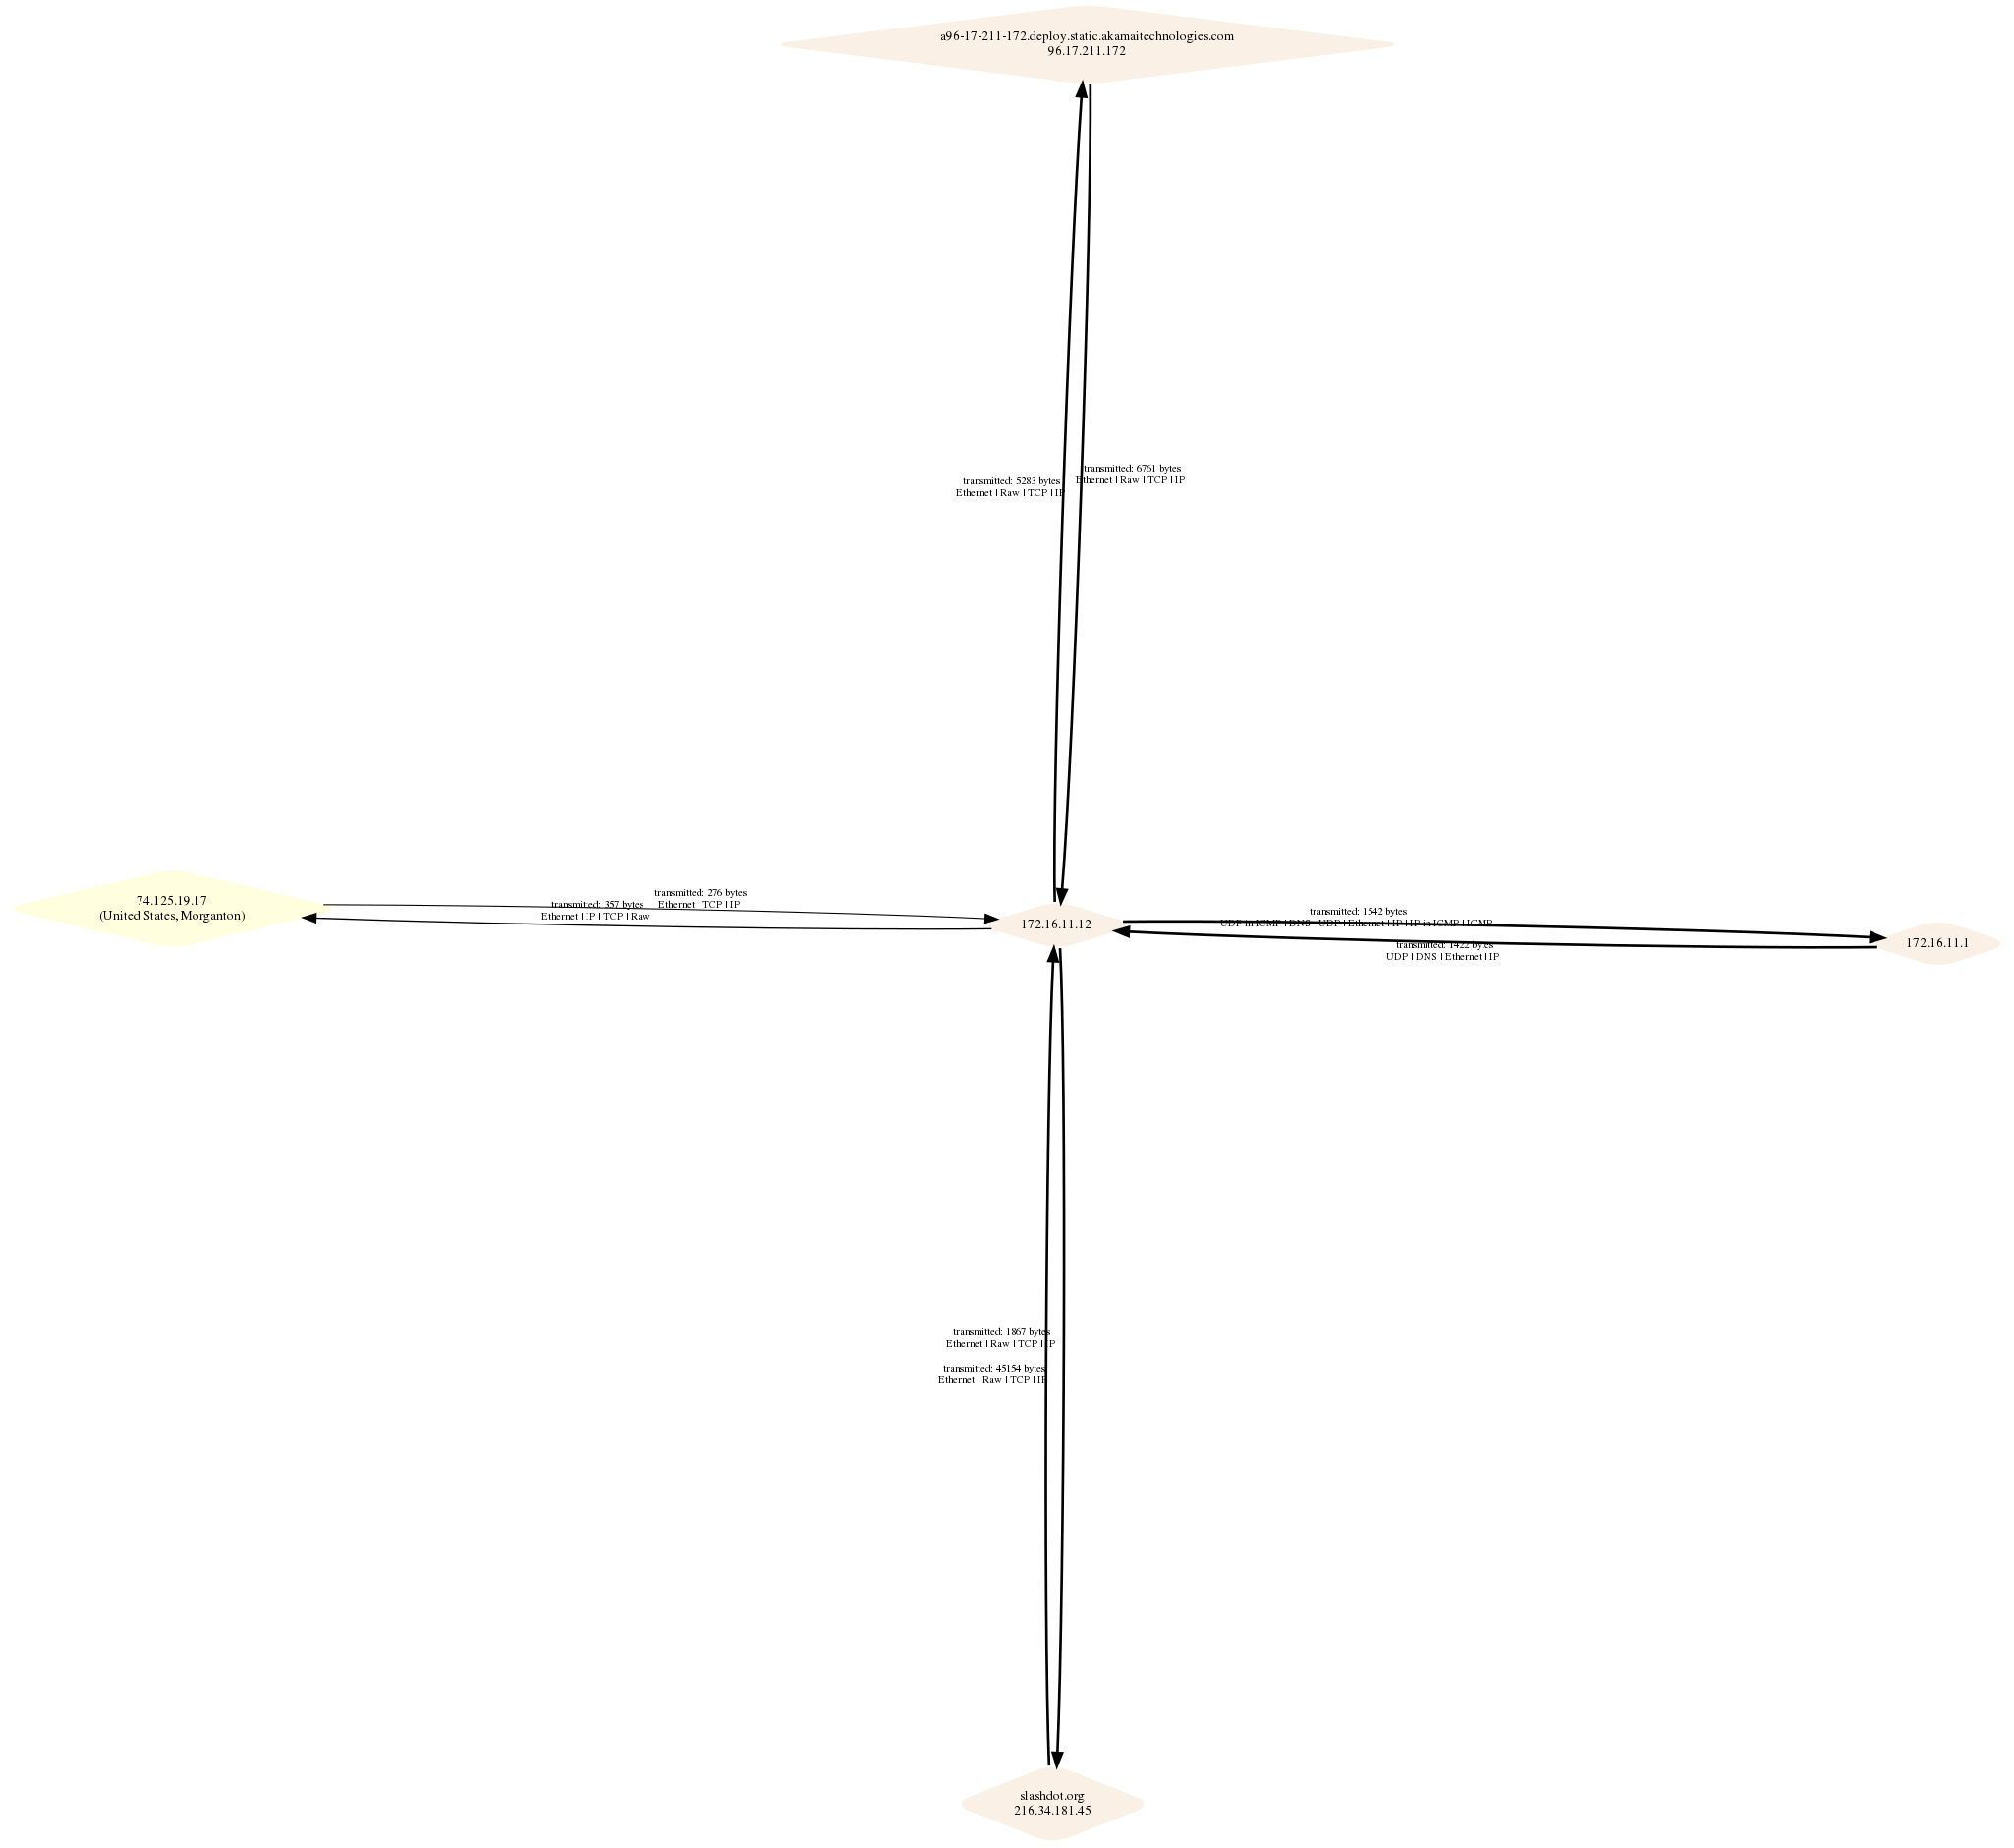
기본 sfdp 레이아웃의 계층 3
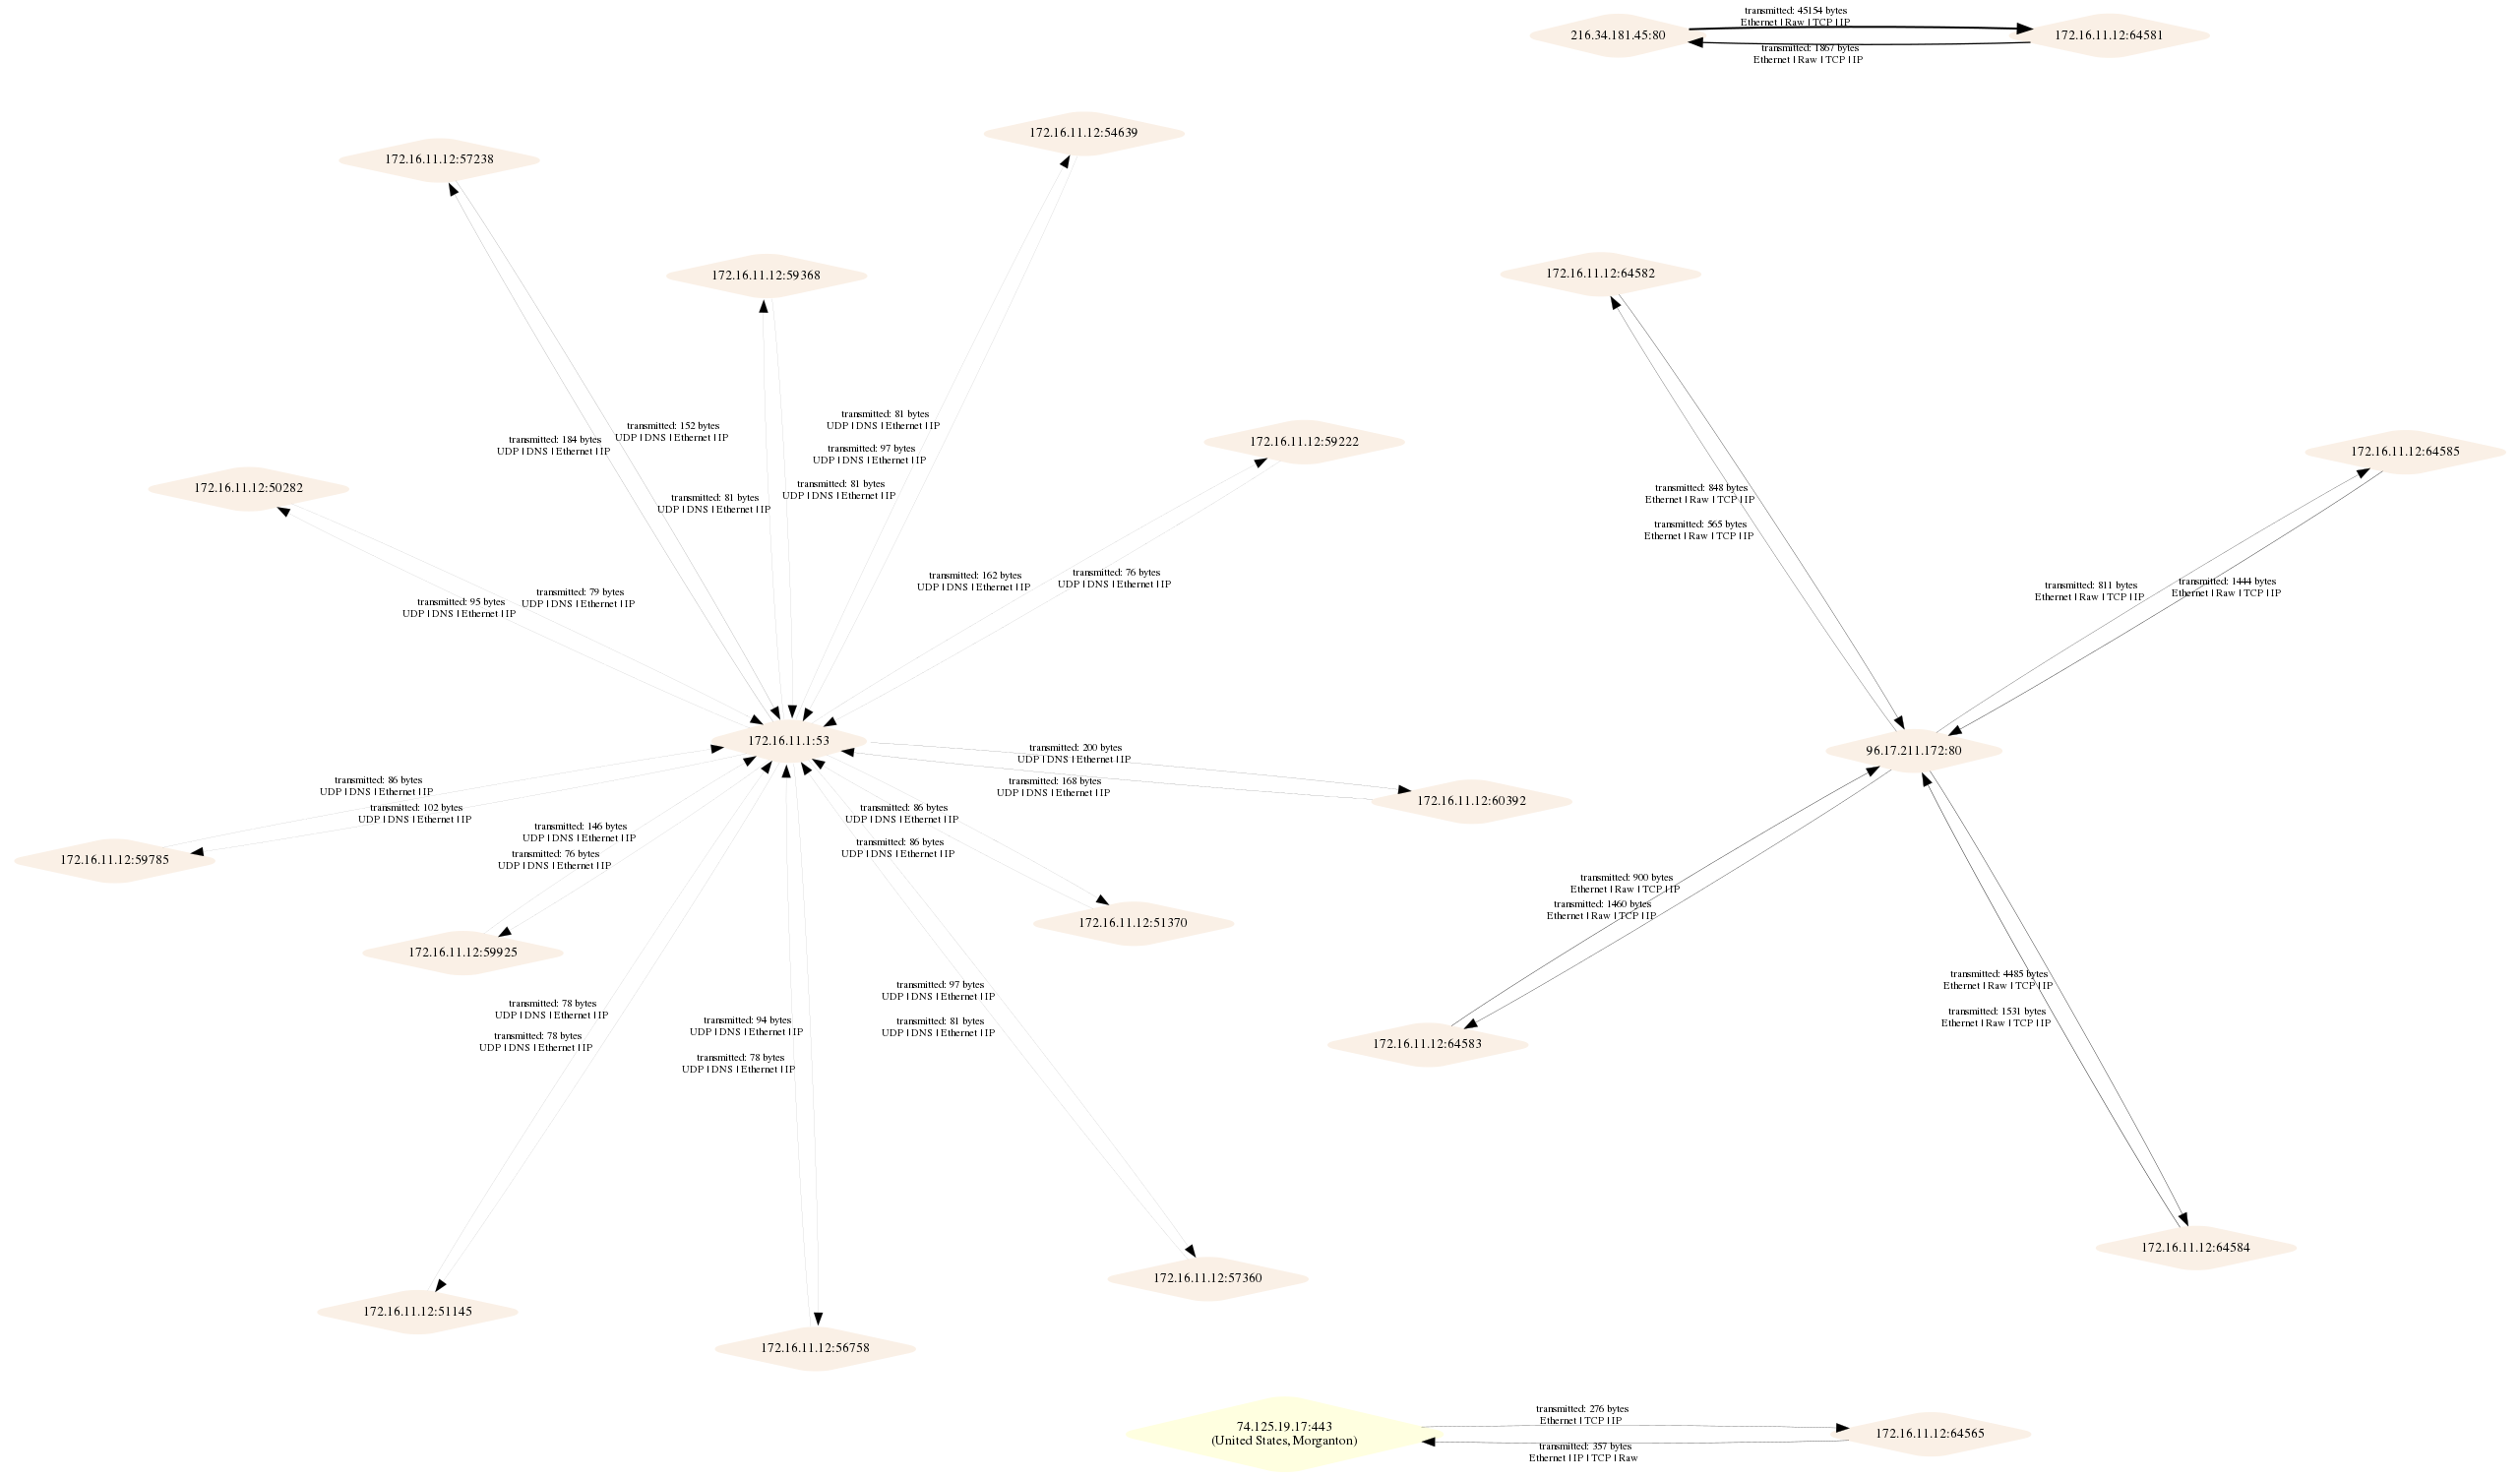
기본 sfdp 레이아웃의 계층 4
들어오는 패킷 수가 가장 많은 호스트 반환:
python3 main.py -i tests/test.pcap -fi --layer3
4 172.16.11.12
1 74.125.19.17
1 216.34.181.45 slashdot.org
1 172.16.11.1
1 96.17.211.172 a96-17-211-172.deploy.static.akamaitechnologies.com
필수:
GraphViz 아래 시스템 노트 참조
Pip 패키지 요구사항 Maxmind Python API 및 기타 종속성은 다음 명령을 실행할 때 설치됩니다:
pip3 install -r requirements.txt
그러니 당연히 실행하세요! 파이썬 가상 환경을 사용하고 계시죠? (농담입니다)
데비안 기반 배포판의 경우 GraphViz와 추가 종속성을 설치해야 합니다:
apt-get install python3-dev
apt-get install graphviz libgraphviz-dev pkg-config
Scapy는 OSX에서 바로 작동하지 않습니다. scapy 웹사이트의 플랫폼별 지침을 따르세요.
brew install graphviz
brew install --with-python libdnet
brew install https://raw.githubusercontent.com/secdev/scapy/master/.travis/pylibpcap.rb
단위 테스트는 tests 디렉토리에서 실행할 수 있습니다:
python3 core.py
위의 샘플 이미지는 테스트 출력 그래프입니다.
현재 graphviz의 사용 중단 경고가 2개 있으며, 테스트가 작동하려면 가짜 인수를 수정하여 사용자의 geoIP 데이터 파일 복사본을 가리켜야 할 수 있습니다. geoIP 데이터에 접근할 수 없으면 두 테스트는 항상 실패합니다.
