 aman-sharma-dev/netsentryx
Npcapによるライブパケットキャプチャ、低遅延トラフィック分析、PyTorchオートエンコーダを用いた教師なし脅威検出を実行し、非同期マルチチャネルアラートエンジンを備えたイベント駆動型ネットワーク監視プラットフォーム。

AI駆動、高性能リアルタイムネットワーク可観測性 & 脅威検知エンジン




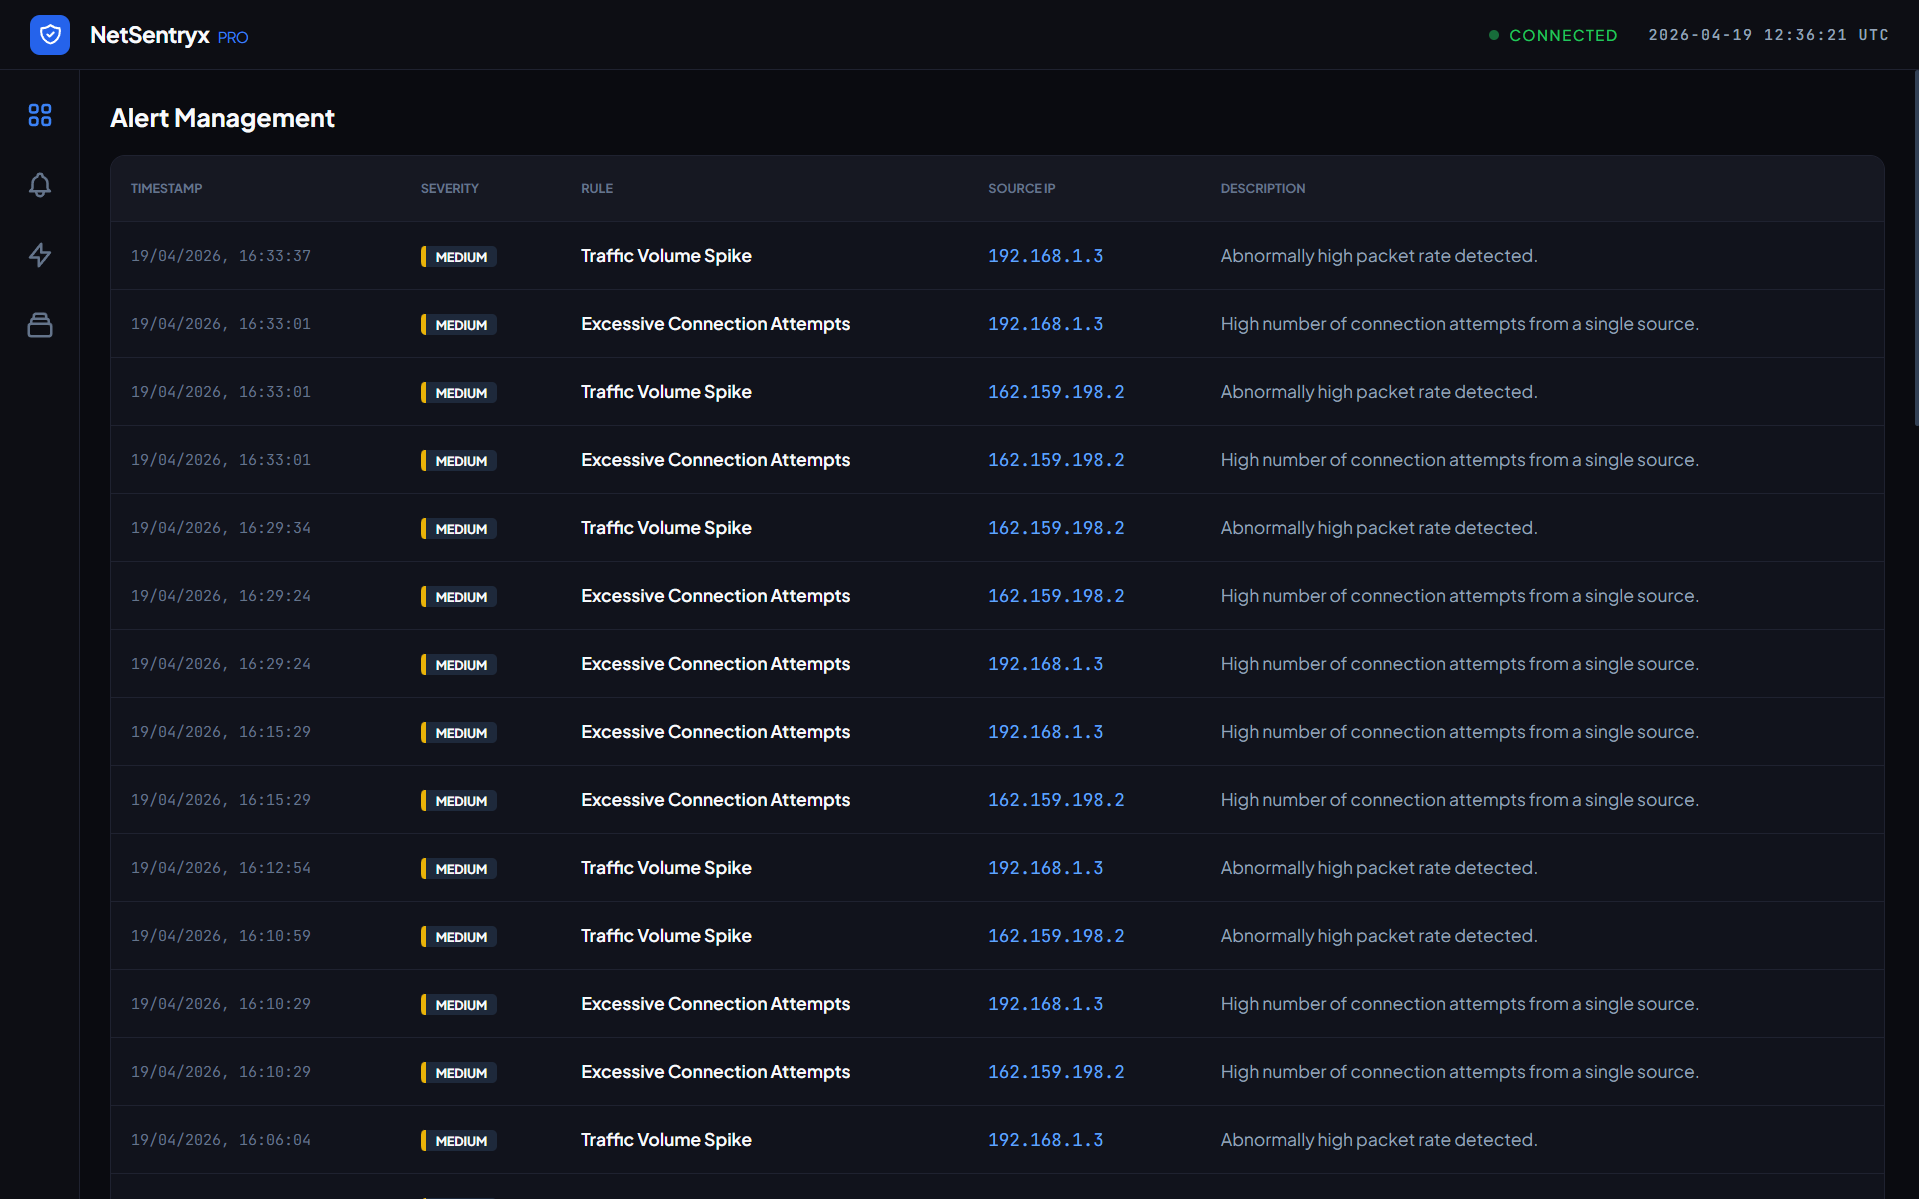
NetSentryx PROは、次世代のイベント駆動型ネットワーク監視および脅威インテリジェンスプラットフォームです。ルールベースのシグネチャとPyTorchディープオートエンコーダを組み合わせることで、10ms未満のパケットおよびネットフロー異常検知、自動マルチチャネルアラート(Slack、Discord、Email)、そしてインタラクティブなリアルタイムSOCダッシュボードを提供します。
以下のフロー図は、データ取り込み、リアルタイムディープラーニング推論、アラートパイプライン、およびWebSocket可視化レイヤーを示しています:
flowchart TD
    subgraph Capture & Ingestion
        A[Network Interface / Packet Simulator] -->|Raw Traffic Events| B(Lightweight Event Bus)
        B -->|Packet Stream| C[Flow Aggregation Engine]
    end

    subgraph Deep Learning Inference
        C -->|Aggregated Telemetry Vectors| D[PyTorch TrafficAutoencoder]
        D -->|MSE Reconstruction Loss| E{Threshold Evaluation}
    end

    subgraph Alert Dispatch
        E -->|No Anomaly| F[Status: Optimal]
        E -->|Anomaly Detected| G[FastAPI BackgroundTasks]
        G -->|Save Event| H[(SQLite Datastore)]
        G -->|Broadcast WebSocket| I[HTML Live Dashboard]
        G -->|Dispatch Webhooks| J[Slack / Discord / Custom Webhook]
        G -->|Dispatch SMTP| K[Email Alerting]
    end

    style D fill:#EE4C2C,stroke:#fff,stroke-width:2px,color:#fff
    style I fill:#005571,stroke:#fff,stroke-width:2px,color:#fff
    style G fill:#00bf8f,stroke:#fff,stroke-width:2px,color:#fff
TrafficAutoencoder)を活用し、多変量特徴量の再構成誤差に基づいて、高度なゼロデイエクスプロイト、スキャン、またはDDoS攻撃を検知します。Mean + 3 * Std)を備えており、すぐに完全に機能します。BackgroundTasksを使用して、詳細な侵入アラートをSlack webhooks、Discord webhooks、カスタムHTTP API、およびSMTPメールに非同期でプッシュします。NetSentryx/
├── config/
│ ├── config.yaml # System, dashboard, and alerting channel configurations
│ └── rules.yaml # Threat detection thresholds and rule properties
├── src/
│ ├── alerts/
│ │ ├── ml_detection.py # PyTorch TrafficAutoencoder & feature scaling
│ │ ├── manager.py # Async alert dispatcher (Discord, Slack, Email)
│ │ └── detection.py # Rule-based packet signature detection engine
│ ├── core/
│ │ ├── config_loader.py # Configuration loader utilities
│ │ ├── logger.py # Database-integrated system logger
│ │ └── time_utils.py # Timezone-aware timestamp utilities
│ ├── dashboard/
│ │ ├── templates/
│ │ │ └── index.html # Live HTML5 Dashboard template
│ │ └── server.py # FastAPI API Router and WebSocket broadcast controller
│ ├── database/
│ │ ├── manager.py # SQLite connection & database actions
│ │ └── models.py # SQLAlchemy schema definitions (Alerts, Logs, Flows)
│ ├── flows/
│ │ ├── capture.py # Scapy packet sniffer thread
│ │ └── processor.py # Flow aggregation and metric extractor
│ └── main.py # Application entrypoint
└── main.py # Root script runner
**Python 3.10+**がインストールされていることを確認してください。ライブネットワークインターフェースをキャプチャする場合:
sudo apt-get install libpcap-devでlibpcap-devをインストールします。リポジトリをクローンし、依存関係をインストールします(より高速なインストールのためにuvの使用を強く推奨します):
# Clone the repository
git clone https://github.com/yourusername/netsentryx.git
cd netsentryx

# Create virtual environment
python -m venv .venv
source .venv/bin/activate  # On Windows: .venv\Scripts\activate

# Install requirements
pip install -r requirements.txt
.env)プロジェクトルートに.envファイルを作成し、通知認証情報を設定します:
# Discord Configuration
DISCORD_ENABLED=true
DISCORD_WEBHOOK_URL="https://discord.com/api/webhooks/your-webhook-id/your-webhook-token"

# Slack Configuration
SLACK_ENABLED=true
SLACK_WEBHOOK_URL="https://hooks.slack.com/services/YOUR_WORKSPACE_ID/YOUR_CHANNEL_ID/YOUR_SECRET_TOKEN"

# SMTP Email Configuration
SMTP_ENABLED=true
SMTP_SERVER="smtp.gmail.com"
SMTP_PORT=587
SMTP_USERNAME="[email protected]"
SMTP_PASSWORD="your-app-password"
SMTP_FROM_EMAIL="[email protected]"
SMTP_TO_EMAIL="[email protected]"
python main.py --simulate
python main.py
ブラウザを開き、http://localhost:8000にアクセスしてライブダッシュボードを表示します。
/api/v1/telemetry/analyzePOSTapplication/json{
"packet_count": 550,
"byte_count": 850000,
"flow_duration": 4.5,
"syn_flag_ratio": 0.85,
"port_entropy": 3.2,
"byte_rate": 188888.8,
"source_ip": "192.168.1.120",
"dest_ip": "10.0.0.5",
"protocol": "TCP"
}
{
  "status": "NORMAL",
  "threat_level": "low",
  "anomaly_score": 0.3083,
  "threshold": 2.1319
}
{
  "status": "ANOMALOUS",
  "threat_level": "critical",
  "anomaly_score": 117999.03,
  "threshold": 2.1319,
  "alert": {
    "id": 12,
    "timestamp": "2026-08-05T14:13:31.373Z",
    "rule_id": "ml_autoencoder_anomaly",
    "rule_name": "ML Autoencoder Anomaly",
    "source_ip": "192.168.1.120",
    "severity": "critical",
    "description": "Deep autoencoder reconstruction error exceeded anomaly threshold (score: 117999.0300, threshold: 2.1320).",
    "metrics": { ... }
  }
}
| Endpoint | Method | Description | Sample Response |
|---|---|---|---|
/api/alerts | GET | Fetches recent threat alerts saved in DB | [{"id": 1, "rule_name": "Port Scanning", ...}] |
/api/flows | GET | Fetches recent network flow telemetry logs | [{"source_ip": "192.168.1.10", "packet_count": 45, ...}] |
/api/logs | GET | Fetches backend system audit logs | [{"level": "INFO", "message": "ML engine trained...", ...}] |
このプロジェクトはMITライセンスの下でライセンスされています - 詳細はLICENSEファイルを参照してください。

