 mwemuorg/mwemu
Emulatore hardware x86 e simulatore di processi Windows in Pure Rust per l'analisi di malware, emulazione di shellcode e unpacking di payload. Supporta eseguibili PE a 32/64 bit, Metasploit, Cobalt Strike e famiglie di malware complesse.









È un emulatore hardware + simulatore di processi OS implementato in puro rust.
Questo approccio è molto comodo per l'analisi di malware e altre cose (PE, shellcode ecc.)
L'OS è principalmente windows, emula un processo windows, con un supporto molto basilare per linux.
L'hardware è x86 32/64bit, è veloce e affidabile.

Il progetto è stato rinominato da scemu a mwemu.
r2con2025 utilizza radare2 da mwemu per fare analisi statica e visualizzazione all'interno di un momento di emulazione.
📦 sicurezza di rust, ottimo per emulare malware.
⚡ emulazione molto veloce
basato su iced-x86, un'ottima libreria disassembler rust.
strumento da riga di comando, libreria rust e libreria python.
rilevatore di iterazioni.
tracciamento di memoria e registri.
colorato.
fermarsi in un momento specifico ed esplorare lo stato o modificarlo.
339 istruzioni CPU implementate.
260 winapi a 32bit implementate di 15 dll.
204 winapi a 64bit implementate di 10 dll.
tutte le syscall linux.
catene SEH.
vectored exception handler.
strutture PEB, TEB.
linking dinamico.
binding IAT.
delay loading.
allocatore di memoria.
reagire con int3.
cpuid non debugged.
emulazione di shellcode a 32bit e 64bit.
emulazione di eseguibili pe32 e pe64.
emulazione completa con payload noti:
emulazione parziale con funzioni malware complesse:
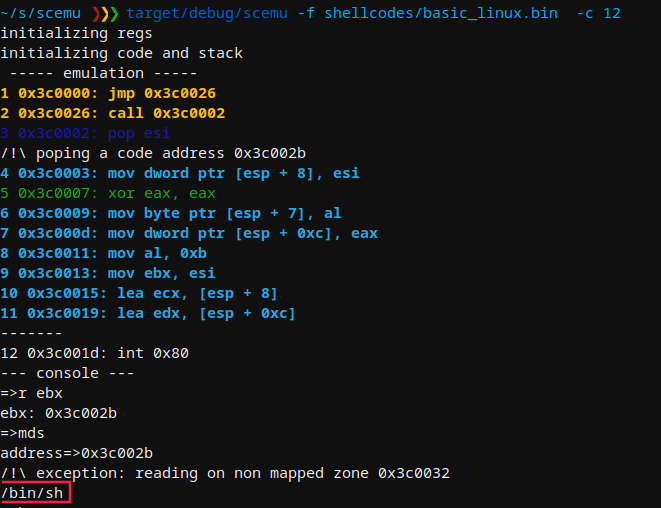
Durante l'emulazione puoi vedere il numero di istruzioni cpu emulate, che è un ID univoco per un momento di emulazione.
Con il flag -c fermi l'emulazione in un momento specifico e ispezioni cosa sta succedendo con la console.
MWEMU emulator for malware 0.7.11
@sha0coder

USAGE:
    mwemu [FLAGS] [OPTIONS]

FLAGS:
    -6, --64bits         enable 64bits architecture emulation
        --banzai         skip unimplemented instructions, and keep up emulating what can be emulated
        --flags          trace the flags hex value in every instruction.
    -F, --fpu            trace the fpu states.
    -h, --handle         handle Ctrl+C to spawn console
        --help           Prints help information
    -l, --loops          show loop interations, it is slow.
    -m, --memory         trace all the memory accesses read and write.
    -n, --nocolors       print without colors for redirectin to a file >out
    -r, --regs           print the register values in every step.
    -p, --stack_trace    trace stack on push/pop
    -t, --test           test mode
        --version        Prints version information
    -v, --verbose        -vv for view the assembly, -v only messages, without verbose only see the api calls and goes
                         faster

OPTIONS:
    -A, --args <ARGS>                  provide arguments to the EXE like: --args '"aa" "bb"'
        --cmd <COMMAND>                launch a console command
    -b, --base <ADDRESS>               set base address for code
    -c, --console <NUMBER>             select in which moment will spawn the console to inspect.
    -C, --console_addr <ADDRESS>       spawn console on first eip = address
    -d, --dump <FILE>                  load from dump.
    -a, --entry <ADDRESS>              entry point of the shellcode, by default starts from the beginning.
    -e, --exit <POSITION>              exit position of the shellcode
    -f, --filename <FILE>              set the shellcode binary file.
    -i, --inspect <DIRECTION>          monitor memory like: -i 'dword ptr [ebp + 0x24]
        --iso <ISO>                    extract genuine system32 DLLs from a Windows ISO and use them as the maps folder, e.g. --iso ~/Downloads/win11.iso
    -L, --log <LOG_FILENAME>           log output to file
    -M, --maps <PATH>                  select the memory maps folder
        --mxcsr <MXCSR>                set mxcsr register
        --r10 <R10>                    set r10 register
        --r11 <R11>                    set r11 register
        --r12 <R12>                    set r12 register
        --r13 <R13>                    set r13 register
        --r14 <R14>                    set r14 register
        --r15 <R15>                    set r15 register
        --r8 <R8>                      set r8 register
        --r9 <R9>                      set r9 register
        --rax <RAX>                    set rax register
        --rbp <RBP>                    set rbp register
        --rbx <RBX>                    set rbx register
        --rcx <RCX>                    set rcx register
        --rdi <RDI>                    set rdi register
        --rdx <RDX>                    set rdx register
    -R, --reg <REGISTER1,REGISTER2>    trace a specific register in every step, value and content
        --rflags <RFLAGS>              set rflags register
        --rsi <RSI>                    set rsi register
        --rsp <RSP>                    set rsp register
    -x, --script <SCRIPT>              launch an emulation script, see scripts_examples folder
        --stack_address <ADDRESS>      set stack address
    -s, --string <ADDRESS>             monitor string on a specific address
    -T, --trace <TRACE_FILENAME>       output trace to specified file
    -S, --trace_start <TRACE_START>    start trace at specified position
    -V, --verbose_at <NUMBER>          start displaying assembly at specific position (is like -vv enabled in specific
                                       moment)
