 k2/ehtrace
ATrace è uno strumento per tracciare l'esecuzione di binari su Windows.

EhTrace (pronunciato "ATrace") è un framework di tracciamento e instrumentazione binaria ad alte prestazioni per Windows. Consente un'analisi approfondita dell'esecuzione runtime degli eseguibili Windows senza richiedere codice sorgente, modifiche binarie o debugging tradizionale.
EhTrace sfrutta la gestione delle eccezioni vettoriali di Windows (VEH) e tecniche di "block-stepping" per fornire un tracciamento completo dell'esecuzione con un overhead minimo. A differenza degli strumenti tradizionali di debugging o instrumentazione, EhTrace opera interamente in-process e non richiede patch ai binari target.
flowchart TB
    subgraph Target["🎯 Processo target"]
        direction TB
        APP[Codice applicazione]
        VEH[Gestore eccezioni vettoriali]
        style APP fill:#e1f5ff,stroke:#01579b,stroke-width:3px,color:#000
        style VEH fill:#fff3e0,stroke:#e65100,stroke-width:3px,color:#000
    end

    subgraph EhTrace["⚡ Motore EhTrace"]
        direction TB
        BLOCK[Block Stepper]
        DISASM[Disassemblatore Capstone]
        FIGHTERS[BlockFighters]
        CTX[Gestore contesto]
        style BLOCK fill:#f3e5f5,stroke:#4a148c,stroke-width:3px,color:#000
        style DISASM fill:#e8f5e9,stroke:#1b5e20,stroke-width:3px,color:#000
        style FIGHTERS fill:#ffebee,stroke:#b71c1c,stroke-width:3px,color:#000
        style CTX fill:#e0f2f1,stroke:#004d40,stroke-width:3px,color:#000
    end

    subgraph Output["📊 Output di analisi"]
        direction TB
        SHMEM[Log memoria condivisa]
        GRAPHS[Grafici visivi]
        REPORTS[Report di copertura]
        style SHMEM fill:#fce4ec,stroke:#880e4f,stroke-width:3px,color:#000
        style GRAPHS fill:#f1f8e9,stroke:#33691e,stroke-width:3px,color:#000
        style REPORTS fill:#fff8e1,stroke:#f57f17,stroke-width:3px,color:#000
    end

    APP -->|Eccezione| VEH
    VEH -->|Single Step| BLOCK
    BLOCK -->|Istruzione| DISASM
    DISASM -->|Analisi| FIGHTERS
    FIGHTERS -->|Stato| CTX
    CTX -->|Eventi| SHMEM
    SHMEM -->|Dati| GRAPHS
    SHMEM -->|Dati| REPORTS

    style Target fill:#e3f2fd,stroke:#0d47a1,stroke-width:4px
    style EhTrace fill:#f3e5f5,stroke:#6a1b9a,stroke-width:4px
    style Output fill:#e8f5e9,stroke:#2e7d32,stroke-width:4px
EhTrace opera attraverso una pipeline sofisticata:
Il framework mantiene lo stato di esecuzione per thread utilizzando strutture di contesto specializzate e fornisce hook per un'instrumentazione personalizzabile.
graph LR
    subgraph Traditional["🐌 Debugger tradizionale"]
        T1[Single Step]
        T2[Cambio contesto]
        T3[Modalità kernel]
        T4[~1M eventi/sec]
        style T1 fill:#ffcdd2,stroke:#c62828,stroke-width:2px,color:#000
        style T2 fill:#ffcdd2,stroke:#c62828,stroke-width:2px,color:#000
        style T3 fill:#ffcdd2,stroke:#c62828,stroke-width:2px,color:#000
        style T4 fill:#ef5350,stroke:#b71c1c,stroke-width:3px,color:#fff
    end

    subgraph EhTrace["⚡ EhTrace"]
        E1[Block Step]
        E2[In-Process]
        E3[Modalità utente]
        E4[~43M eventi/sec]
        style E1 fill:#c8e6c9,stroke:#2e7d32,stroke-width:2px,color:#000
        style E2 fill:#c8e6c9,stroke:#2e7d32,stroke-width:2px,color:#000
        style E3 fill:#c8e6c9,stroke:#2e7d32,stroke-width:2px,color:#000
        style E4 fill:#66bb6a,stroke:#1b5e20,stroke-width:3px,color:#fff
    end

    T1 --> T2 --> T3 --> T4
    E1 --> E2 --> E3 --> E4

    style Traditional fill:#ffebee,stroke:#d32f2f,stroke-width:3px
    style EhTrace fill:#e8f5e9,stroke:#388e3c,stroke-width:3px
EhTrace raggiunge alte prestazioni grazie a diverse ottimizzazioni:
📊 Benchmark: 428.833.152 eventi (32 byte ciascuno) catturati in 10 secondi = ~43M eventi/sec
Demo CSW16 di tracing di notepad.exe senza simboli:
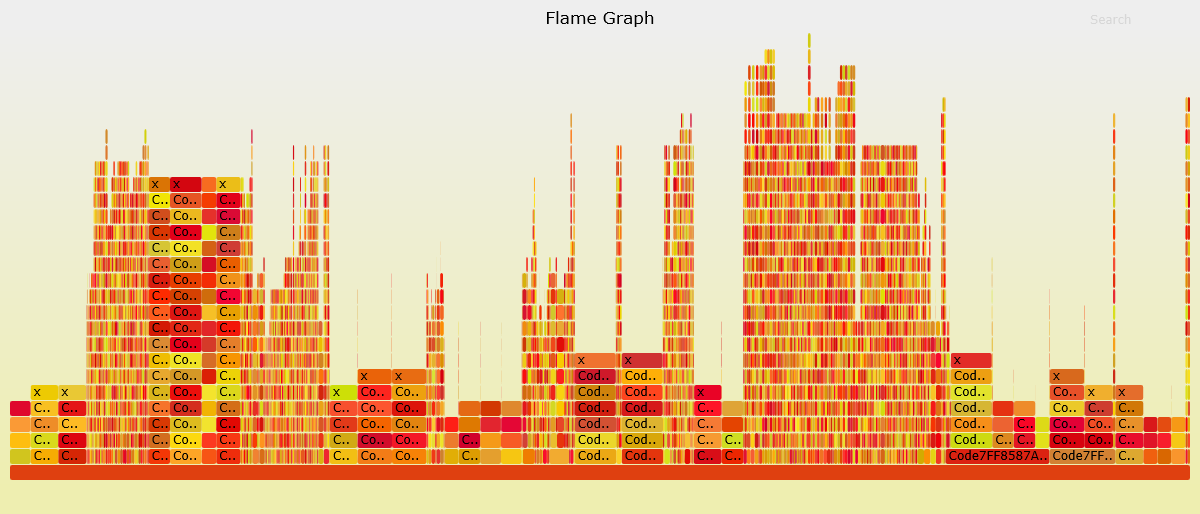
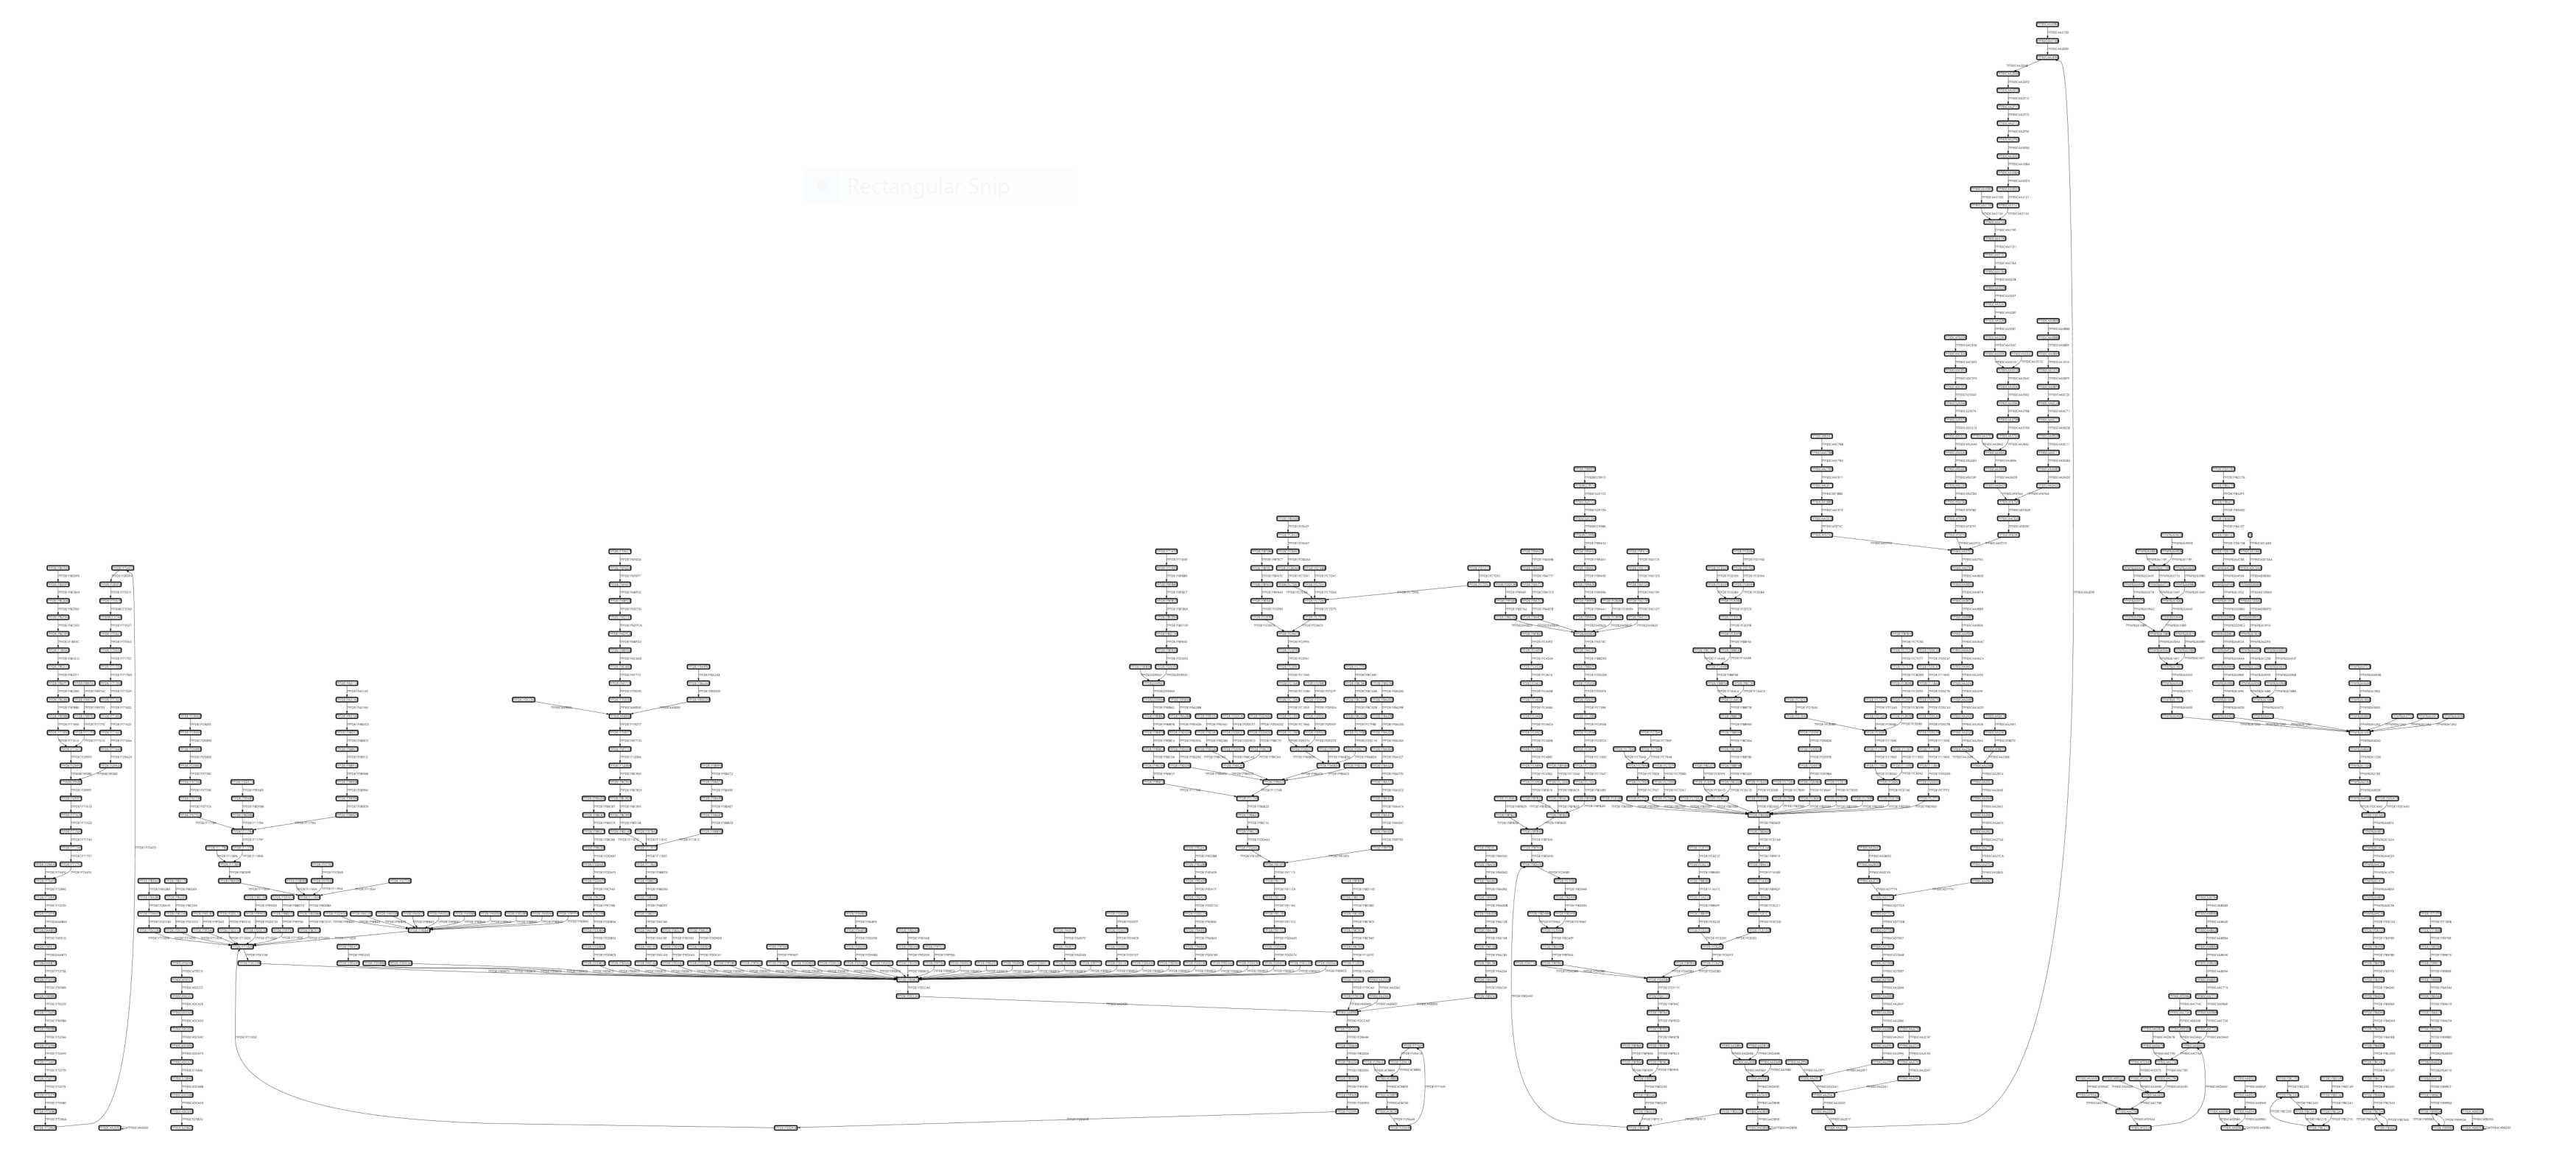
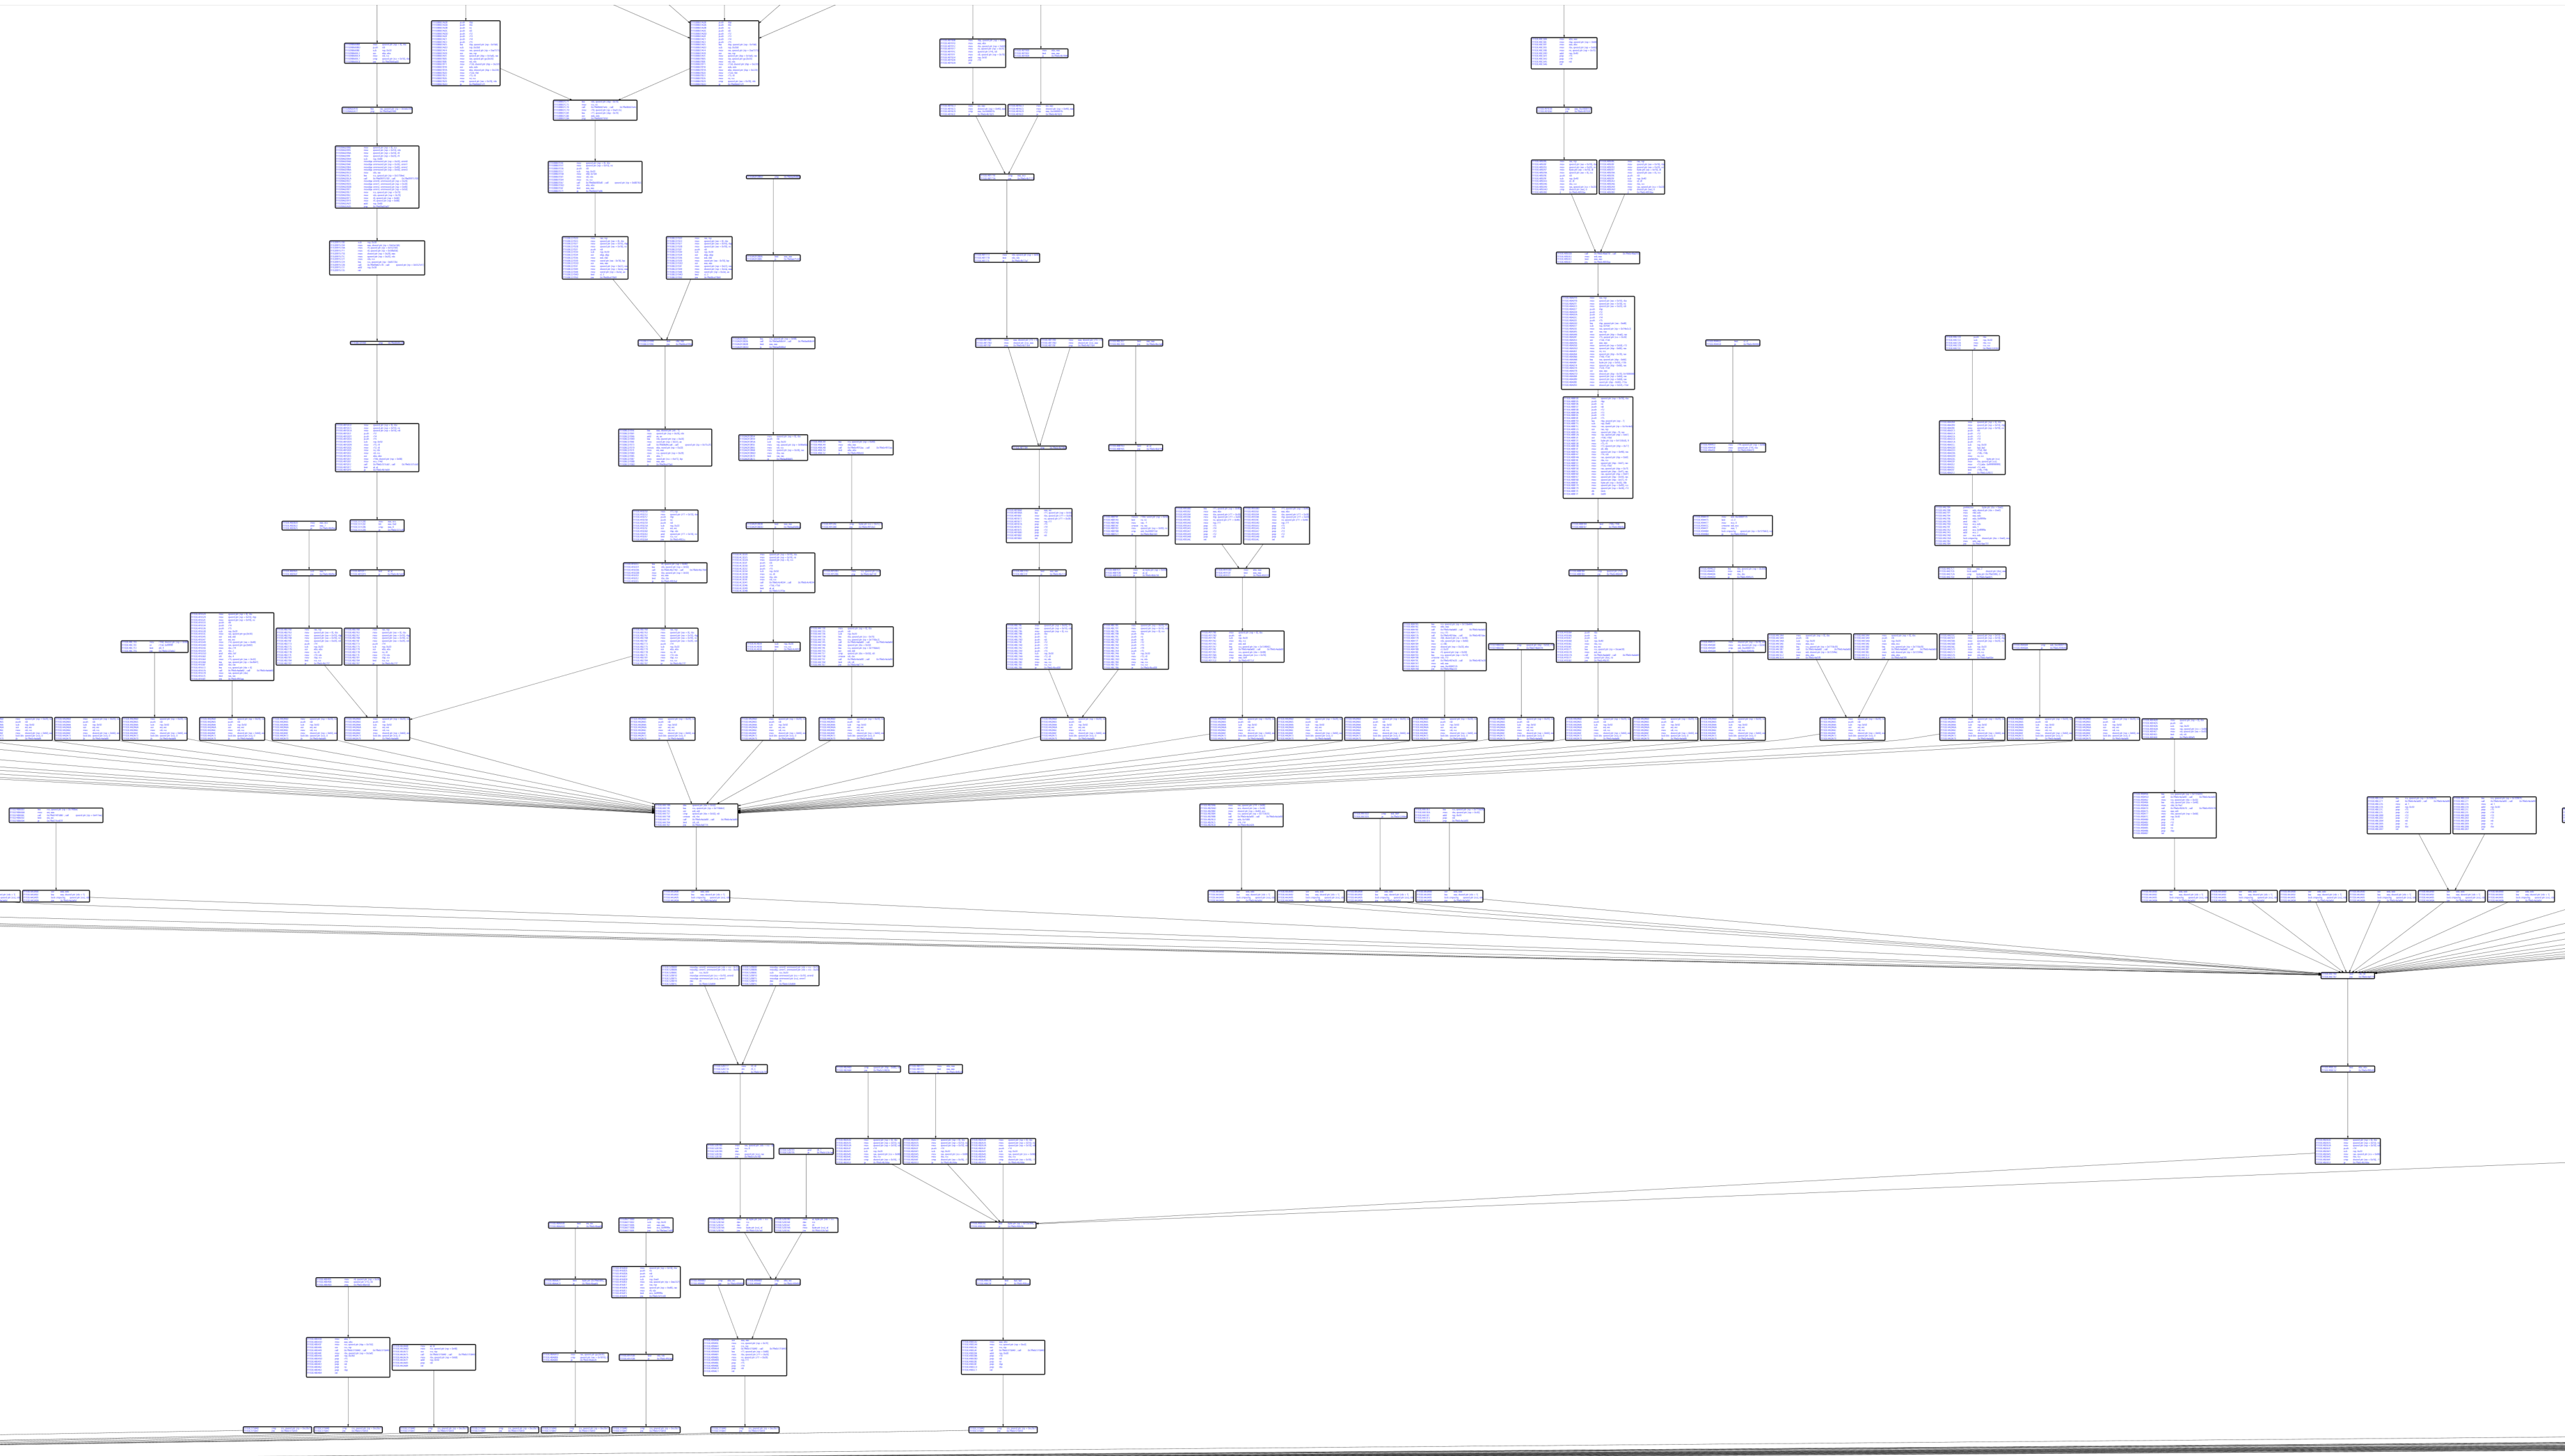
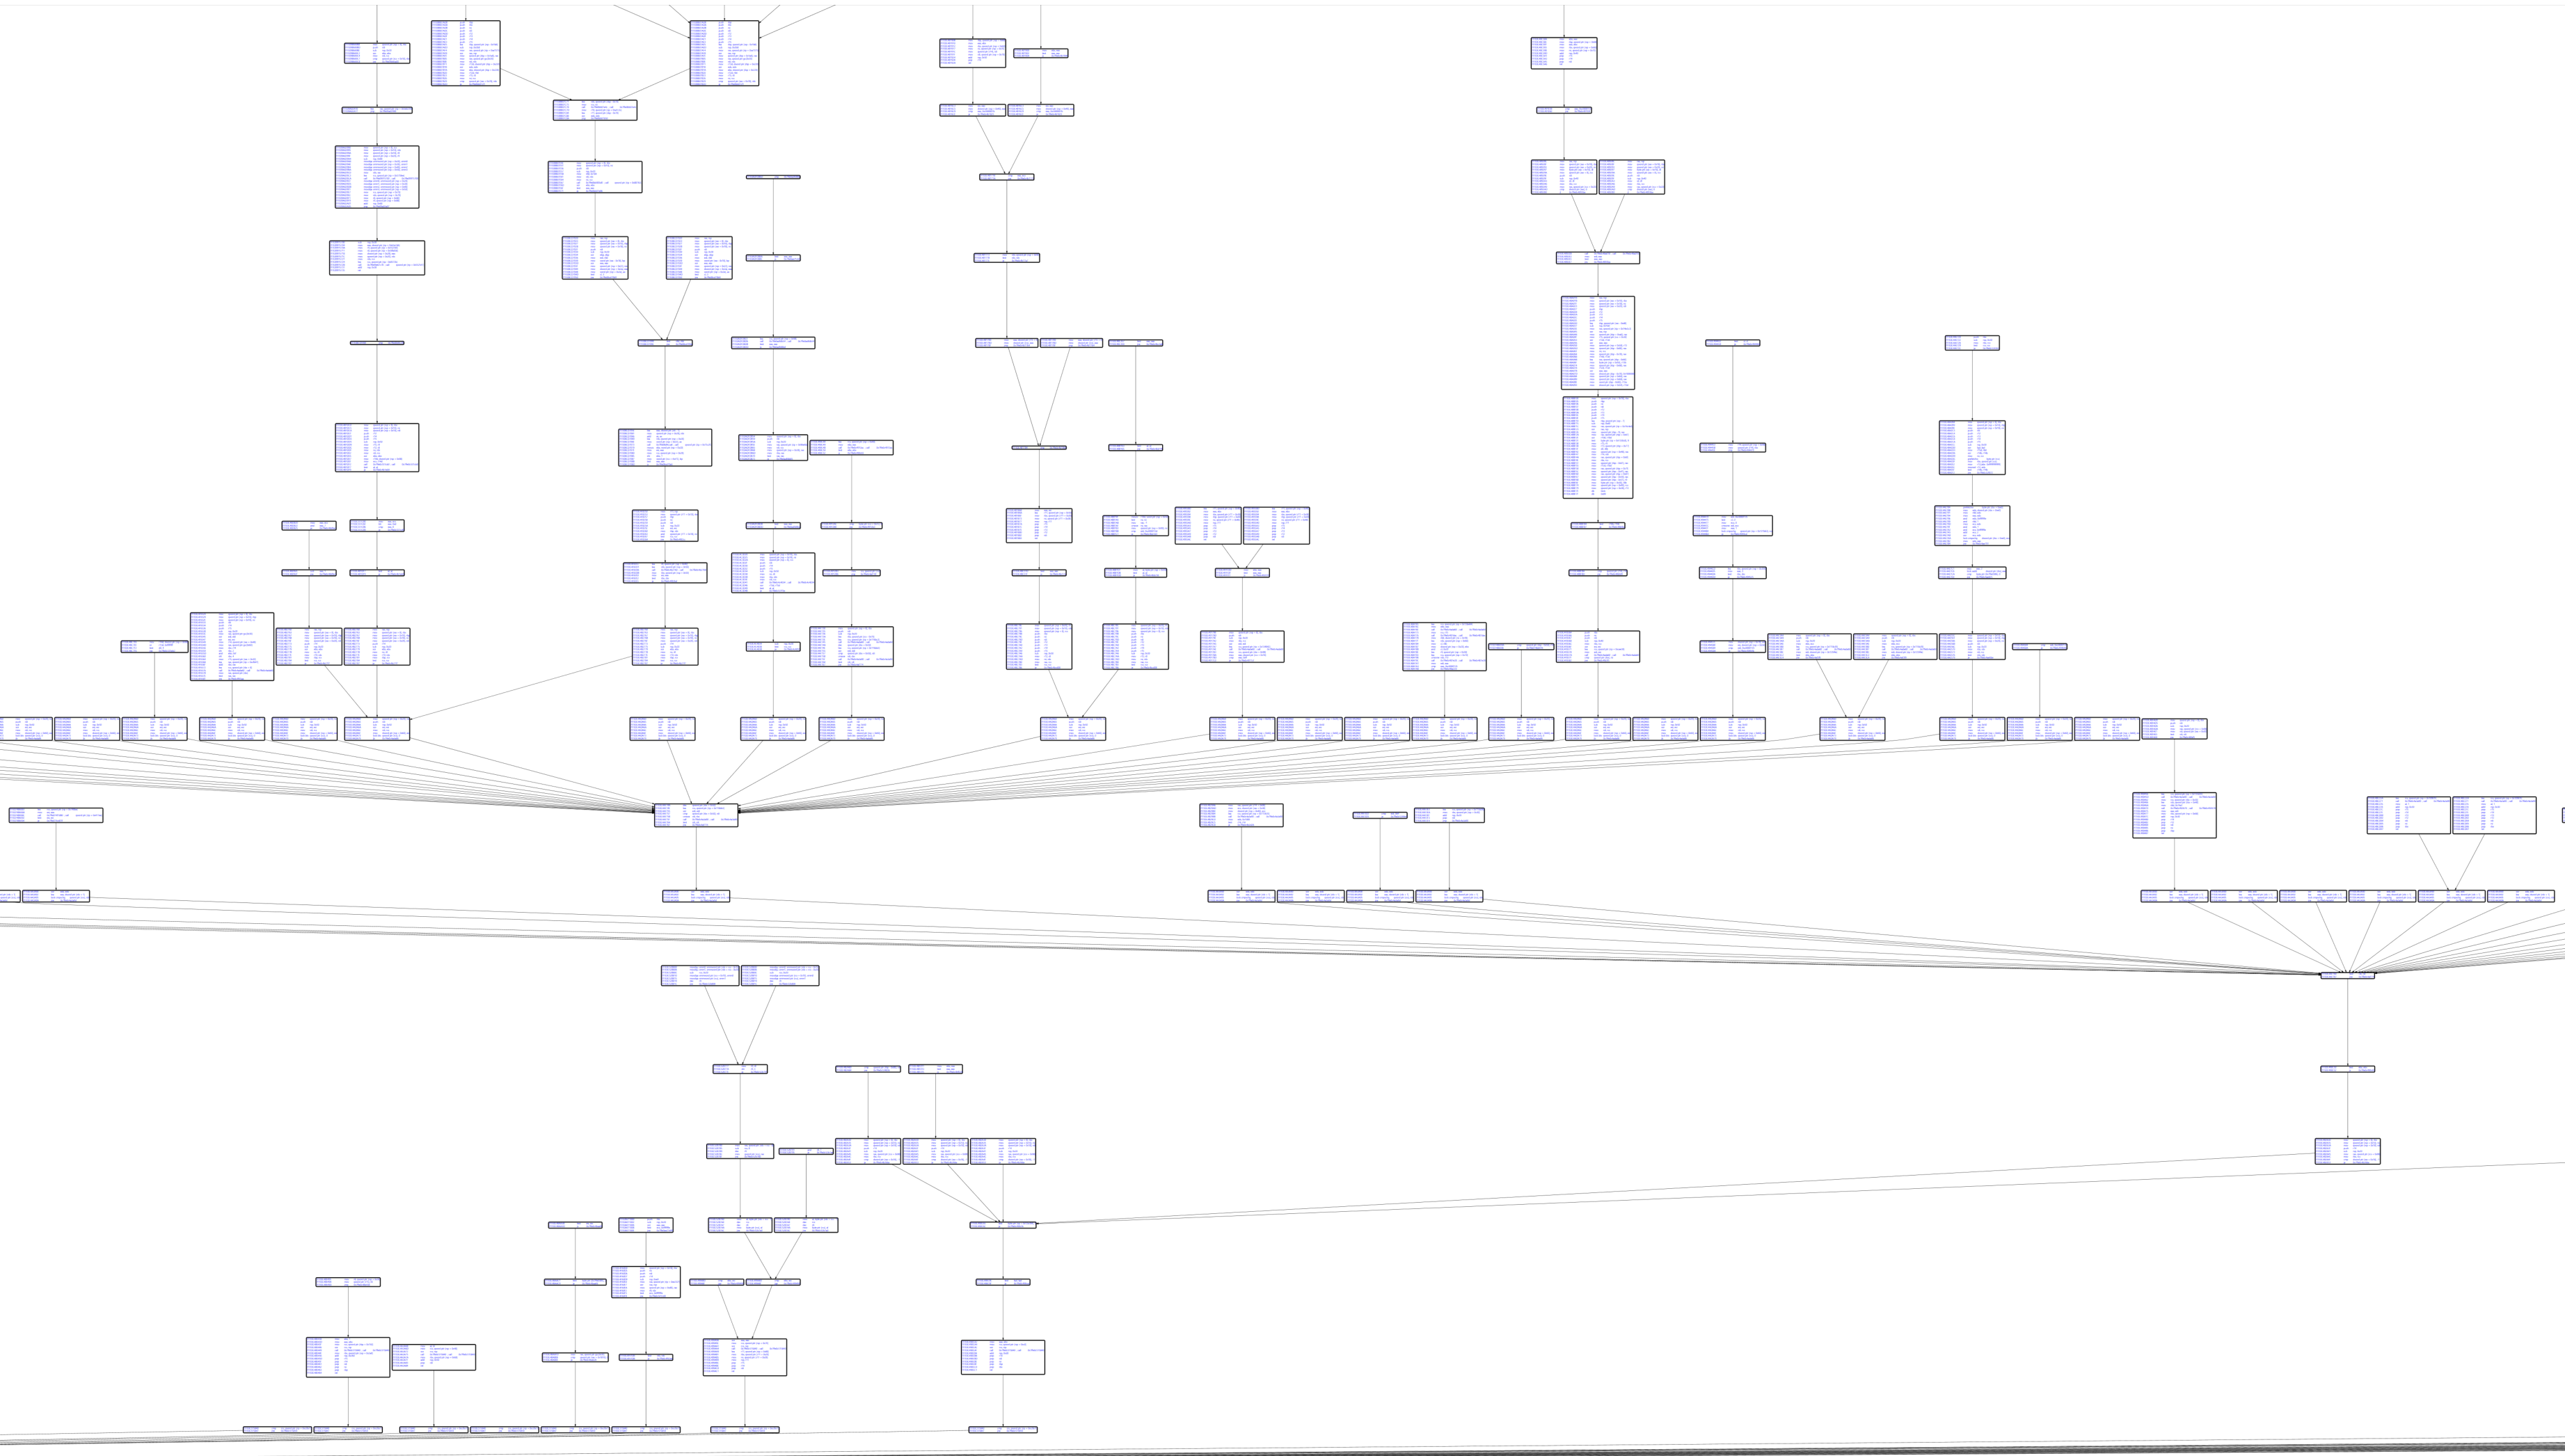
Grafico del blocco di base con disassemblaggio Capstone:
Visualizzazione della copertura del codice: