Skip to content
KitploitKITPLOIT
OutilsExploitsBlog
Log in
Soumettre
OutilsExploitsBlog
Soumettre

Outils de Hacking, PenTest et Cybersécurité pour votre Arsenal de Sécurité !

Kitploit est un répertoire d'outils de hacking, de cybersécurité et de pentesting. Découvrez les dernières mises à jour des projets pour trouver des vulnérabilités, analyser des systèmes, automatiser les tests et renforcer votre sécurité.

FluxContactConfidentialité© 2026 Kitploit

Répertoire d'outils

Catégories

Voir toutes les catégories
Loading categories
ceasta — disassembler, decompiler and debugger in one, with a built-in mcp server: point an ai at a binary and it can debug it, not just read it. ida-style listing, pseudocode (f5), x64dbg-style debugger (windows and linux), binary diff, lua plugins. reads pe, elf and mach-o. runs on windows, linux and macos. | Kitploit
Outils/GitHubGitHub/ngwg/ceasta
Static AnalysisDynamic Analysis (Sandboxing)Reverse EngineeringScripting & AutomationDebuggersMalware AnalysisBinary AnalysisAI-Assisted ReversingBinary Exploitation
GitHubngwg/ceasta

ceasta

Voir le dépôt
1699704il y a 19 joursVérifié par Kitploit
Site web

Populaires

Voir tout →

Découvrez les outils les plus utilisés par notre communauté.

Explorer tous les outils

Parcourez notre collection d'outils

Voir tous les outils →

À propos

disassembler, decompiler and debugger in one, with a built-in mcp server: point an ai at a binary and it can debug it, not just read it. ida-style listing, pseudocode (f5), x64dbg-style debugger (windows and linux), binary diff, lua plugins. reads pe, elf and mach-o. runs on windows, linux and macos.

Partager
Contenu non disponible dans la langue demandée. Affichage de la version anglaise.

ceasta

ceasta

a disassembler, decompiler and debugger in one — for windows, linux and macos, x86, x64 and arm64


latest release platforms license c++17

ida-style listing, a decompiler, a function graph, an x64dbg-style debugger, lua plugins, and a built-in MCP server so you can point an AI at a binary — one small program, everything vendored, nothing to install to build.
listing

one function, three ways

ceasta shows the same code from raw bytes up to readable c, so you can drop to whatever level you need:

; assembly - the real instructions  // pseudocode (f5) - reconstructed c

checksum proc                       int checksum(int rdi)
  movzx   edx, byte ptr [rdi]       {
  test    dl, dl                        rdx = *(char*)rdi;
  je      loc_1191                      if (rdx == 0) {
  mov     eax, 0x1505                       return 0x1505;
loc_1179:                               }
  mov     ecx, eax                      rax = 0x1505;
  shl     ecx, 5                        do {
  add     eax, ecx                          rax = rax + (rax << 5) + rdx;
  add     rdi, 1                            rdi = rdi + 1;
  movzx   edx, dl                           rdx = *(char*)rdi;
  add     eax, edx                      } while (rdx != 0);
  movzx   edx, byte ptr [rdi]           return rax;
  test    dl, dl                    }
  jne     loc_1179
  ret
loc_1191:
  mov     eax, 0x1505
  ret

that's djb2 (5381 is 0x1505, and (h << 5) + h is h * 33). click a name in the pseudocode and name things as you understand them — y on the function gives it a prototype, n renames a variable:

unsigned checksum(const char* s)
{
    rdx = *(char*)s;
    if (rdx == 0) {
        return 0x1505;
    }
    h = 0x1505;
    do {
        h = h + (h << 5) + rdx;
        s = s + 1;
        rdx = *(char*)s;
    } while (rdx != 0);
    return h;
}

the decompiler is best-effort (x86 / x64, no structs yet) — great for getting a routine quickly, while the listing stays the source of truth.

download

grab it from the releases page:

fileplatformwhat you get
ceasta-x.y.z-setup.exewindows 10/11 x64the full app, installs for your user (no admin), start menu + optional "open with ceasta"
ceasta-x.y.z-windows-x64.zipwindows x64the full app, portable — unzip and run ceasta.exe
ceasta-x.y.z-linux-x64.AppImagelinux x64the full app — chmod +x and run (on linux)
ceasta-cli-x.y.z-linux-x64.tar.gzlinux x64ceasta-cli + plugins: analysis, disassembly, decompiler, scripting, terminal debugger, binary diff, signatures, and the MCP server
ceasta-x.y.z-macos.dmgmacos 11+, apple silicon and intelthe app, no debugger yet — drag it to Applications (on a mac)
ceasta-cli-x.y.z-macos.tar.gzmacos 11+, apple silicon and intelceasta-cli + plugins, everything above but the debugger

what it does

  • opens pe files (exe, dll, sys — x86, x64 and arm64), elf (x86, x64, arm64), mach-o (macos / ios programs and libraries, x86_64 and arm64, universal files too) and raw code
  • auto analysis: functions (entry, exports, symbols, .pdata, unwind tables, mach-o function starts, tls callbacks, calls, pointers in data), switch tables, xrefs, strings (ascii + utf-16), imports / exports, thunks, noreturn calls
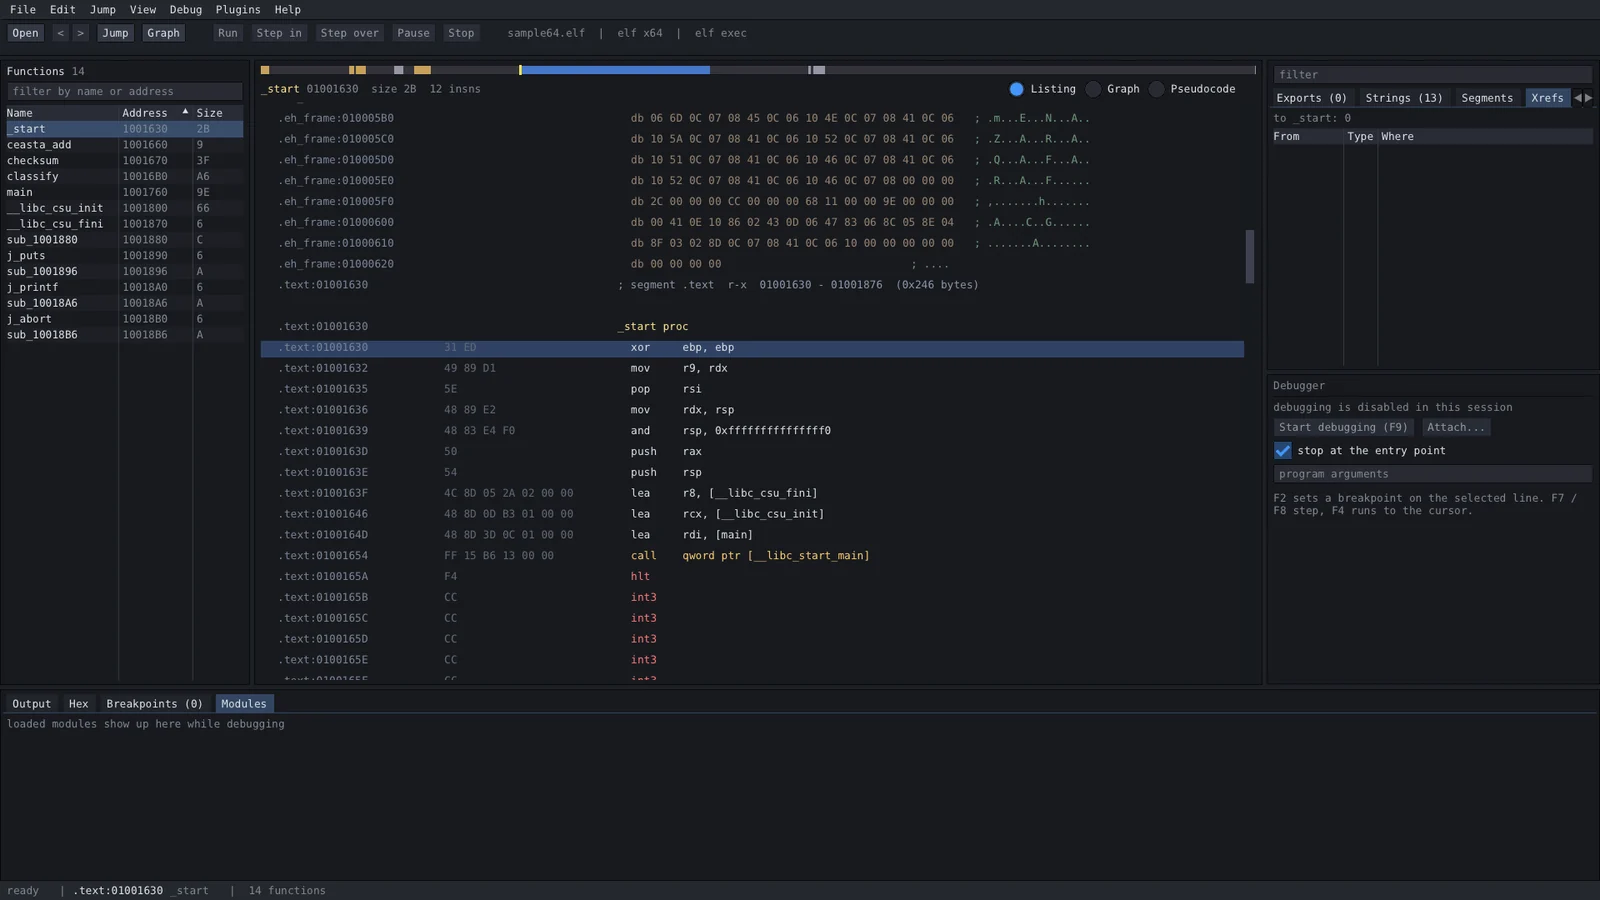
  • ida-style listing: names instead of addresses, labels, xref and string comments, the arguments each instruction passes to a known api
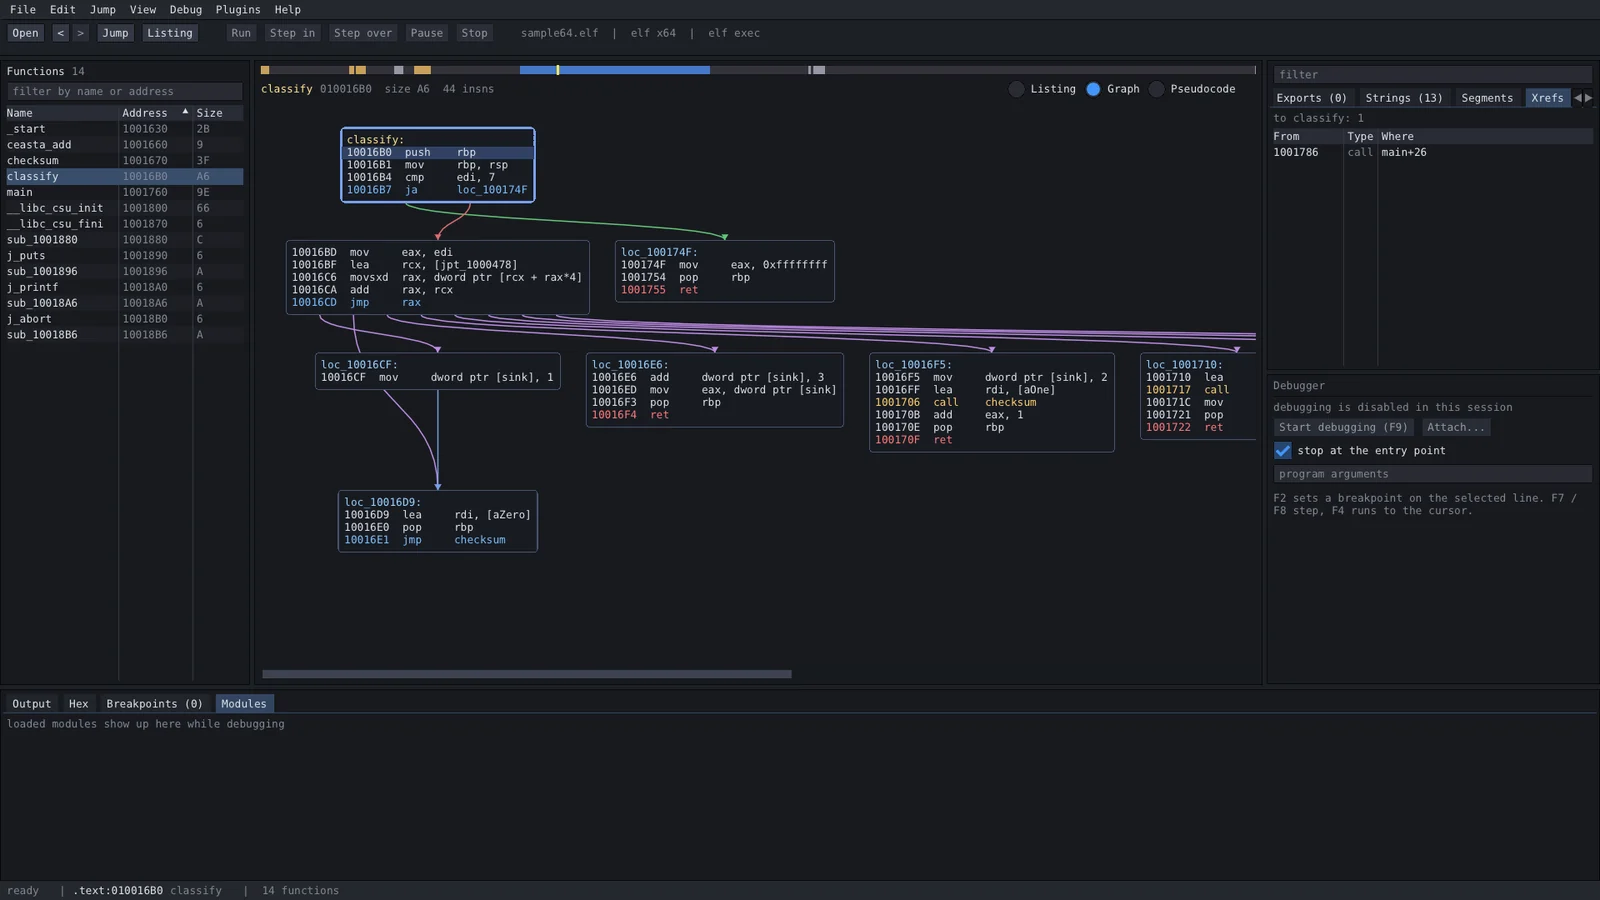
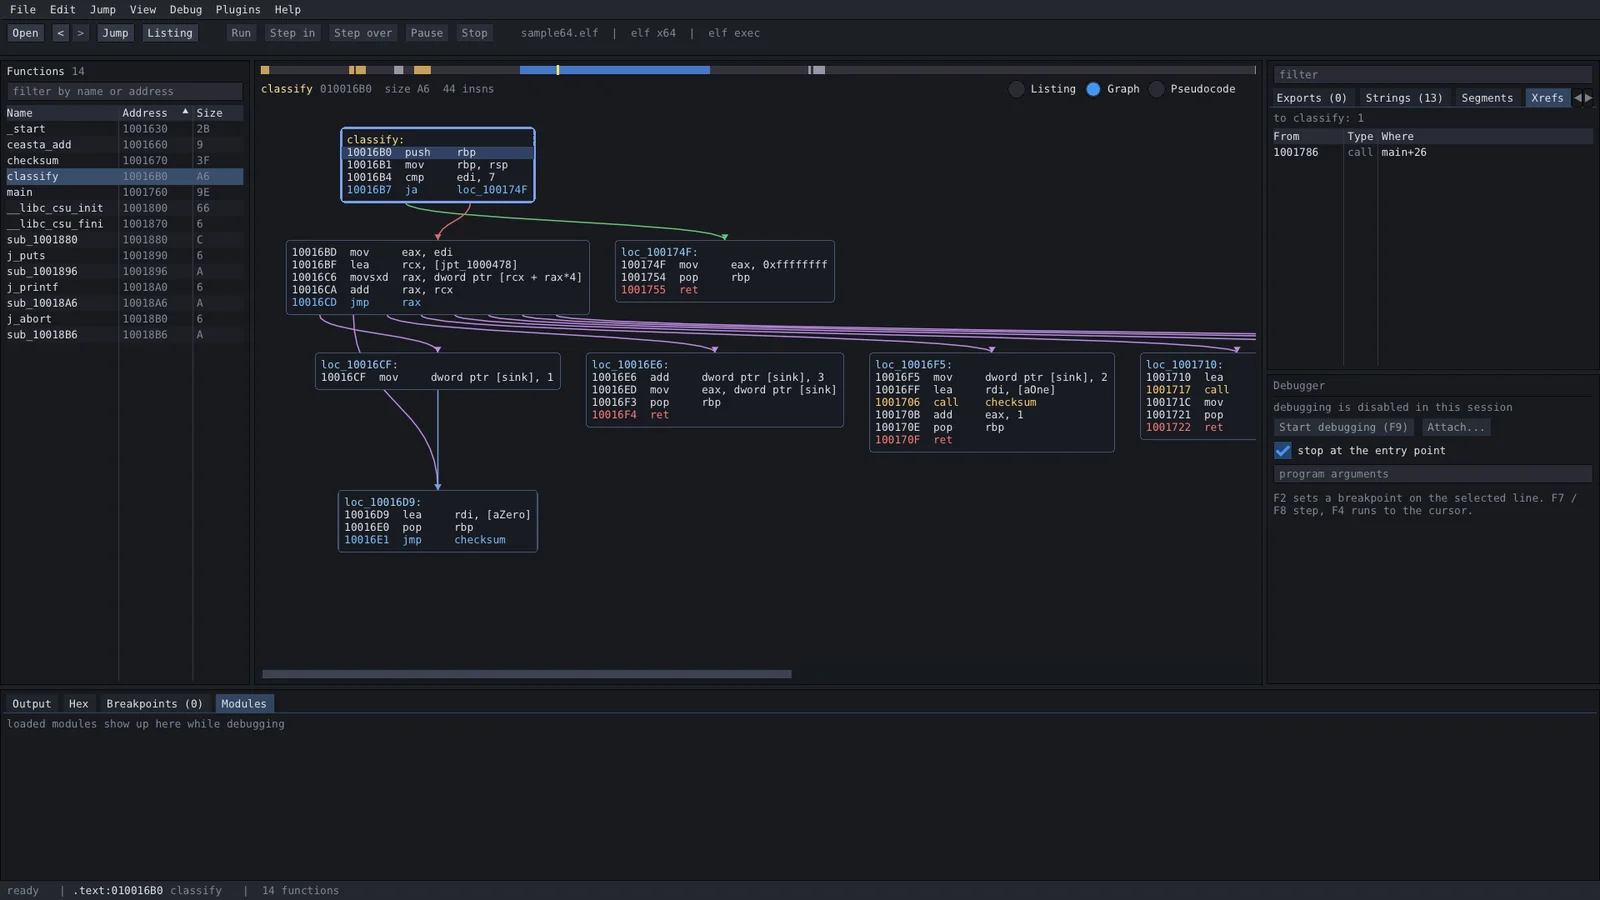
  • function graph (space): colored edges, zoom with ctrl + wheel, drag to pan
  • decompiler (f5, x86 / x64): c-like pseudocode — if / else, loops, switch, stack variables, calls with their arguments (~350 known api prototypes). click a name: n renames it, y sets a type or a prototype. shift+f5 shows it next to the listing
  • a second decompiler if you want one: with kuna installed (a decompiler ported from ghidra's), the pseudocode view gets a kuna switch — its output for the same function, lines linked to the listing, arm64 too. more below
  • file info: headers, security flags (aslr, dep, cfg / pie, nx, relro, canary / hardened runtime), md5 / sha256 / imphash, section entropy, resources, version info, a mac program's code signature and entitlements, and warnings when it looks packed
  • search everything (ctrl+f): functions, names, imports, exports, strings, comments and segments in one box, and the strings say where they're used
  • debugger (x86 / x64, windows and linux): start or attach, breakpoints (with conditions: rdi == 3), watchpoints on variables, step into / over / out, step back, run to cursor, pause, registers, stack, call stack, memory map, live memory
    • the pseudocode marks the line you're stopped on
    • call a function in the running program (call decrypt "..."), record indirect call targets as xrefs (trace)
    • ceasta-cli dbg: the same debugger in a terminal
  • binary diff: match functions between two builds and see what changed
  • library signatures: name known functions in a stripped binary (sigmake / sigapply)
  • a built-in MCP server: connect an AI (Claude Code, Cursor, ...) to the open binary from the AI menu, or with ceasta-cli mcp — with ready-made prompts, and names you review before they're applied. see connect an AI
  • rename, comments, bookmarks, jump to address or name, xrefs, byte search, back / forward, undo / redo, and every action in one list (ctrl+shift+p)
  • your work in one file, like ida's .i64: ctrl+s writes <file>.ceasta with your names, comments, types, breakpoints and the program itself — it opens later, or on another machine, without the original. closing asks before it throws unsaved work away
  • trade names with other tools: export an idapython script, a ghidra script or an x64dbg database; import from x64dbg, .map files, and ida / ghidra (with the scripts in scripts/)
  • lua plugins and a lua console; ceasta-cli for scripts and ci

layout

one window, nothing floating around:

  • top: menu and toolbar
  • left: functions
  • middle: overview band, then the listing, the graph, the pseudocode, or listing and pseudocode side by side
  • right: imports / exports / strings / file info / xrefs, with the debugger (registers + stack) under it while debugging
  • bottom: output + lua console, hex, breakpoints — and call stack and memory while debugging
  • drag the lines between panels to resize, the view menu hides panels and switches theme, ctrl + / ctrl - changes the text size

graph

Télécharger l’outil