
Skip to content
KitploitKITPLOIT
HerramientasBlog
Log in
Enviar
HerramientasBlog
Enviar

¡Herramientas de Hacking, PenTest y Ciberseguridad para tu Arsenal de Seguridad!

Kitploit es un directorio de herramientas de hacking, ciberseguridad y pentesting. Descubre las últimas actualizaciones de proyectos para encontrar vulnerabilidades, analizar sistemas, automatizar pruebas y fortalecer tu seguridad.

··Feeds·Contacto·Privacidad·© 2026 Kitploit

Directorio de Herramientas

Categorías

Ver todas las categorías
Loading categories
monitor — Real-time monitoring and slowlog analysis for Valkey and Redis databases with anomaly detection, ACL auditing, and Prometheus metrics export. | Kitploit
Herramientas/GitHubGitHub/betterdb-inc/monitor
Database SecurityAnomaly DetectionLog Analysis
GitHubbetterdb-inc/monitor

monitor

Real-time monitoring and slowlog analysis for Valkey and Redis databases with anomaly detection, ACL auditing, and Prometheus metrics export.


Ver RepositorioSitio web
1.2k6968hace 12h 25mRevisado por Kitploit

Más Populares

Ver todos →

Descubre las herramientas más usadas por nuestra comunidad.

Explora todas las herramientas

Explora nuestra colección de herramientas

Ver todas las herramientas →
Compartir
Contenido no disponible en el idioma solicitado. Mostrando versión en inglés.

BetterDB Monitor

Docker Pulls Docker Image Version Artifact Hub npm npm downloads API Tests License Valkey Redis

The monitoring layer that Valkey deserves.

BetterDB persists what Valkey throws away - slowlogs, command patterns, client activity, anomaly signals - so you can debug what happened at 3am, not just what's happening now. Built for Valkey 8.x with native support for COMMANDLOG, CLUSTER SLOT-STATS, and per-thread I/O metrics. Redis 6+ compatible for everything else.

Website | Docker Hub | npm | Documentation | Blog

BetterDB is built by BetterDB Inc., a public benefit company operating under the OCV Open Charter.
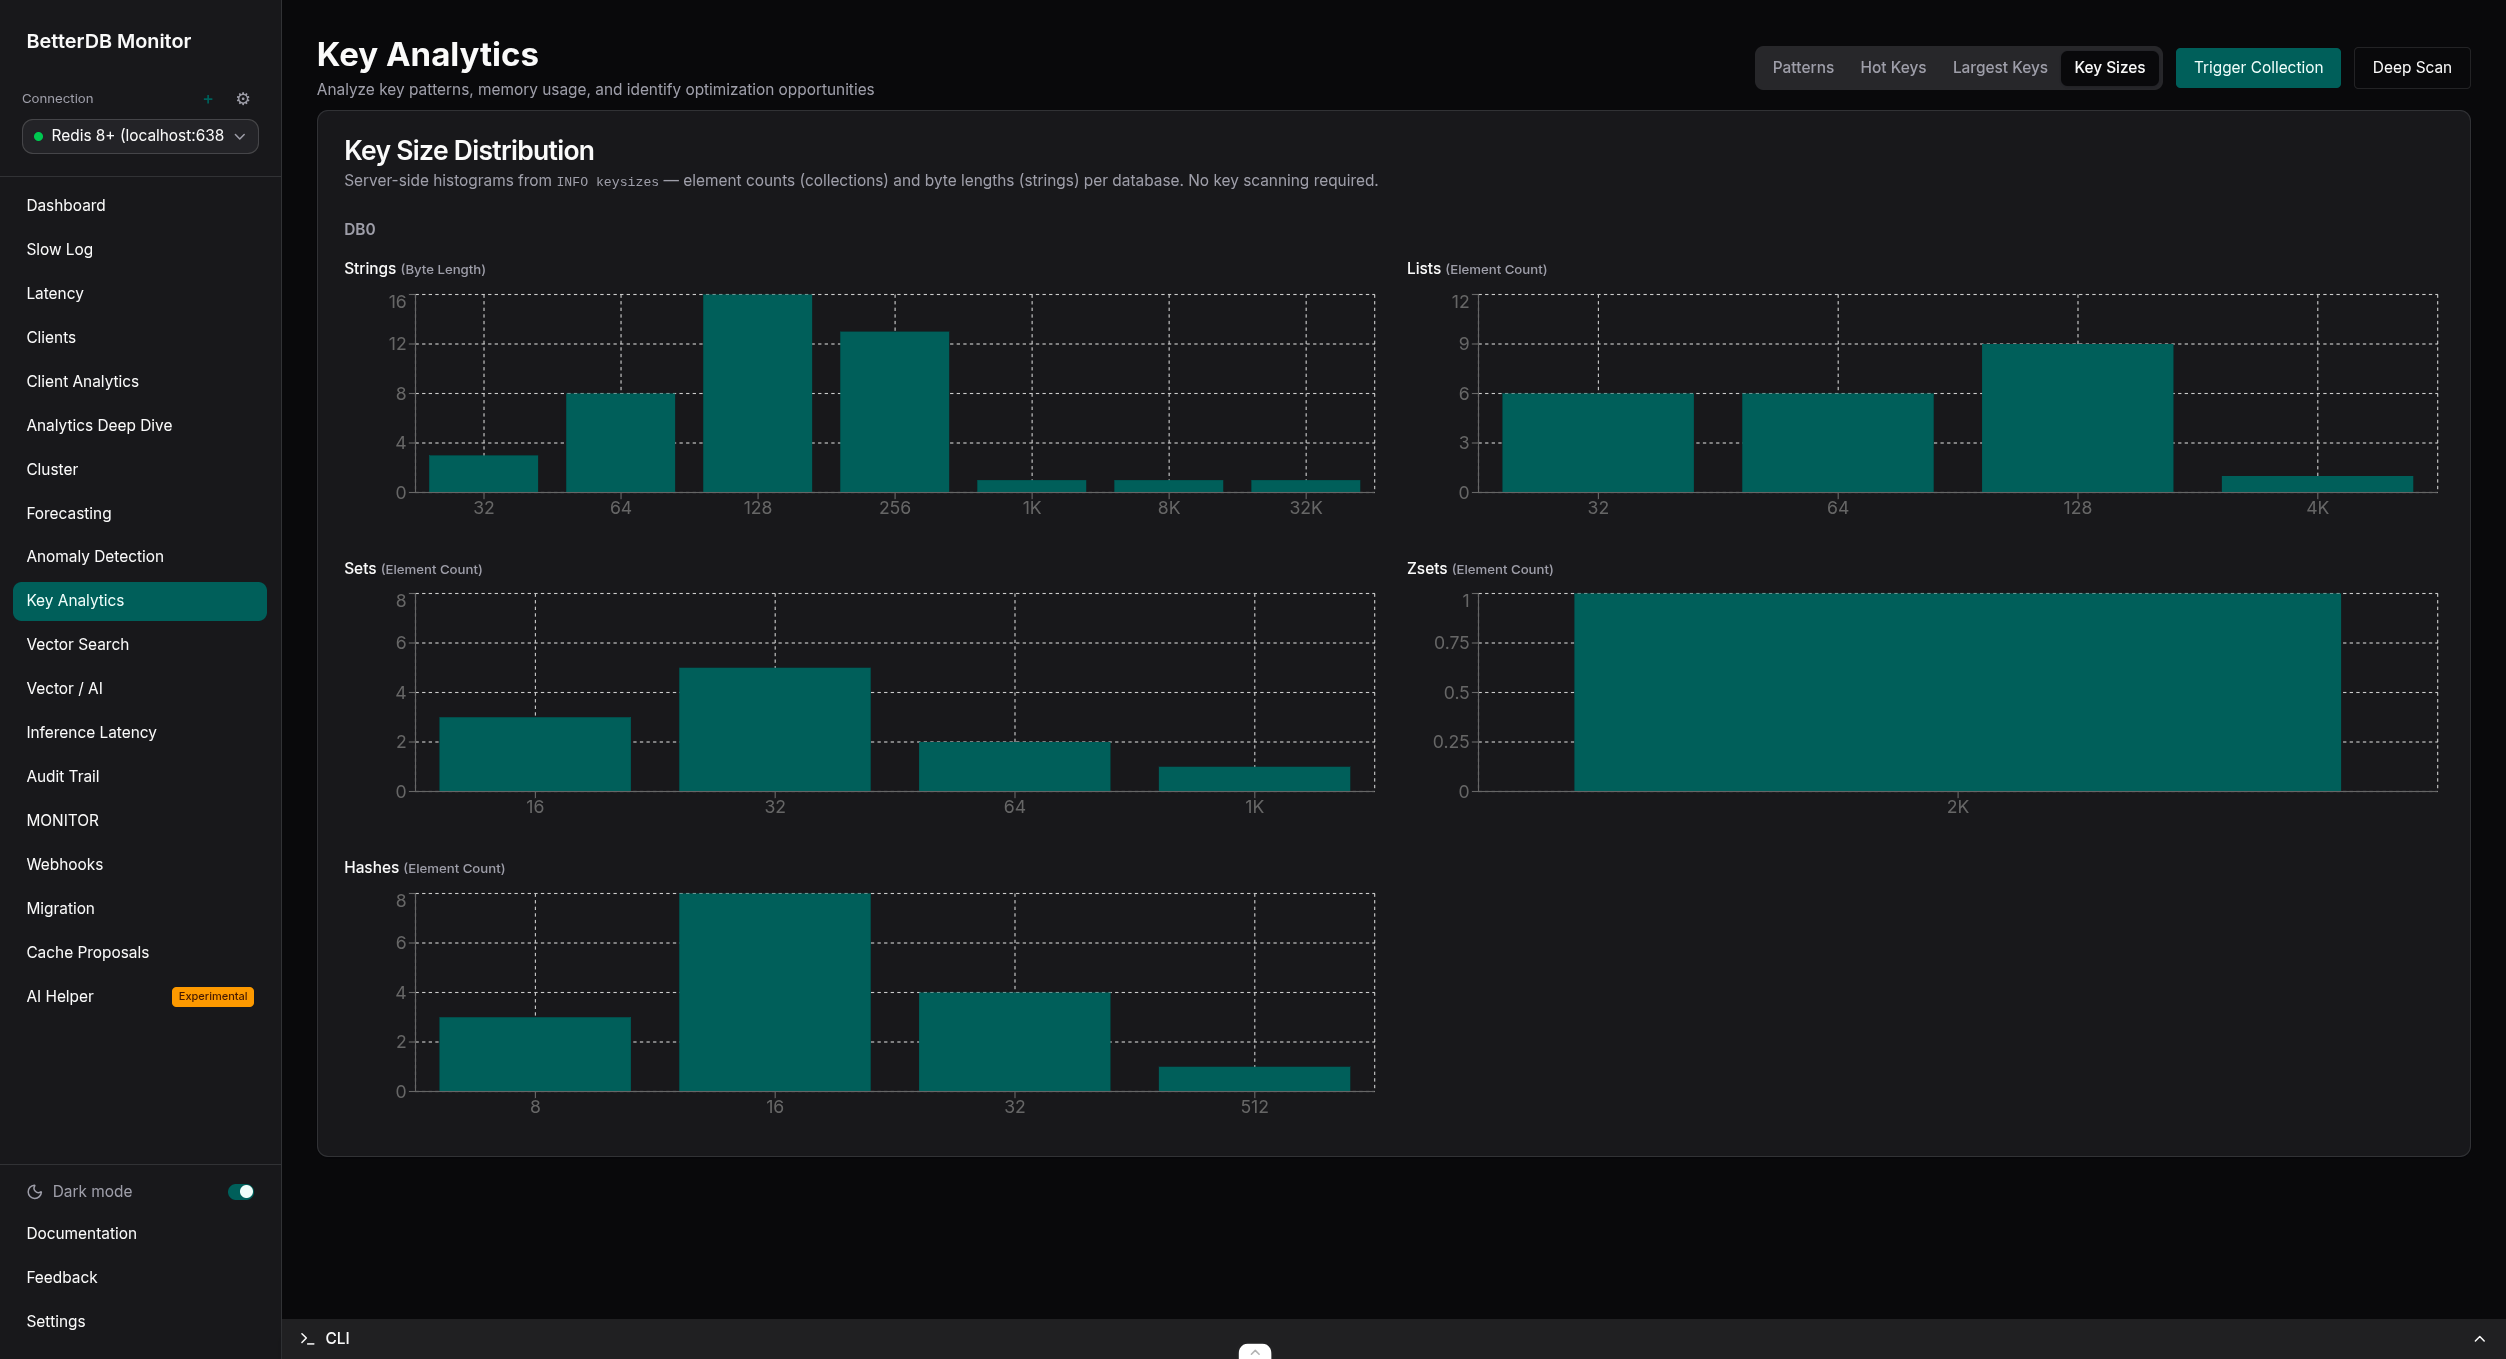
BetterDB Monitor - Key Analytics with per-type key size distribution histograms

Quick Start (Docker)

docker run -d --name betterdb -p 3001:3001 betterdb/monitor:latest

Point your browser to http://localhost:3001. To monitor a specific instance:

docker run -d \
  --name betterdb \
  -p 3001:3001 \
  -e DB_HOST=your-valkey-host \
  -e DB_PORT=6379 \
  -e DB_PASSWORD=your-password \
  betterdb/monitor:latest

Connecting to a database on your host machine? Inside the container localhost is the container itself, not your host — so use host.docker.internal as the database host. On Docker Desktop (macOS/Windows) it works out of the box; on Linux add --add-host=host.docker.internal:host-gateway to the docker run command so the name resolves. The dashboard's one-click "connect to local instance" button auto-detects this and pre-fills the right host for you.

Two image variants are published, both multi-arch (linux/amd64, linux/arm64):

TagWhat it is
latest, X.Y.Z-no-aiDefault image - every monitoring feature included, without the dependencies for the experimental local-LLM AI Helper
X.Y.ZAdds the experimental AI Helper (bring your own Ollama; disabled by default via AI_ENABLED)

See Docker Production Deployment for persistent storage, custom ports, licensing, and air-gapped setups.

Quick Start (Kubernetes / Helm)

helm repo add betterdb https://docs.betterdb.com/charts
helm repo update
helm install betterdb-monitor betterdb/betterdb-monitor \
  --namespace betterdb --create-namespace \
  --set db.host=my-valkey.default.svc.cluster.local \
  --set db.password=yourpassword

Then kubectl port-forward -n betterdb svc/betterdb-monitor 3001:3001 and open http://localhost:3001, or enable the chart's ingress. PostgreSQL-backed history, bring-your-own Secrets, and air-gapped licensing are all covered in the Kubernetes guide and the chart README.

Quick Start (CLI)

Run BetterDB Monitor without Docker:

npx @betterdb/monitor

On first run, an interactive setup wizard guides you through database connection, storage backend (SQLite, PostgreSQL, or in-memory), and server settings. Configuration is saved to ~/.betterdb/config.json.

npm install -g @betterdb/monitor   # global install
betterdb --setup                   # re-run setup wizard
betterdb --port 8080               # override server port
betterdb --db-host 1.2.3.4         # override database host
betterdb --help                    # all options

Requires Node.js >= 20.0.0 and a Valkey or Redis instance to monitor. For SQLite storage, also npm install -g better-sqlite3.


What You Get

See everything, keep everything

  • Historical analytics - query slowlogs, command patterns, client activity, and latency across any time range. The data that used to disappear after a log rotation.
  • COMMANDLOG support - Valkey 8.1+ exclusive. Large requests and large replies, not just the slow ones.
  • MONITOR capture sessions - record real traffic on demand: live tail, filter, replay, export to JSON/CSV, and cross-reference against connection history.
  • Hot key tracking - top keys by access frequency with rank movement over time. Key Analytics (Pro, free in early access) adds type, TTL, and size distributions from live sampling.
  • Cluster visibility - topology graphs, SLOT-STATS heatmaps, per-slot CPU and key distribution.
  • Cluster auto-registration - a cluster connection can auto-register every node as its own monitored connection, kept in sync as the cluster scales. See docs/cluster-auto-registration.md.
  • CPU & I/O thread metrics - per-thread visibility that no Redis tool can provide.
  • Client analytics - see exactly which service is responsible for what, attributed by client name and pattern.
  • ACL audit trail - track who accessed what, persisted for compliance and post-incident debugging.

Understand and act

  • Anomaly detection (Pro, free in early access) - automatic baseline learning with correlated events and plain-English diagnoses. 20+ detectors, no manual thresholds.
  • Capacity forecasting - projected time-to-ceiling for memory, ops/sec, CPU, and fragmentation.
  • Webhooks - HMAC-signed alert deliveries with retries and a full delivery log.
  • Live migration - move between Redis and Valkey with a three-phase analysis, execution, and validation workflow.

Built for the AI era

  • Vector search observability - FT.SEARCH ops/sec and latency with per-index health for valkey-search and RediSearch. See docs/vector-ai.
  • Inference latency - p50/p95/p99 per index, with SLA breach alerts (Pro, free in early access).
  • Semantic cache intelligence (Pro, free in early access) - hit-rate health, similarity-threshold recommendations, and an approve/reject proposal workflow. Agent memory observability included.
  • AI traces - OTLP span waterfalls from your AI application, correlated with the live Valkey state underneath each request. See docs/opentelemetry.md.

Plugs into everything

Descargar herramienta