
Skip to content
KitploitKITPLOIT
ToolsBlog
Submit
ToolsBlog
Submit

Hacking, PenTest, and Cybersecurity Tools for Your Security Arsenal!

Kitploit is a directory of hacking, cybersecurity, and pentesting tools. Discover the latest project updates to find vulnerabilities, analyze systems, automate testing, and strengthen your security.

··Feeds·Contact·Privacy·© 2026 Kitploit

Tool Directory

Categories

View all categories
Loading categories
Vol3xp — Volatility Explorer Suit (volatility 3) | Kitploit
Tools/GitHubGitHub/memoryforensics1/vol3xp
Memory ForensicsReverse EngineeringForensicsMalware AnalysisDigital ForensicsIncident Response
GitHubmemoryforensics1/vol3xp

Vol3xp

Volatility Explorer Suit (volatility 3)

View Repository
701243 years agoReviewed by Kitploit

Most Popular

View all →

Discover the most used tools by our community.

Explore all tools

Browse our collection of tools

View all tools →
Share

Vol3xp, Volatility 3 Explorer Plugins

WinObj -> Windows Kernel Objects Explorer an improve of https://github.com/kslgroup/WinObj for volatility 3 (winobj.py)

WinObj (very similar to WinObj [sysinternals]) Also supports Struct Analyzer and WinObjGui from VolExp.

RAMMap -> Physical Address Mapping (pfn.py)

RAMMap (very similar to Rammap [SysInternals]), but additonally it marks any suspicious pages (for more information read the pdf). This module contains 3 plugins:

  1. P2V - Converts physical address to virtual address using PfnDatabase and finds the owning process of a page (if any).
  2. PFNInfo - Gives information about a physical page from the PfnDatabase, the use of the page, file name, and much more.
  3. RAMMap - Uses both of the plugins above. Displays a RamMap-like UI for all the physical pages, and colors suspicious pages. [You can see far more detailed information about the plugins in the pdf]

And the main event -> Volatilty Explorer (volexp.py)

This program allows the user to upload a memory dump and navigate through it with ease using a graphical interface. It can also function as a plugin to the Volatility Framework (https://github.com/volatilityfoundation/volatility3). This program functions similarly to Process Explorer/Hacker, but allows the user to analyze a Memory Dump. This program can run from Windows, Linux and MacOS machines, but only accepts Windows memory images.

note: volatility explorer for volatility2 -> https://github.com/memoryforensics1/VolExp

Quick Start

  1. Download the volexp.py file (download the ).

  2. Run as a standalone program or as a plugin to Volatility:

  • As a standalone program:
root@kitploit:~
 python3 volexp
  • As a Volatility plugin:
root@kitploit:~
 python3 vol.py -f <memory file path> windows.volexp.volexp

Some Features:

root@kitploit:~
python3 volexp.py
  • Some of the information display will not update in real time (except Processes info(update slowly), real time functions like struct analyzer, PE properties, run real time plugin, etc.). example vol3xp, the colors used to identify special processes (serviceses, protected)
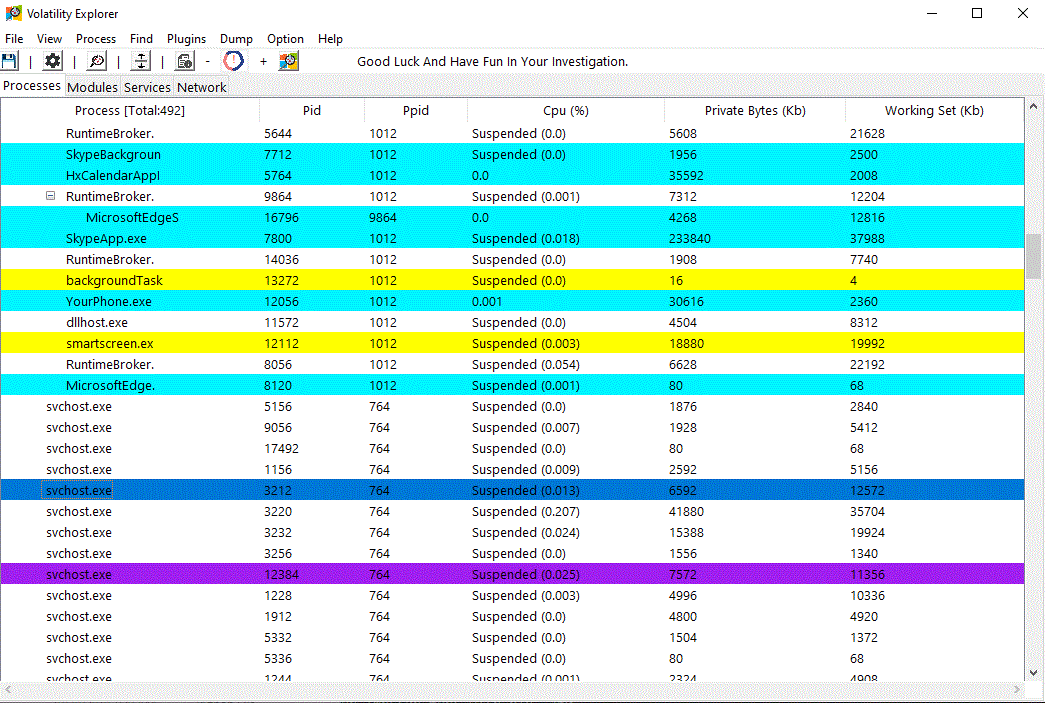
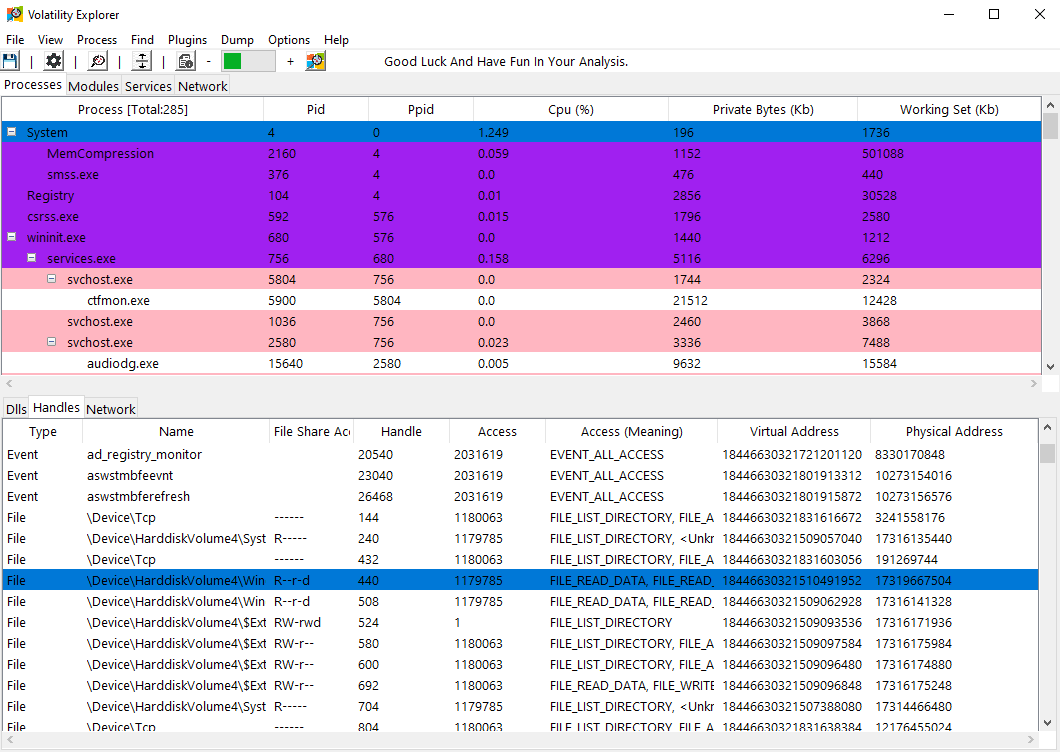
  • The program also allows to view Loaded dll's, open handles and network connections of each process (Access to a dll's properties is also optional).
Lower Pane

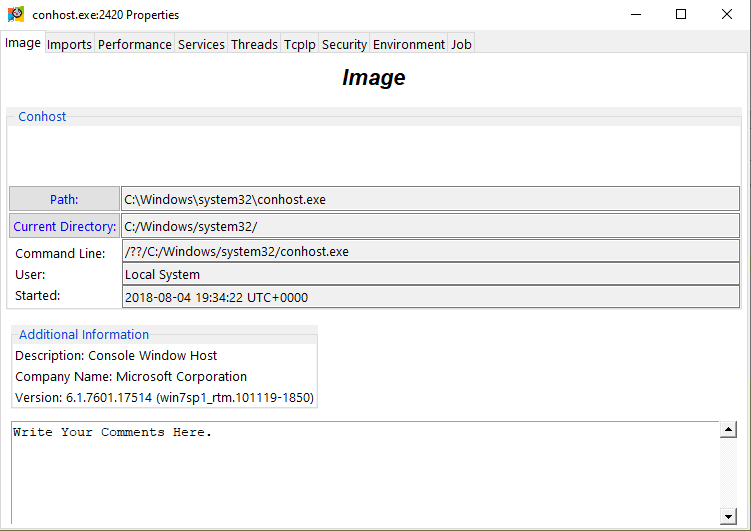
  • To present more information of a process, Double-Click (or Left-Click and select Properties) to bring up an information window.

Process properties

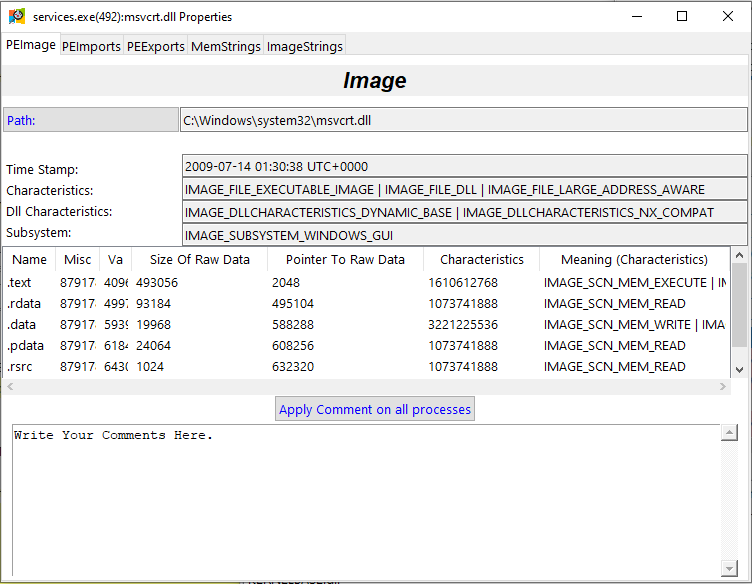
  • Or present more information on any PE.

PE properties

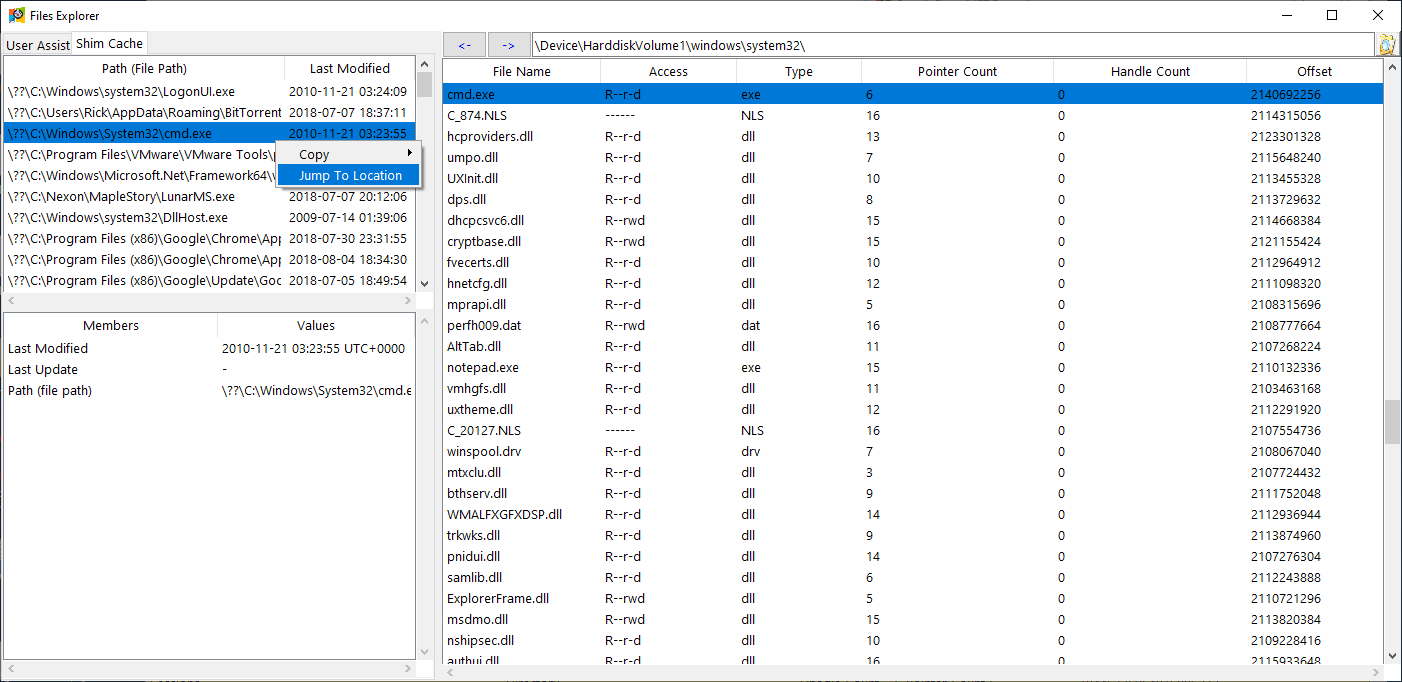
  • The program allows the user to view the files in the Memory Dump as well as their information. Additionally it allows the user to extract those files (HexDump/strings view is also optional).

File Explorer

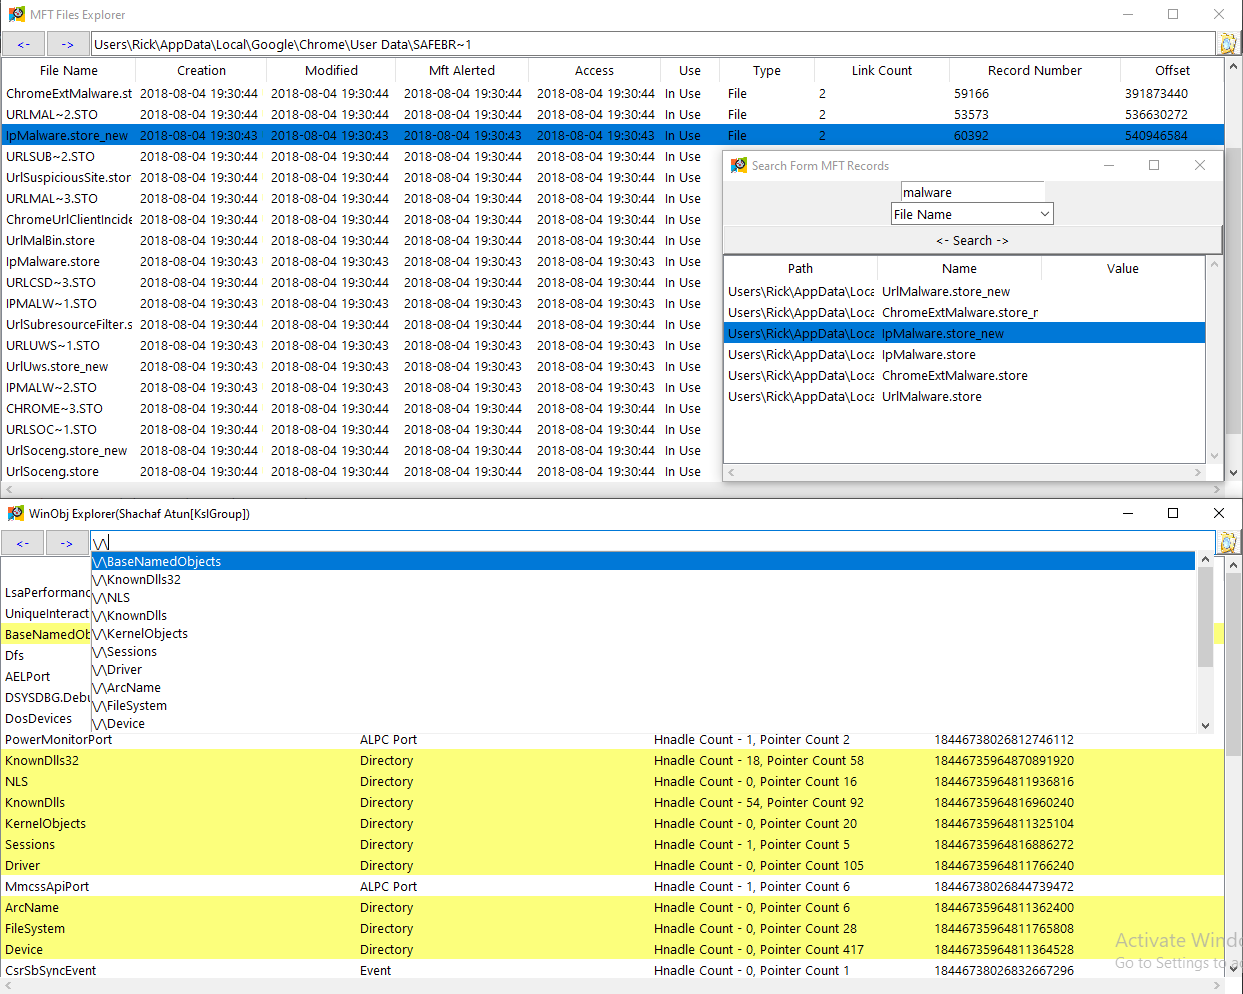
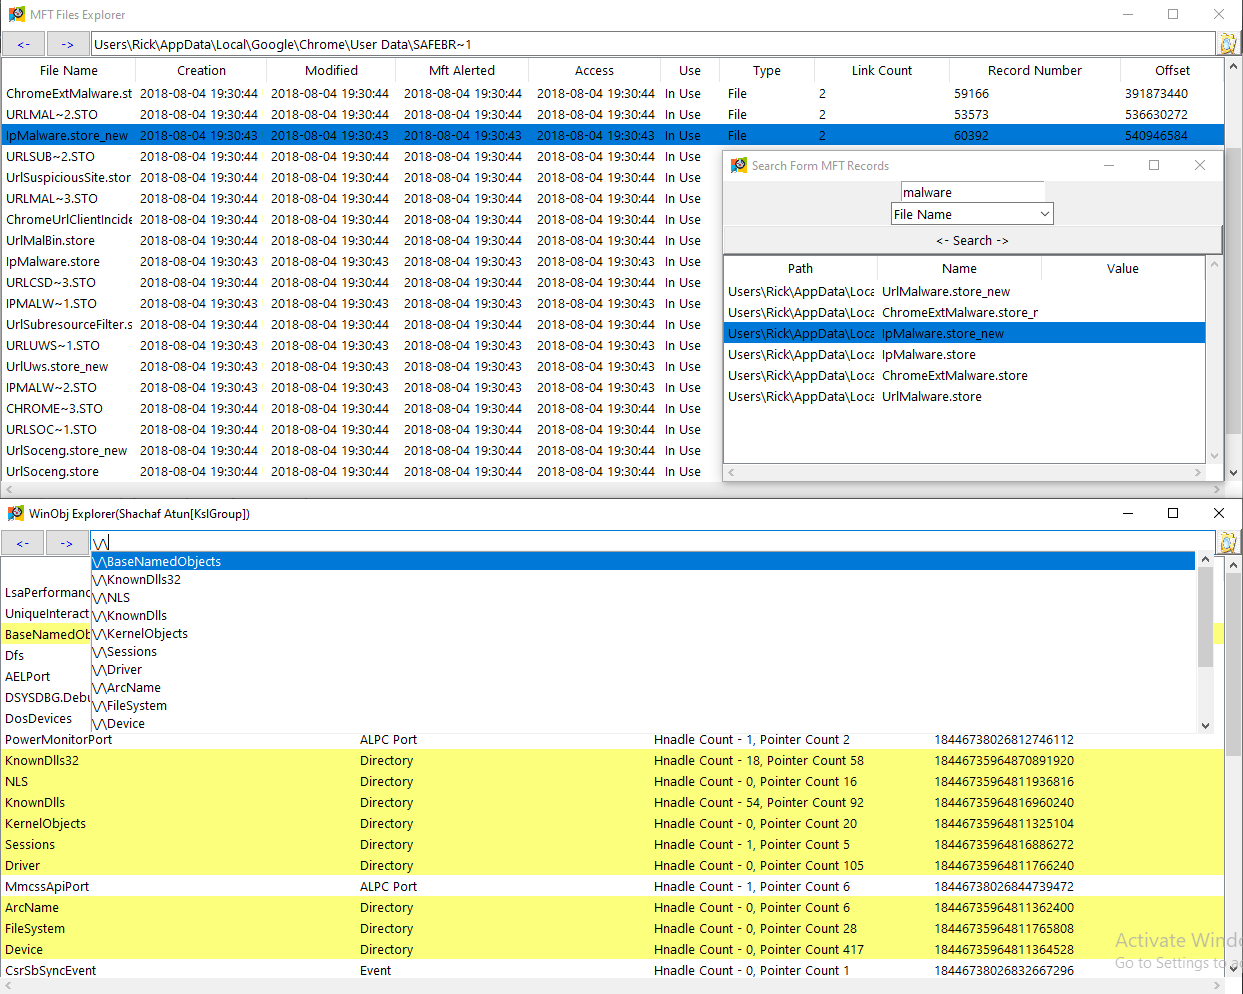
  • The program supports viewing of the Windows Objects and files's matadata (MFT).

Other Explorers (Winobj and MFT explorer)

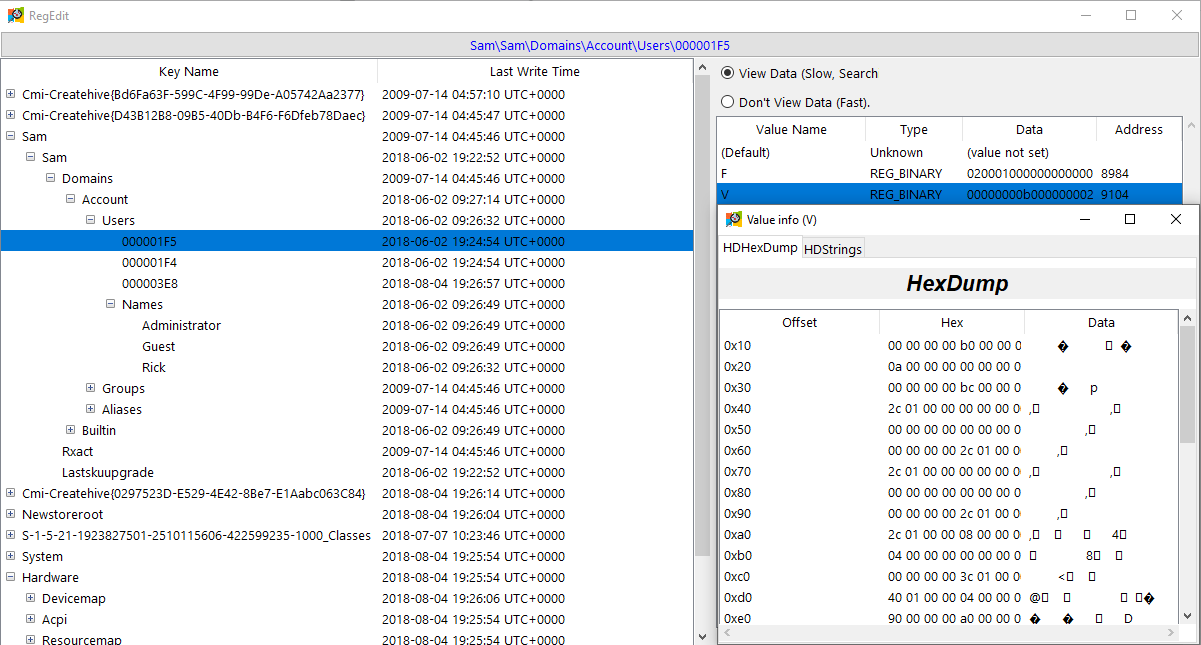
  • The program also support viewing a regview of the memory dump

RegView

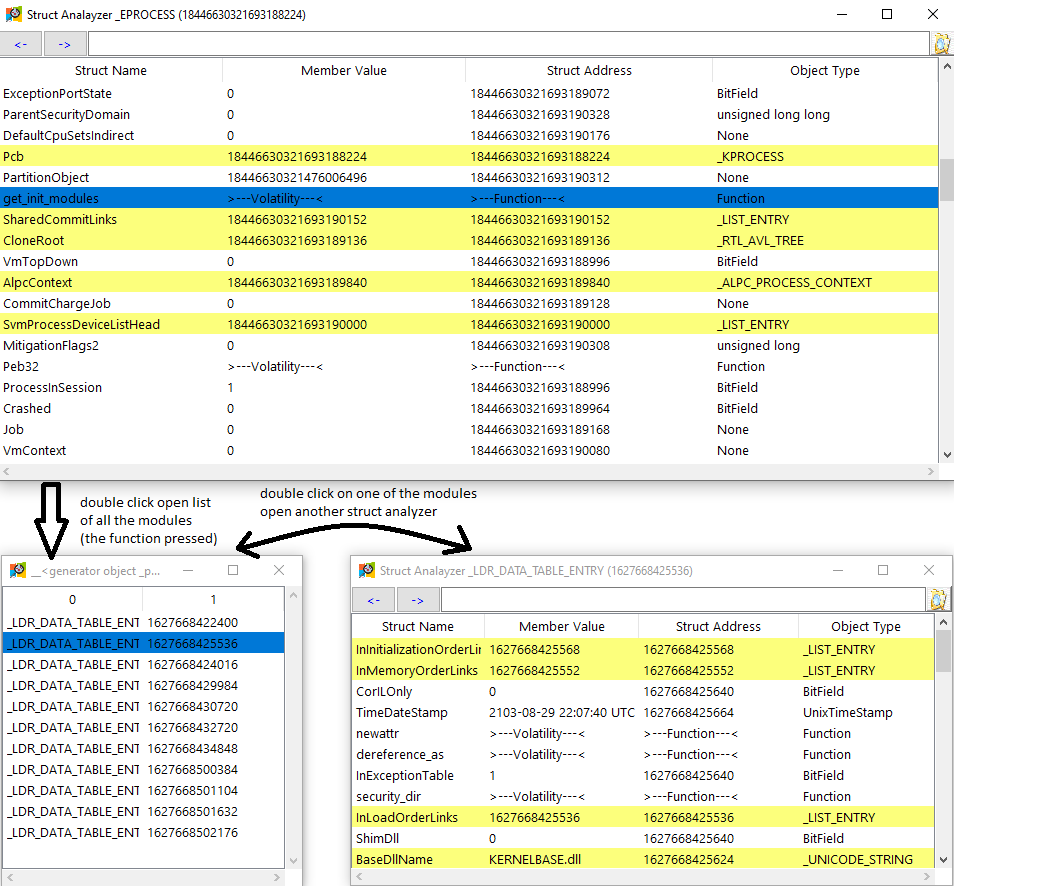
  • Additionally, the program supports struct analysis. (writing on the memory's struct, running Volatility functions on a struct is available). Example of getting all the load modules inside _EPROCESS struct in another struct analyzer window:

Struct Analyzer

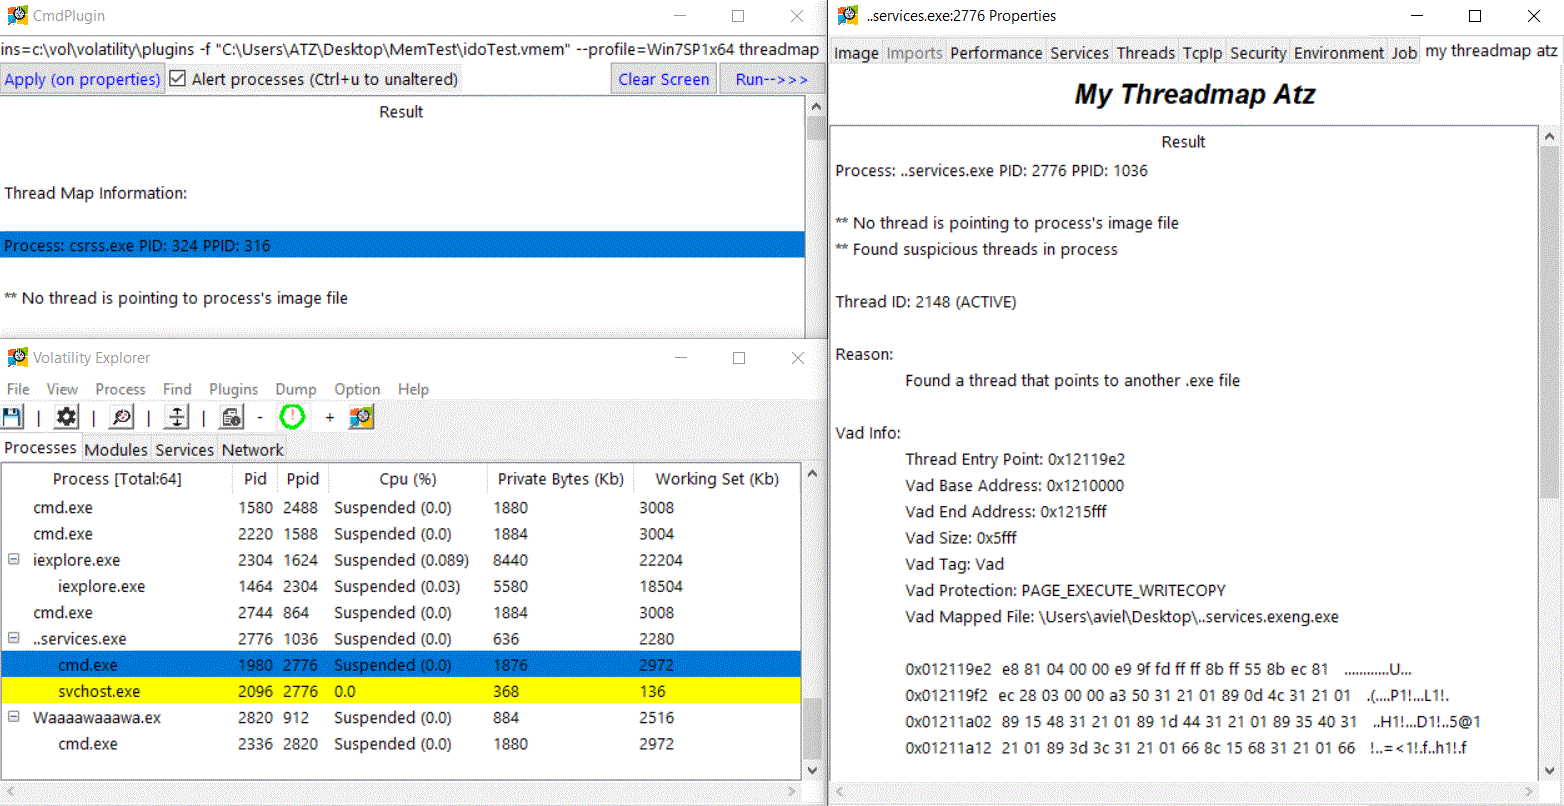
  • The Program is also capable of automatically marking suspicious processes found by another plugin. Example of a running threadmap plugin:

Cmd Plugin run threadmap

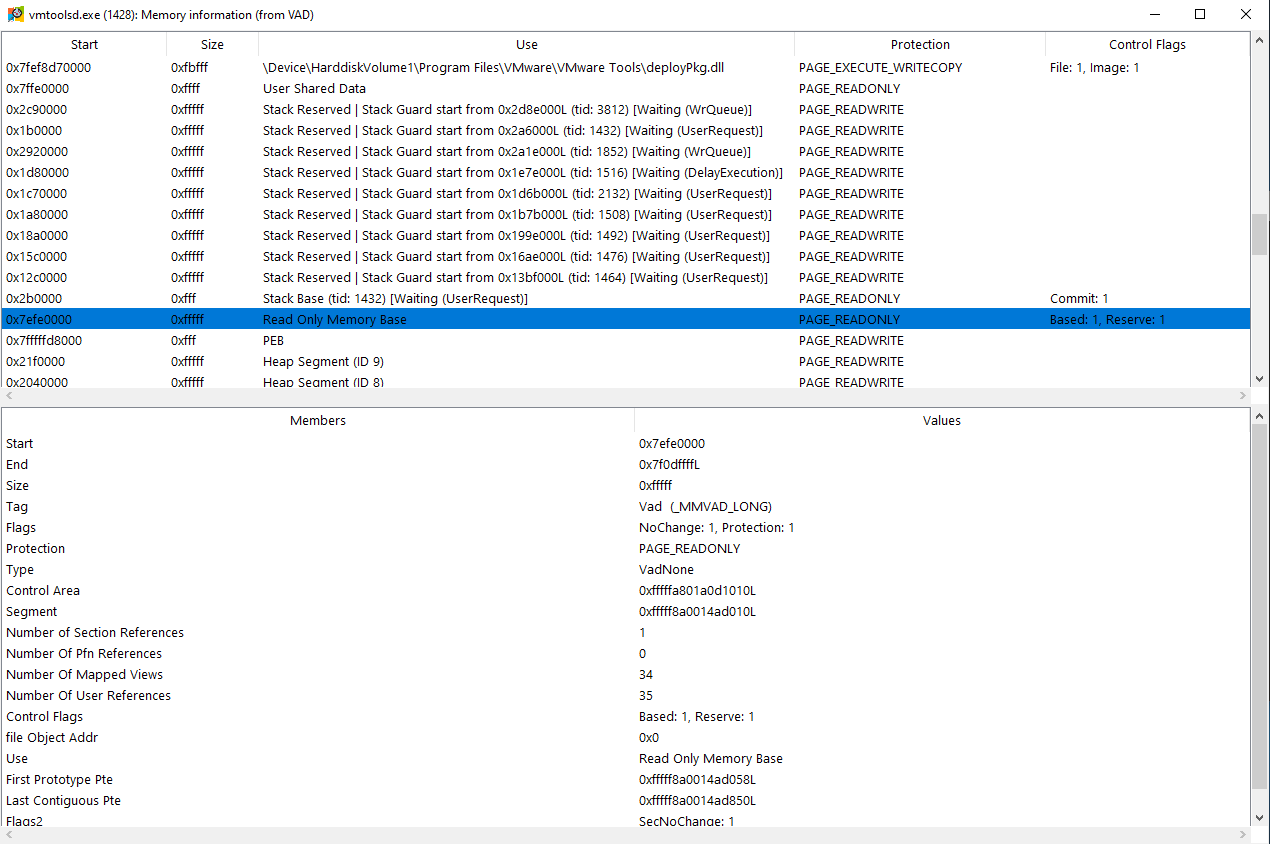
  • View memory use of a process.

Vad Information

  • Manually marking a certain process and adding a sidenote on it.

  • User's actions can be saved on a seperate file for later usage.
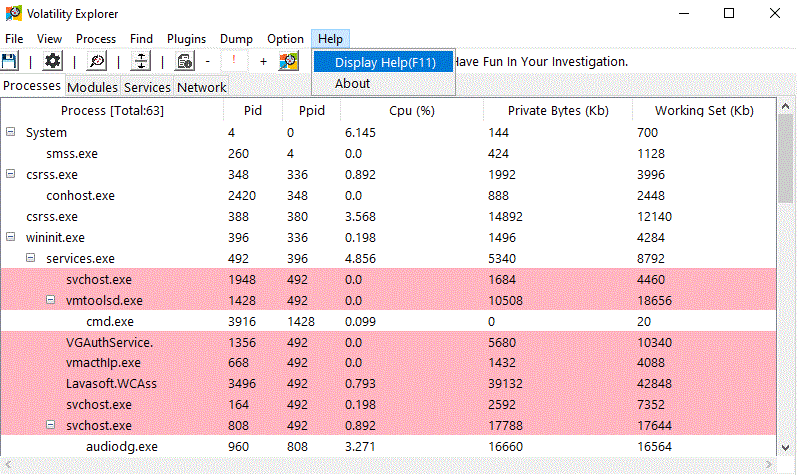
get help: https://github.com/memoryforensics1/VolExp/wiki/VolExp-help:

volexp help

Download Tool