MemProcFS-Analyzer
MemProcFS-Analyzer.ps1 is a PowerShell script utilized to simplify the usage of MemProcFS and to optimize your memory analysis workflow.
MemProcFS - The Memory Process File System by Ulf Frisk
https://github.com/ufrisk/MemProcFS
Features:
- Fast and easy memory analysis!
- You can mount a memory snapshot (Raw Physical Memory Dump or Microsoft Crash Dump) like a disk image and handle the memory compression feature on Windows
- Auto-Install of MemProcFS, AmcacheParser, AppCompatCacheParser, Elasticsearch, entropy, EvtxECmd, ImportExcel, IPinfo CLI, jq, Kibana, lnk_parser, RECmd, SBECmd, xsv, YARA, and Zircolite
- Auto-Update of MemProcFS, AmcacheParser, AppCompatCacheParser, Elasticsearch, entropy, EvtxECmd (incl. Maps), ImportExcel, IPinfo CLI, jq, Kibana, lnk_parser, RECmd, SBECmd, xsv, YARA, and Zircolite
- Update-Info when there's a new version of ClamAV or a new Dokany File System Library Bundle available
- Pagefile Support
- OS Fingerprinting
- Scan w/ Custom YARA rules (incl. 447 rules by e.g. Chronicle and Elastic Security)
- Multi-Threaded scan w/ ClamAV for Windows
- Collection of infected files detected by ClamAV for further analysis (PW: infected)
- Collection of injected modules detected by MemProcFS PE_INJECT for further analysis (PW: infected)
- Extracting IPv4/IPv6
- IP2ASN Mapping and GeoIP w/ IPinfo CLI → Get your token for free at https://ipinfo.io/signup
- Checking for Suspicious Port Numbers
- Process Tree (TreeView) including complete Process Call Chain (Special thanks to Dominik Schmidt)
- Checking Processes for Unusual Parent-Child Relationships and Number of Instances
- Checking Processes for Unusual User Context
- Checking for Process Path Masquerading and Process Name Masquerading (Damerau Levenshtein Distance)
- Web Browser History (Google Chrome, Microsoft Edge and Firefox)
- Extracting Windows Event Log Files and processing w/ EvtxECmd → Timeline Explorer (EZTools by Eric Zimmerman)
- Event Log Overview
- Processing Windows Event Logs w/ Zircolite - A standalone SIGMA-based detection tool for EVTX
- Analyzing extracted Amcache.hve w/ Amcacheparser (EZTools by Eric Zimmerman)
- Analyzing Application Compatibility Cache aka ShimCache w/ AppCompatcacheParser (EZTools by Eric Zimmerman)
- Analyzing Syscache w/ RECmd (EZTools by Eric Zimmerman)
- Analyzing UserAssist Artifacts w/ RECmd (EZTools by Eric Zimmerman)
- Analyzing ShellBags Artifacts w/ RECmd (EZTools by Eric Zimmerman)
- Simple Prefetch View (based on Forensic Timeline)
- Analyzing Auto-Start Extensibility Points (ASEPs) w/ RECmd (EZTools by Eric Zimmerman)
- Analyzing RecentDocs, Office Trusted Document w/ RECmd (EZTools by Eric Zimmerman)
- Analyzing Registry w/ DFIR RECmd Batch File (DFIR Batch File by Andrew Rathbun)
- Analyzing Metadata of Recovered Process Modules (experimental)
- Extracting Windows Shortcut Files (LNK)
- Hunting Malicious Windows Shortcut Files (LNK)
- Integration of PowerShell module ImportExcel by Doug Finke
- CSV output data for analysis w/ Timeline Explorer (e.g. timeline-reverse.csv, findevil.csv, web.csv)
- Collecting Evidence Files (Secure Archive Container → PW: MemProcFS)
- and much more
Download
Download the latest version of MemProcFS-Analyzer from the Releases section.
Usage
Launch Windows PowerShell (or Windows PowerShell ISE or Visual Studio Code w/ PSVersion: 5.1) as Administrator and open/run MemProcFS-Analyzer.ps1.
File-Browser
Fig 1: Select your Memory Snapshot and select your pagefile.sys (Optional)
Auto-Install
Fig 2: MemProcFS-Analyzer auto-installs dependencies (First Run)
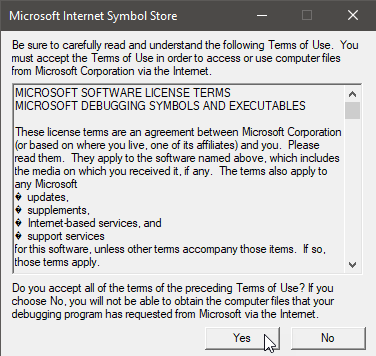
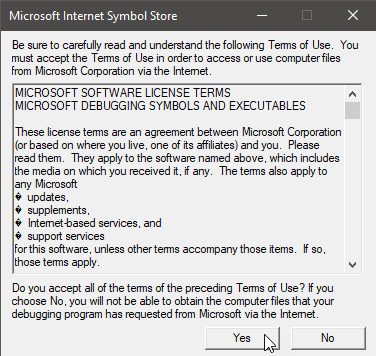
Fig 3: Accept Terms of Use (First Run)
MemProcFS
Fig 4: If you find MemProcFS useful, please become a sponsor at: https://github.com/sponsors/ufrisk
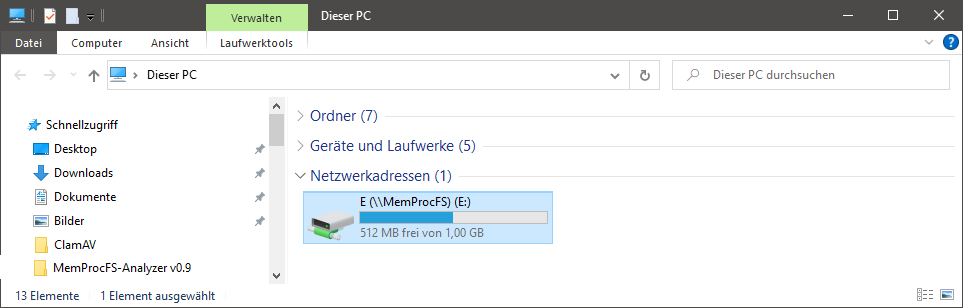
Fig 5: You can investigate the mounted memory dump by exploring drive letter
Auto-Update
Fig 6: MemProcFS-Analyzer checks for updates (Second Run)
Note: It's recommended to uncomment/disable the "Updater" function after installation. Check out the "Main" in the bottom of the script.
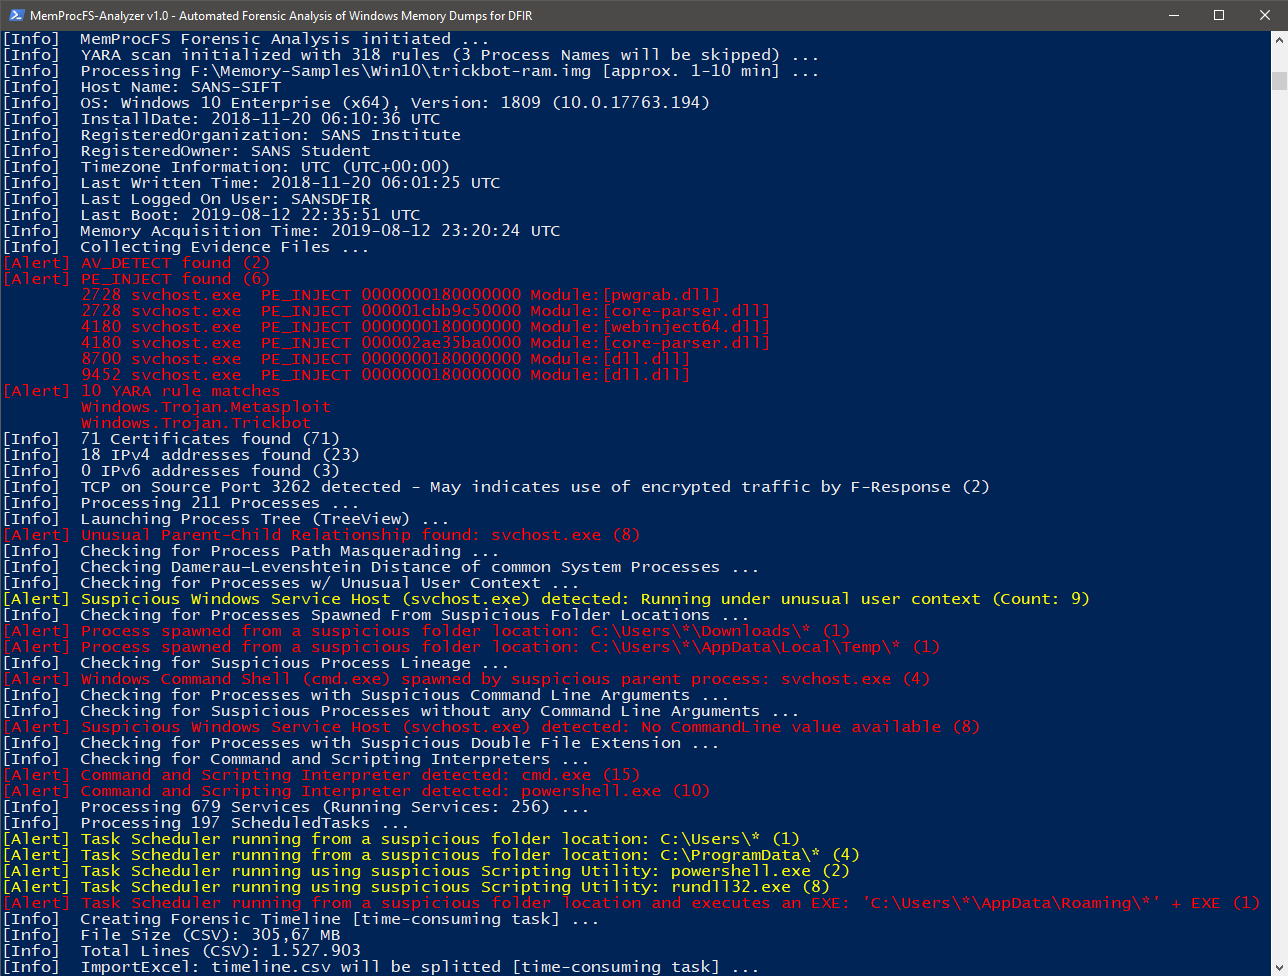
Fig 7: FindEvil feature and additional analytics
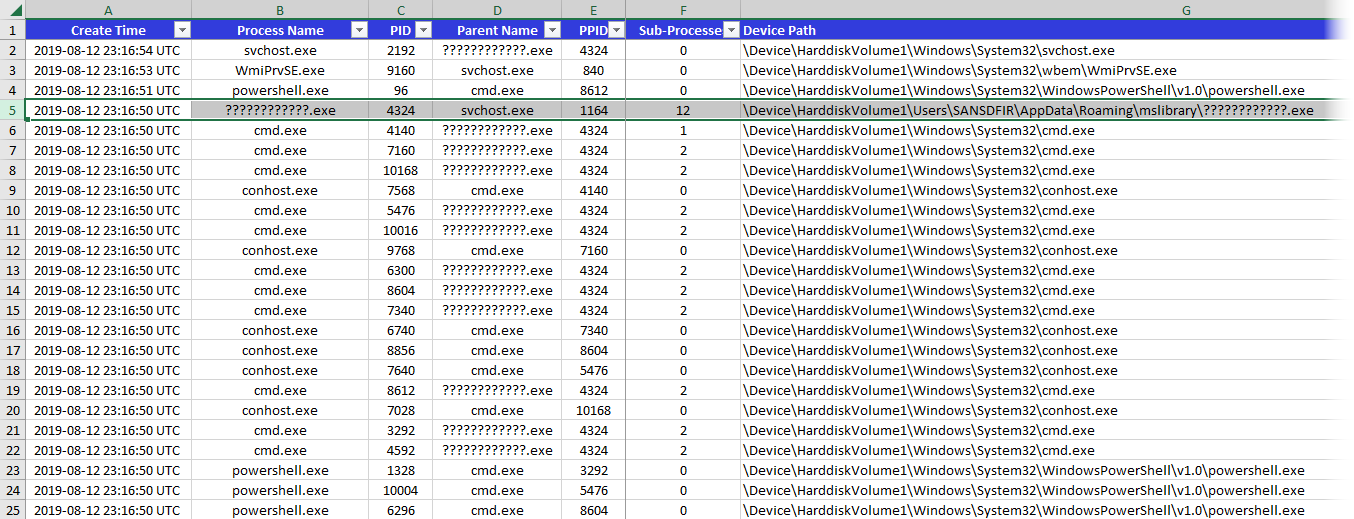
Fig 8: Processes
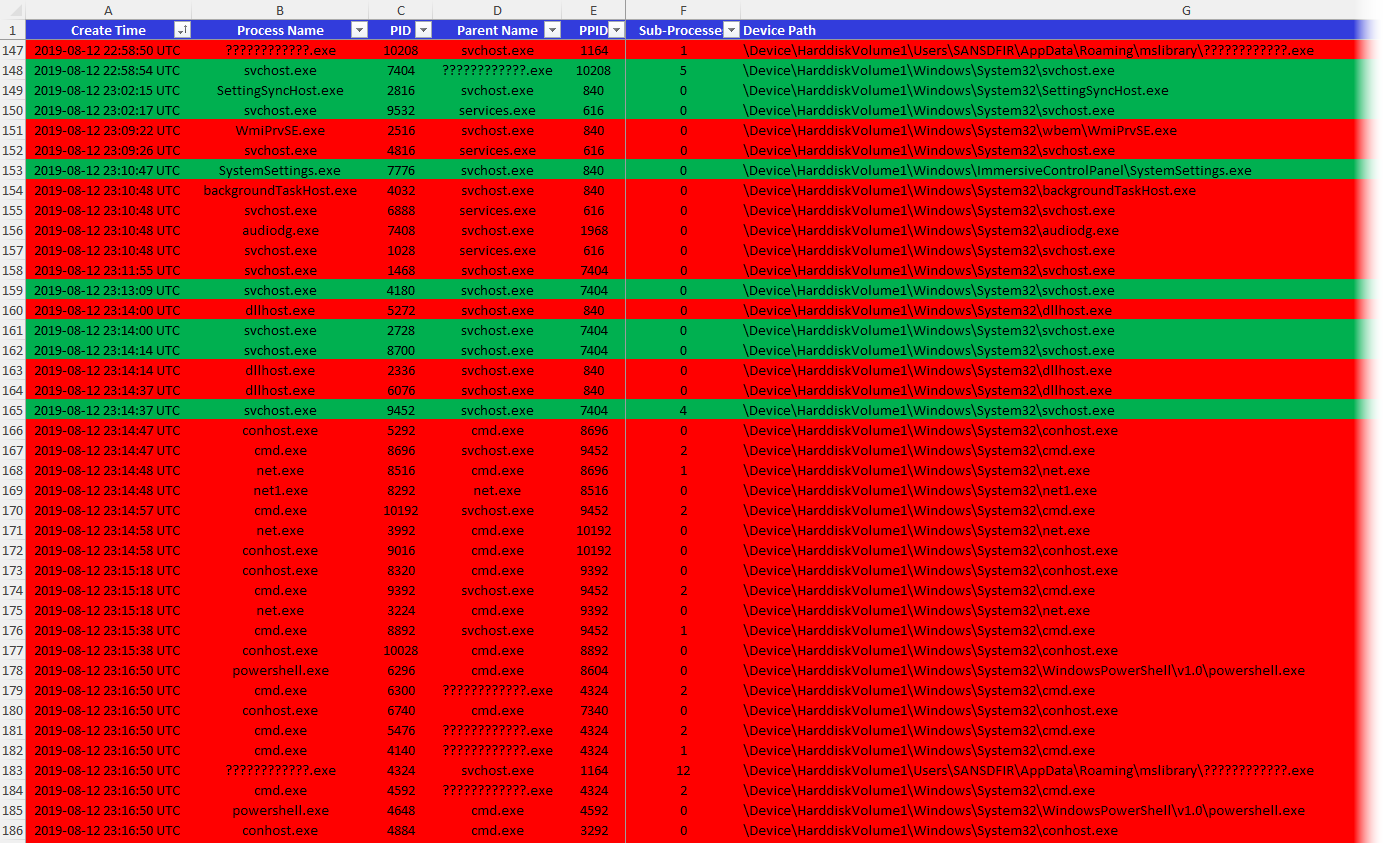
Fig 9: Running and Exited Processes
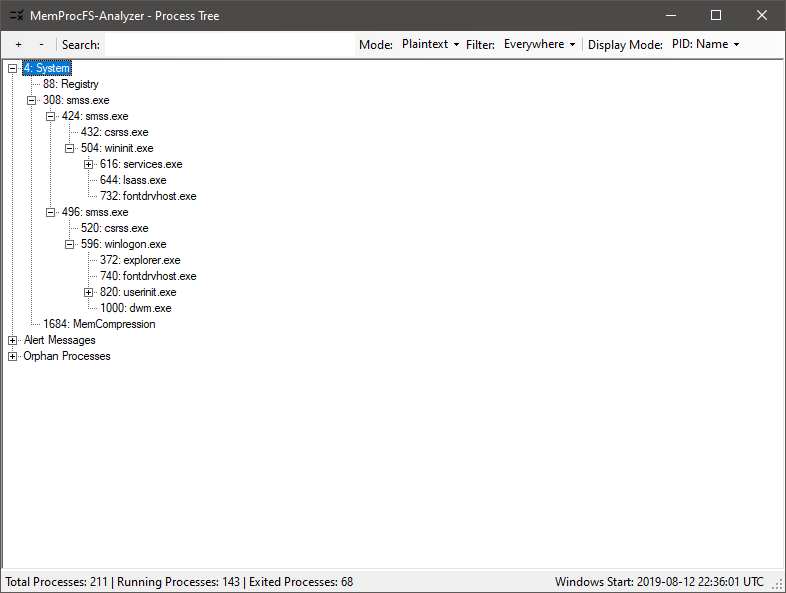
Fig 10: Process Tree (GUI)
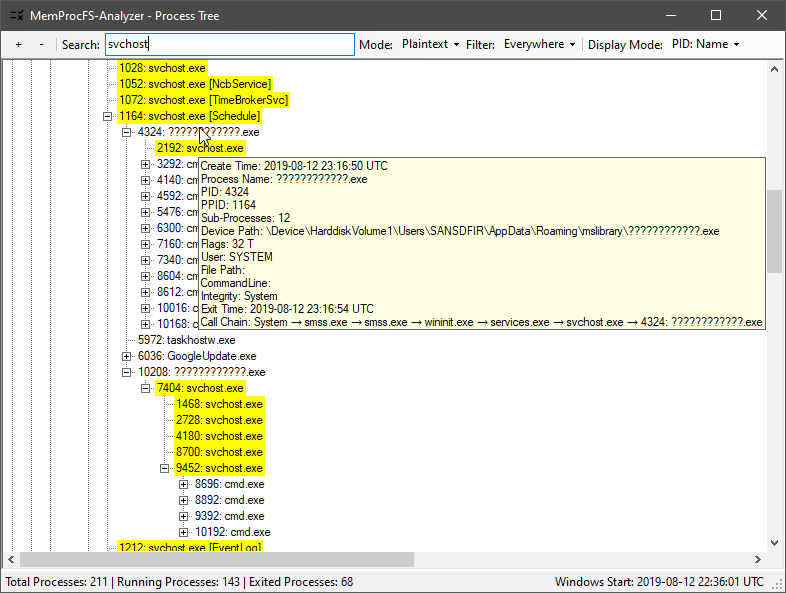
Fig 11: Checking Process Tree (to find anomalies)
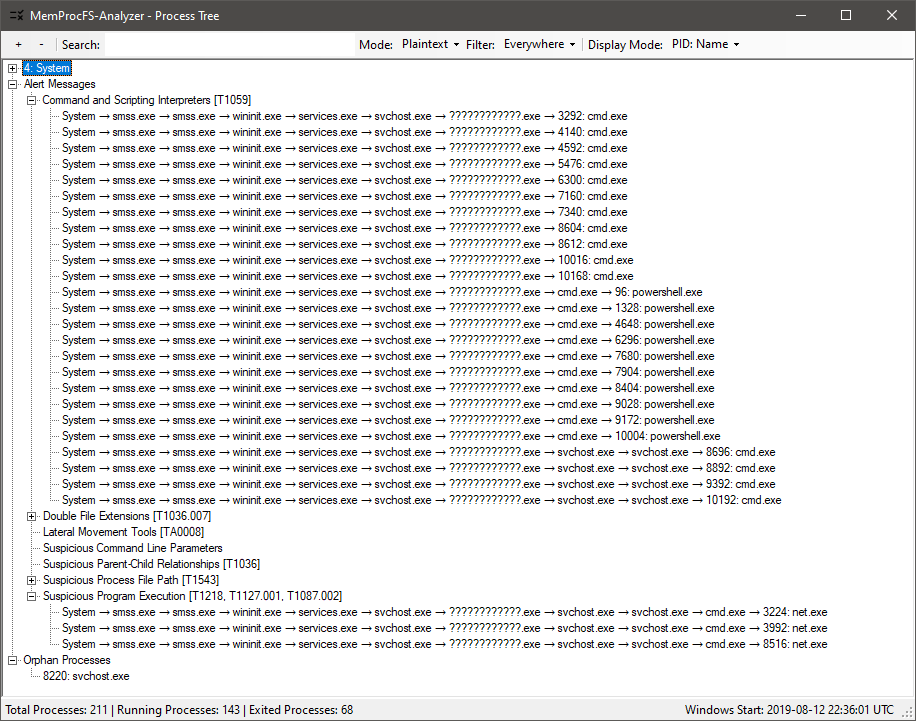
Fig 12: Process Tree: Alert Messages w/ Process Call Chain
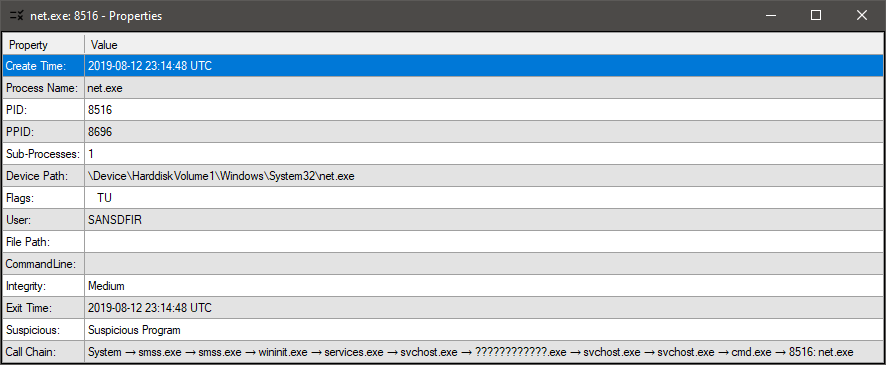
Fig 13: Process Tree: Properties View → Double-Click on a process or alert message
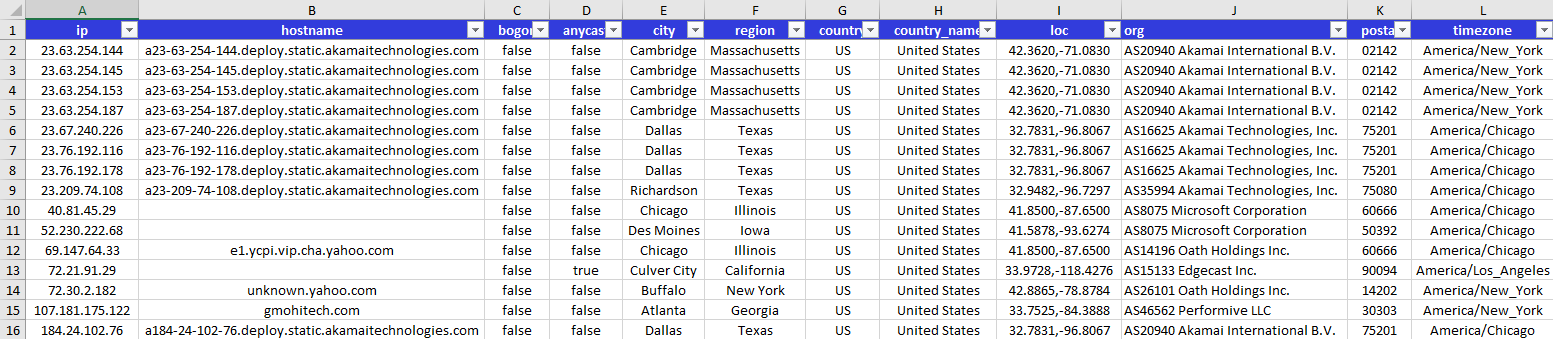
Fig 14: GeoIP w/ IPinfo.io