
 ignacioj/whacamole
Live memory analysis detecting malware IOCs in processes, modules, handles, tokens, threads, .NET assemblies, memory address space and environment variables. Dumps, detects and dissasemble hooks, shellcode, memory regions, modules and processes.

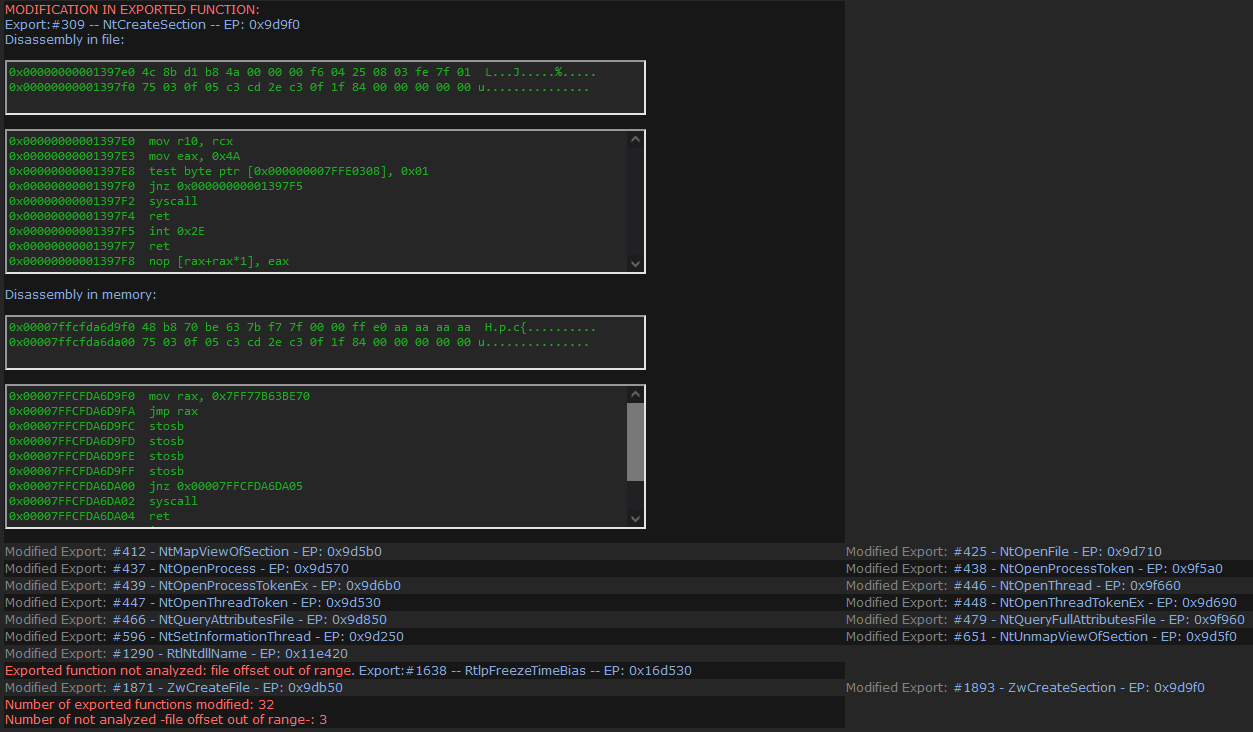
WhacAMole is a program that analyzes processes in memory in an integral way, detecting and alerting of anomalies related to malware and presenting and saving in files all the relevant information for verification, correlation or analysis, as well as dumping memory regions, processes and suspicious modules. To achieve this, it analyzes not only the anomalies of the memory regions of the processes and the modules they load, but it also analyzes in depth all the memory space in use by the process. At this moment, WhacAMole is capable of identifying 67 alerts related to malicious behavior or that can only be due to malware. It shows more than 70 properties of the processes, memory and modules, comparing many of their attributes read in memory with those that appear in the corresponding file on disk, partially disassembles suspicious memory regions and partially disassembles exported functions that have been modified in memory for analysts to conduct their own investigations.
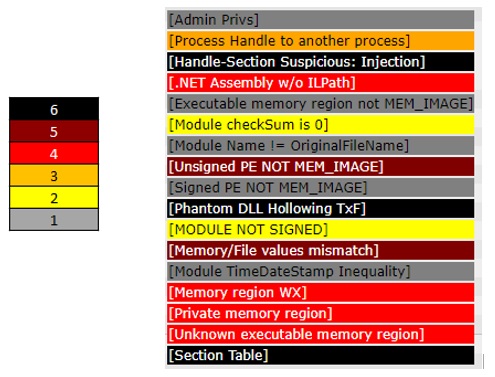
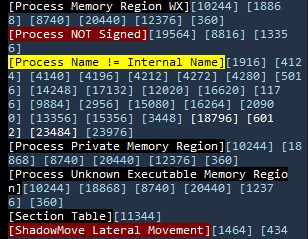
Unlike other similar programs, it makes all the relevant information on the processes available to analysts, labeling those characteristics that are related to malware with different alerts, so that they can carry out their own analysis or look for other signs of the existence of malicious processes. Alerts are classified, according to their danger and the number of processes in which the same behavior appears, according to a scale of six values, reflected in the html document with a color scale, with 6 (black color) being an indicator of the probability higher than that the detected characteristic is due to malware and 1 (gray color) that, although the behavior is abnormal, there are many system processes where the same behavior has been observed:
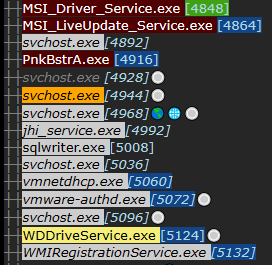
To facilitate the work of the analysts, the information is presented on screen, in an HTML file with a navigation panel of the processes analyzed and in csv text files. In the side panel of the html document, the process tree is shown, with the color corresponding to the highest alert detected in them, with the hyperlink to its location in the document, and with the blue color in its PID if it is a 32 bits process or green if it is a .NET process. Processes that have Control Flow Guard (CFG) enabled are shown in italics.
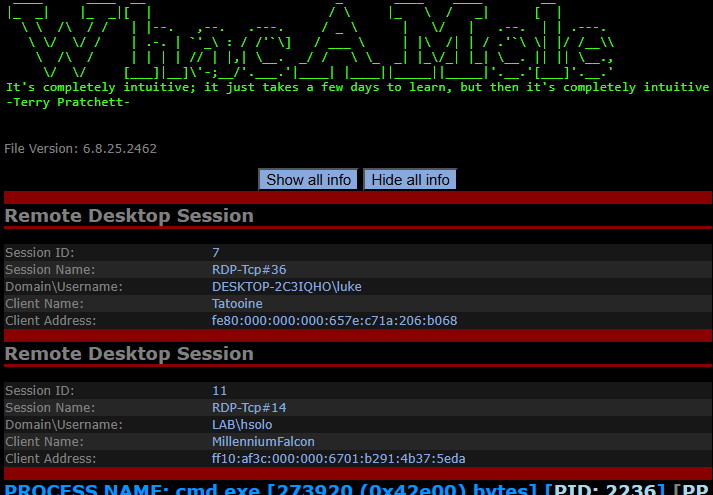
Information about remote RDP sessions is displayed at the beginning of the process information:
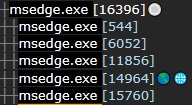
Networking capacity is displayed in two ways: if a TCP connection has been detected it is displayed with the Earth globe symbol, and if a connected socket has been detected, it is displayed with an empty globe symbol. Added symbol (white circle) for processes with http navigation libraries in memory: wininet.dll and winhttp.dll.
Network detail:

Connected socket:

There is a special symbol (a key) when Mimikatz-like activity is detected.

At the bottom of the navigation panel of the html document, all the alerts are shown, with their color, with the PIDs of the processes in which they have been detected in the form of a hyperlink to the position of the document where the process is shown.
If there are no processes detected with an alert, their name is displayed on a white background.
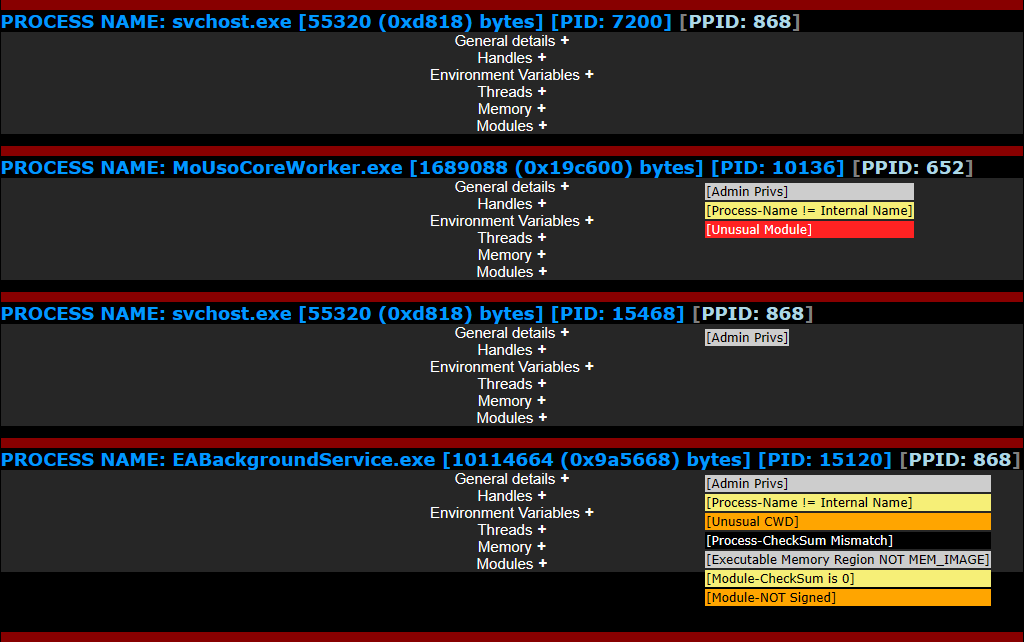
The main panel displays all processes with its information in collapsibles sections that by default are hidden. All the alerts are visible always.
Saved memory regions are xored with key 0x0E to prevent antivirus from deleting them.
Analyze, compare and present information from:
1. Processes:
• Warnings:
[Admin Privs]
[Alternate credentials]
[Alternate network credentials]
[Delphi 4 – Delphi 2006]
[Entry Point]
[LogonType]
[Managed code but no Assemblies detected - .NET ETW disabled]
[Mismatching Path]
[Name of the module hidden in memory]
[NTLM Authentication]
[PE anomalies]
[PEB ImageBaseAddress forgery]
[Possible .NET in memory loaded as Assembly.Load(byte[])]
[Process checkSum is 0]
[Process checkSum mismatch]
[Process Ghosting]
[Process Hollowing]
[Process Memory region hash mismatch]
[Process Memory region Protection value modified]
[Process Memory region WX]
