
Incident Response Forensic Framework
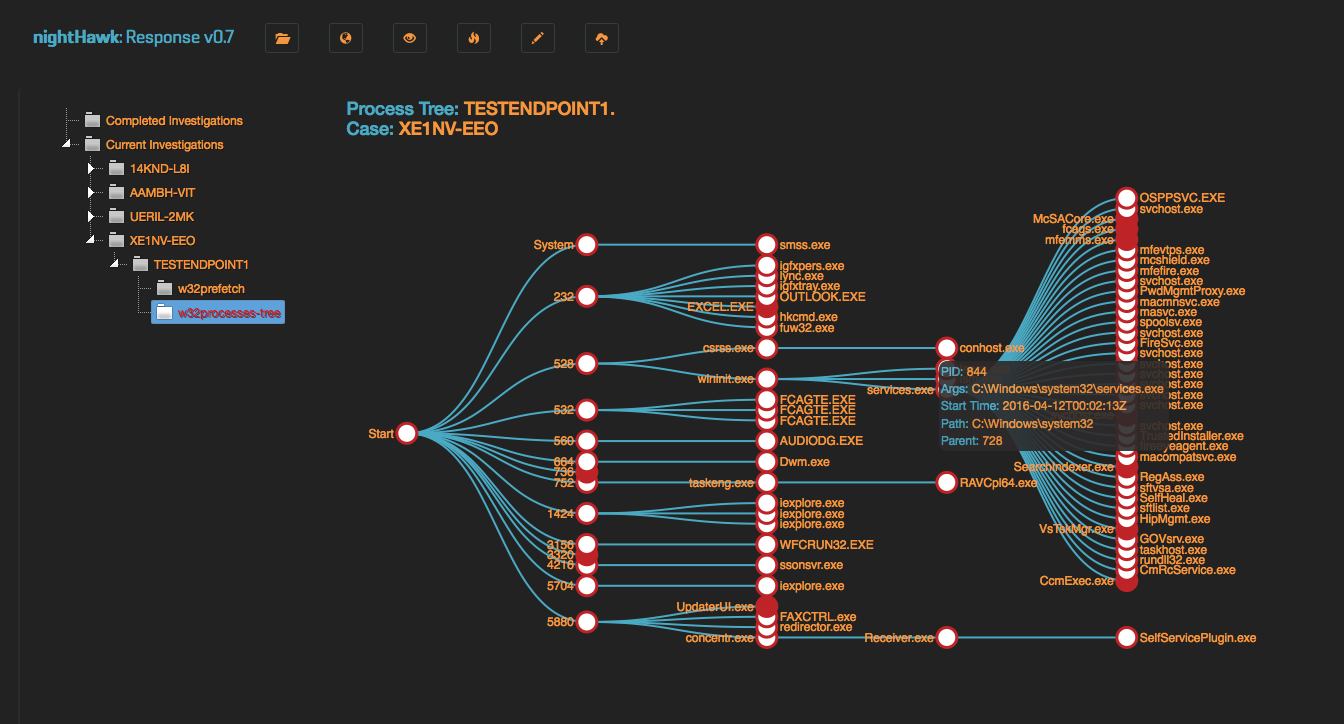
Custom built application for asynchronus forensic data presentation on an Elasticsearch backend.
This application is designed to ingest a Mandiant Redline "collections" file and give flexibility in search/stack and tagging.
The application was born out of the inability to control multiple investigations (or hundreds of endpoints) in a single pane of glass.
To ingest redline audits, we created nightHawkResponse, a fully fledge GOpher application designed to accompany this framework. The source code to the application is available in this repo, a binary has been compiled and is running inside the iso ready to ingest from first boot.
We are currently developing a new major version and will be releasing this by March 2020. The new version aims to accomplish the following.
We realised that there were too many moving parts to effectively operate the entire repo, easily manage entities and keep everything up to date. We also belive that the core data that resides in Elastic should be used more effectively by Kibana and so we decided to make this a reality by developing a plugin that does this along side of Kibana's amazing workflow.
Installation
API documentation to follow in Wiki
01/09/2016: Version 1.0.3
Features:
Video Demonstration: nightHawk Response Platform
To make it straight forward for users of nightHawk, we built an ISO with everything setup ready to go. That means you get the following;
/opt/nighthawk/etc/nightHawk.json file. Starting the system:
Before building your VM with the supplied ISO, take into consideration the following;
Pending: Setup the Elastic service to be dual nodes with 1/4 of the allocated system memory per node. This means if you give it 2GB RAM, each ES node will be 512mb and the system will remain with 1GB to operate.
If you want to set this any different way, ssh into the box and configure your desired way.
A minimum of 20GB should be considered. An audit file can be large and therefore its advised you allocate a lot of storage to handle ingesting many collections.
Pending: User based storage setup for large scale instances. If you desire to setup extra partitions, you can do this yourself, a few changes can be made to point the ES data storage to your new partition.
Installation:
Download ISO: nightHawk v1.0.3
Configure the hardware, mount the ISO into the VM, start the installtion script.
Once complete, in your browser (Chrome/FireFox), goto; https://192.168.42.173.
Log into the system with 'nighthawk/nighthawk' - click "goto site" to get into application
If you need to access Kibana, goto; https://192.168.42.173:8443.
If you need to SSH into the box, the login details are; admin/nightHawk.
If you want to change the IP address (reflected application wide); /opt/nighthawk/bin/nighthawkctl set-ip <new_ipaddress>
Redline Audit Collection Script can be found in the root of this repo. Use this when using the standalone redline collector as this will return the documents you need to populate nightHawk correctly.
Uploading:
IMPORTANT:
Creating audit zip file to upload (Redline stand alone collector):
step_1: Navigate to Sessions\AnalysisSessionX\Audits<ComputerName> where X is analysis number which is 1 for most cases.
step_2: Create zip of folder containing audit files i.e. 20160708085733
step_3: Upload 20160708085733.zip
IMPORTANT: Use exisiting HX audit file (HX collector): FireEye HX audits are an extension ending in .mans. The audit from HX differs from the Redline collector because the .mans that it returns is actually a zip file. This means it can be uploaded directly unlike the Redline audit which you need to follow the instructions above.
Navigate to the "Upload" icon on the nav bar, select an audit .zip (or multiple), a case name (otherwise the system will supply you with one) and submit. If you have used our Redline audit script to build your collection, follow the "Redline Collector" instructions just above.
Once processed, the endpoint will appear in the "Current Investigations" tree node. Under the endpoint you will be presented with all audit types available for that endpoint. The upload feature of this web app spawns pOpen subprocesss that calls the GO application to parse the redline audit and push data into Elasticsearch. There are 2 options for uploading, one is sequential, the other is concurrent.
Please Note: Concurrent uploads are limited to 5 at a time and can be resource intensive, if you have an underpowered machine then restrict usage of this feature to 2-3.
Tagging:

