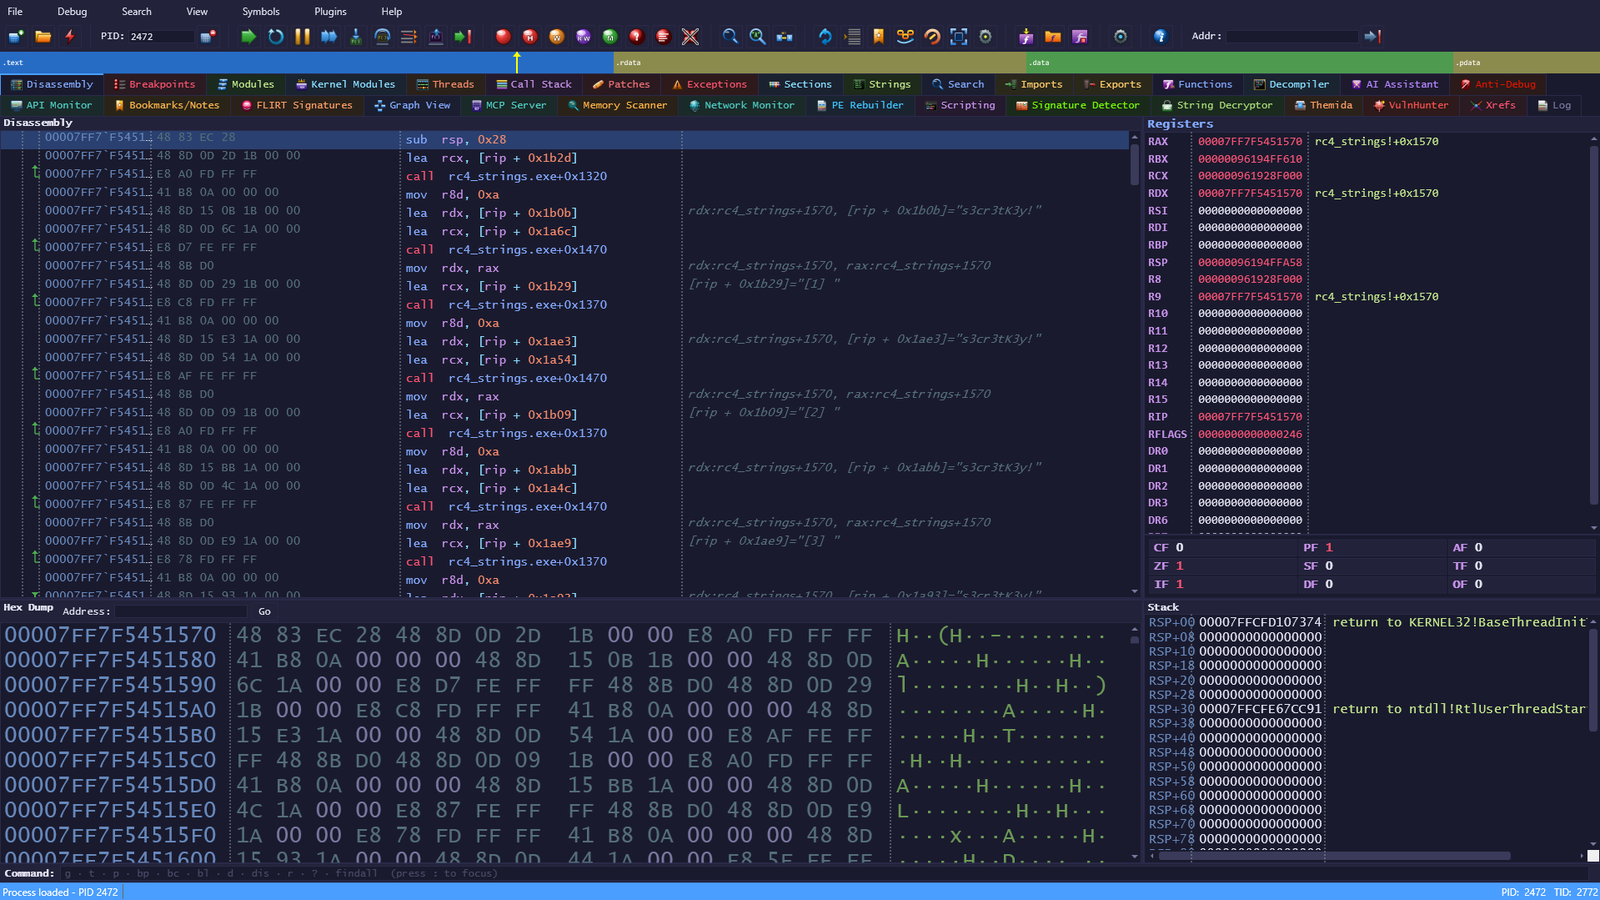
akatorich/kernelflirt
Windows kernel-level debugger with OllyDbg/IDA-style UI, software and hardware breakpoints, PDB symbols, decompiler, and 17 plugins for reverse engineering and malware analysis in VMs.
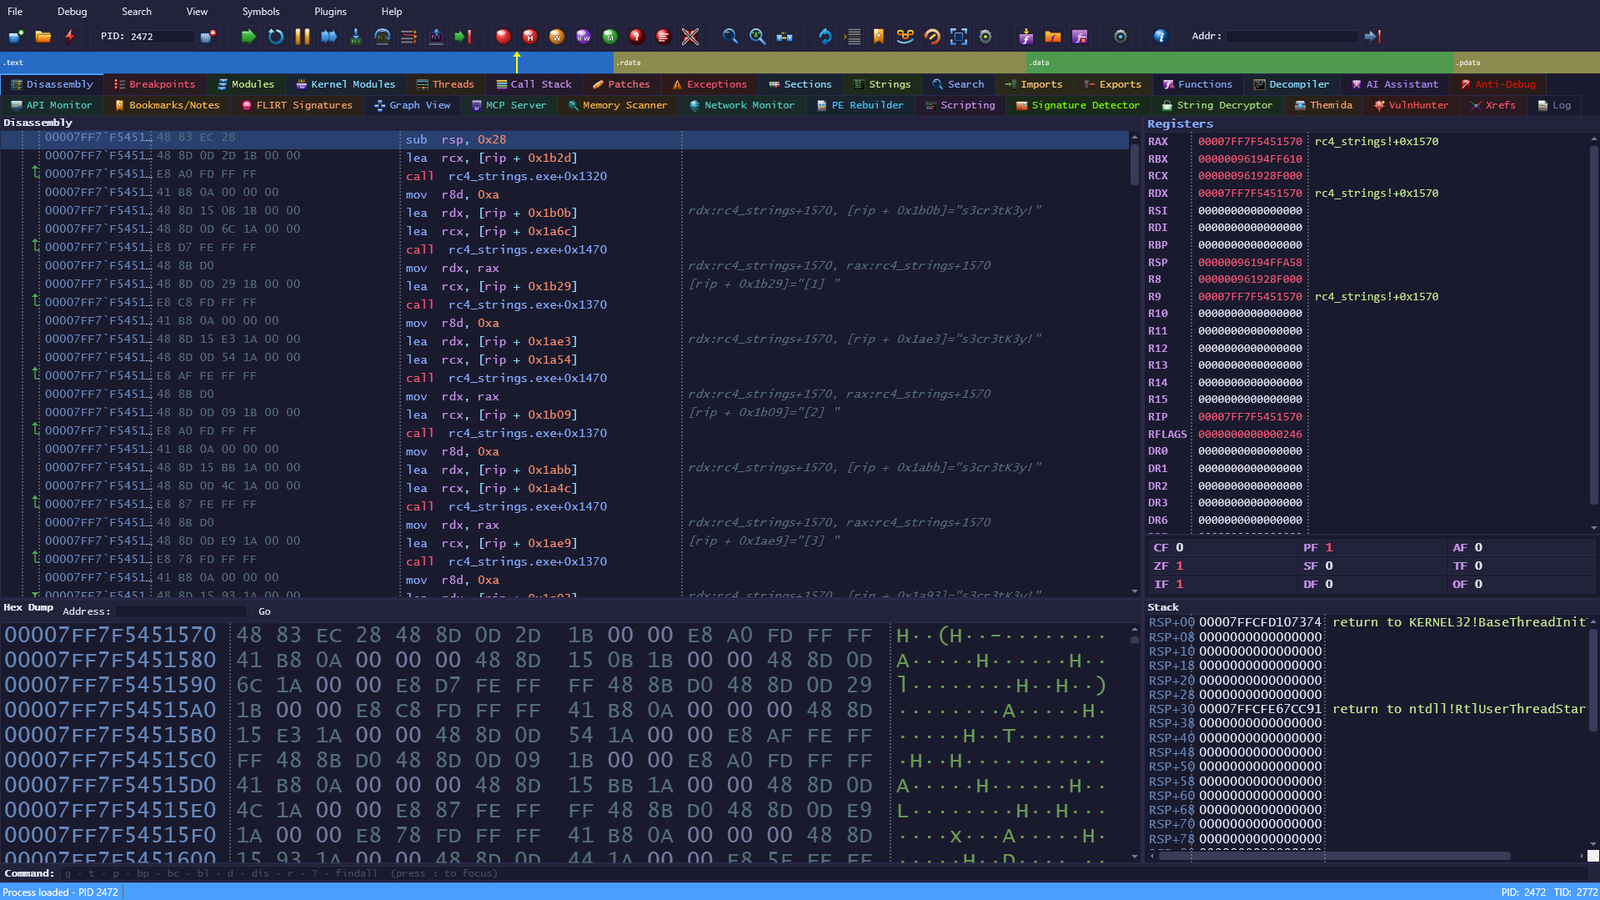
Windows kernel-level debugger with an OllyDbg/IDA Pro-style interface. Designed for security research, reverse engineering, and malware analysis in VM environments (VMware).
  Host machine                           VM (Windows 10, testsigning)
┌──────────────────┐    TCP:31337    ┌──────────────────┐     IOCTL      ┌──────────────────┐
│  KernelFlirt UI  │◄───────────────►│   KfRelay.exe    │◄──────────────►│ KernelFlirt.sys  │
│  (WPF / .NET 9)  │  CMD+DBG ch.    │   (TCP proxy)    │  DeviceIoCtl   │ (WDM Driver)     │
└──────────────────┘                 └──────────────────┘                └──────────────────┘
                                     ┌──────────────────┐  SCM API
                                     │  KfLoader.exe    │──────────────────────┘
                                     │  (C / Console)   │  load / unload / status
                                     └──────────────────┘
| Component | Language | Description |
|---|---|---|
| KernelFlirt.UI | C# / WPF | Debugger interface (runs on host) |
| KernelFlirt.sys | C / WDM | Kernel driver — memory, breakpoints, KdTrap inline hook |
| KfRelay.exe | C | TCP relay on VM, proxies IOCTLs over network |
| KfLoader.exe | C | CLI to load/unload the driver via SCM |
| KfConsole.exe | C# / .NET 9 | Console debugger — WinDbg/x64dbg-style REPL over the same driver |
| KernelFlirt.SDK | C# / .NET 9 | Plugin SDK — full debugger API for extensions |
:: VM — load driver and start relay
KfLoader.exe load
KfRelay.exe

:: Host — launch the UI and connect
KernelFlirt.exe → Connect → VM IP
Kernel driver debugging: open Kernel Modules tab, find your driver, set breakpoints on any function — user-mode and kernel-mode.
Don't need the WPF UI? KfConsole.exe (in bin\Console\) is a WinDbg/x64dbg-style REPL
over the same driver and relay.
kf> connect 10.100.102.6:31337
✓ connected (10.100.102.6:31337), driver v0x10000

kf*> open C:\Temp\target.exe
✓ created PID=8424 TID=10136 ImageBase=00007FF7`2EA10000 (x64)
symbols: 3/4 modules loaded

kf(8424:10136/x64/brk)> bp ntdll!NtCreateFile if rcx!=0
✓ bp [1] 00007FFF`BBF8E030  ntdll!NtCreateFile  if rcx!=0

kf(8424:10136/x64/brk)> g
*** BP at 00007FFF`BBF8E030  ntdll!NtCreateFile

kf(8424:10136/x64/brk)> u rip 5
►  00007FFF`BBF8E030  4c 8b d1  mov r10, rcx  ntdll!NtCreateFile
Highlights: x64 + WoW64 (x86) targets, PDB symbol resolution via Microsoft Symbol Server,
expression evaluator (rsp+8, [rsp], module!func), conditional breakpoints,
Step Into / Step Over / Step Out, anti-debug primitives, ANSI-colored output,
readline with persistent history.
Full command reference: docs/cli.md
?? wildcards)RegisterFunction9 built-in themes (default-dark, x64dbg, monokai, ollydbg, ollydbg-light, ida-pro, dracula, long_night, sakura) with runtime switching and 100+ customizable color keys.
| Plugin | Description |
|---|---|
| Graph View | IDA-style CFG with block coloring, collapse/expand, function navigation |
| Xrefs | Cross-references — find all callers/references to any address |
| FLIRT Signatures | Function recognition by byte patterns (.pat + built-in MSVC CRT) |
| Signature Detector | PEiD-compatible packer/compiler detection (4445 signatures) |
| PE Rebuilder | PE dumper with IAT reconstruction (Scylla-style) |
| String Decryptor | Automated string decryption |
| VulnHunter | Dangerous API usage scanner |
| Plugin | Description |
|---|---|
| API Monitor | Real-time API interception with parameter logging |
| Network Monitor | Network traffic capture (send/recv/connect) with CSV export |
| Memory Scanner | Value scanning with subsequent filtering |
| Themida Unpacker | Automated Themida/WinLicense unpacker |
| Plugin | Description |
|---|---|
| C# Scripting | Roslyn REPL with full debugger API, syntax highlighting, persistent state |
| AI Assistant | Reverse engineering assistant (OpenAI-compatible) with 65+ debugger tools |
| MCP Server | Model Context Protocol — connect AI clients (Claude Code, Cursor) to debugger |
| Session Manager | Save/load session (breakpoints, comments, function names) with ASLR rebase |
| Bookmarks/Notes | Address bookmarks with annotations, persisted between sessions |
| Anti-Debug Bypass | Automatic PEB/DebugPort/ThreadHide/HeapFlags patching |
All plugins share a common SDK with access to memory, breakpoints, symbols, UI, events, execution control, and cross-plugin communication.
| Key | Action |
|---|---|
| F2 | Toggle breakpoint |
| F4 | Run to cursor |
| F5 / F9 | Continue / Run |
| F7 | Step into |
| F8 | Step over |
| Ctrl+F9 | Step out |
| F12 | Pause |
| Space | Inline assembler |
| Ctrl+G | Go to address |
| Ctrl+F | Binary search |
| F11 | Fullscreen |
| Shift+F5 | Run script |
| Document | EN | RU |
|---|---|---|
| SDK & Plugin Development | SDK-en.md | SDK-ru.md |
| C# Scripting Reference | scripting-reference-en.md | scripting-reference-ru.md |
| CLI (KfConsole) | cli.md | — |
| Changelog | CHANGELOG.md |
Complete guide to building KernelFlirt plugins: project setup, all API interfaces with full parameter descriptions, data models, UI development (WPF/theming), events, threading, cross-plugin communication, persistence, anti-debug API, 4 complete example plugins, best practices.
C# REPL scripting guide: all shortcuts and API methods with parameters, 12 data models, 18+ real-world recipes (PE analysis, string decryption, IAT reconstruction, unpacker scripting, memory scanning, API tracing), tips & pitfalls.
Requirements: Visual Studio 2022 (C++), WDK 10.0.26100.0+, .NET 9 SDK, Windows 10/11 x64