
scanopy v0.17.22
Network diagrams that update themselves
Scanopy

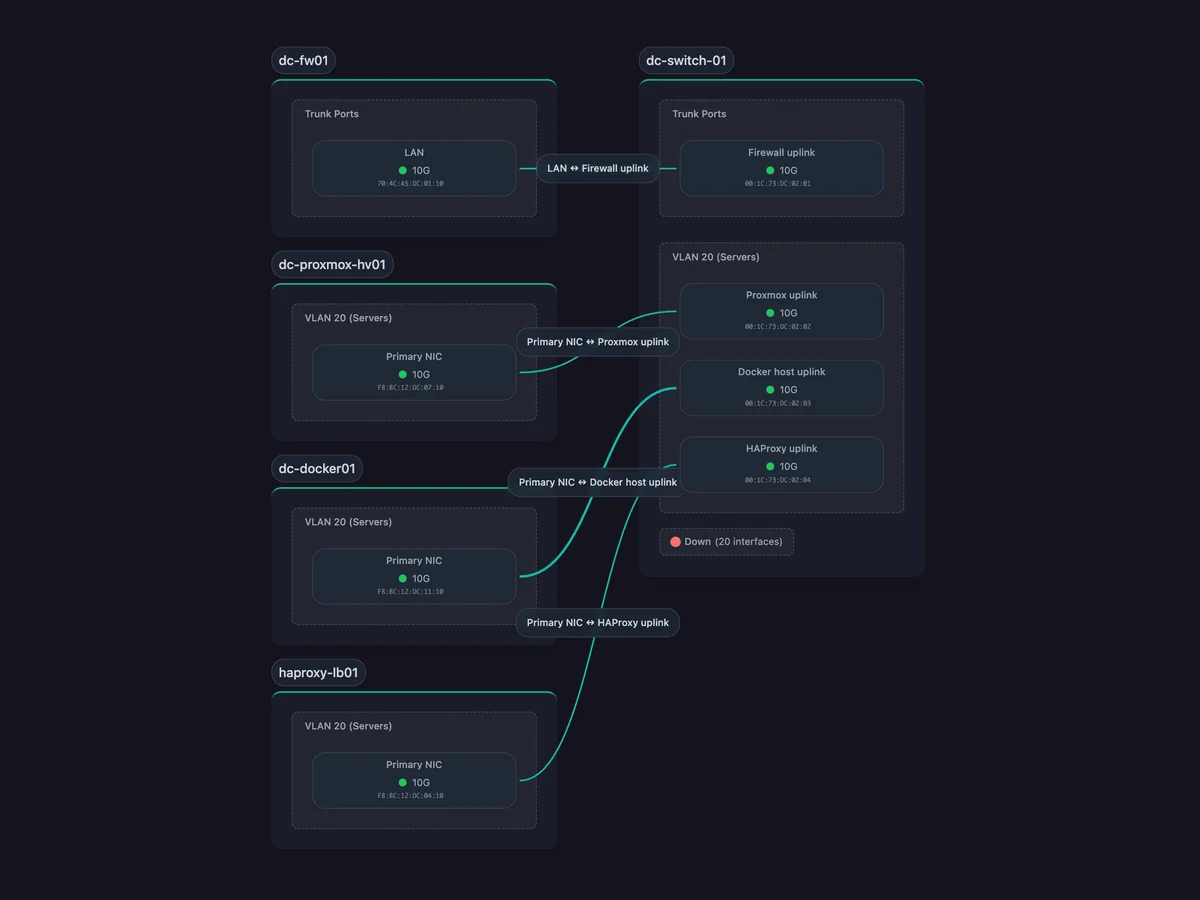
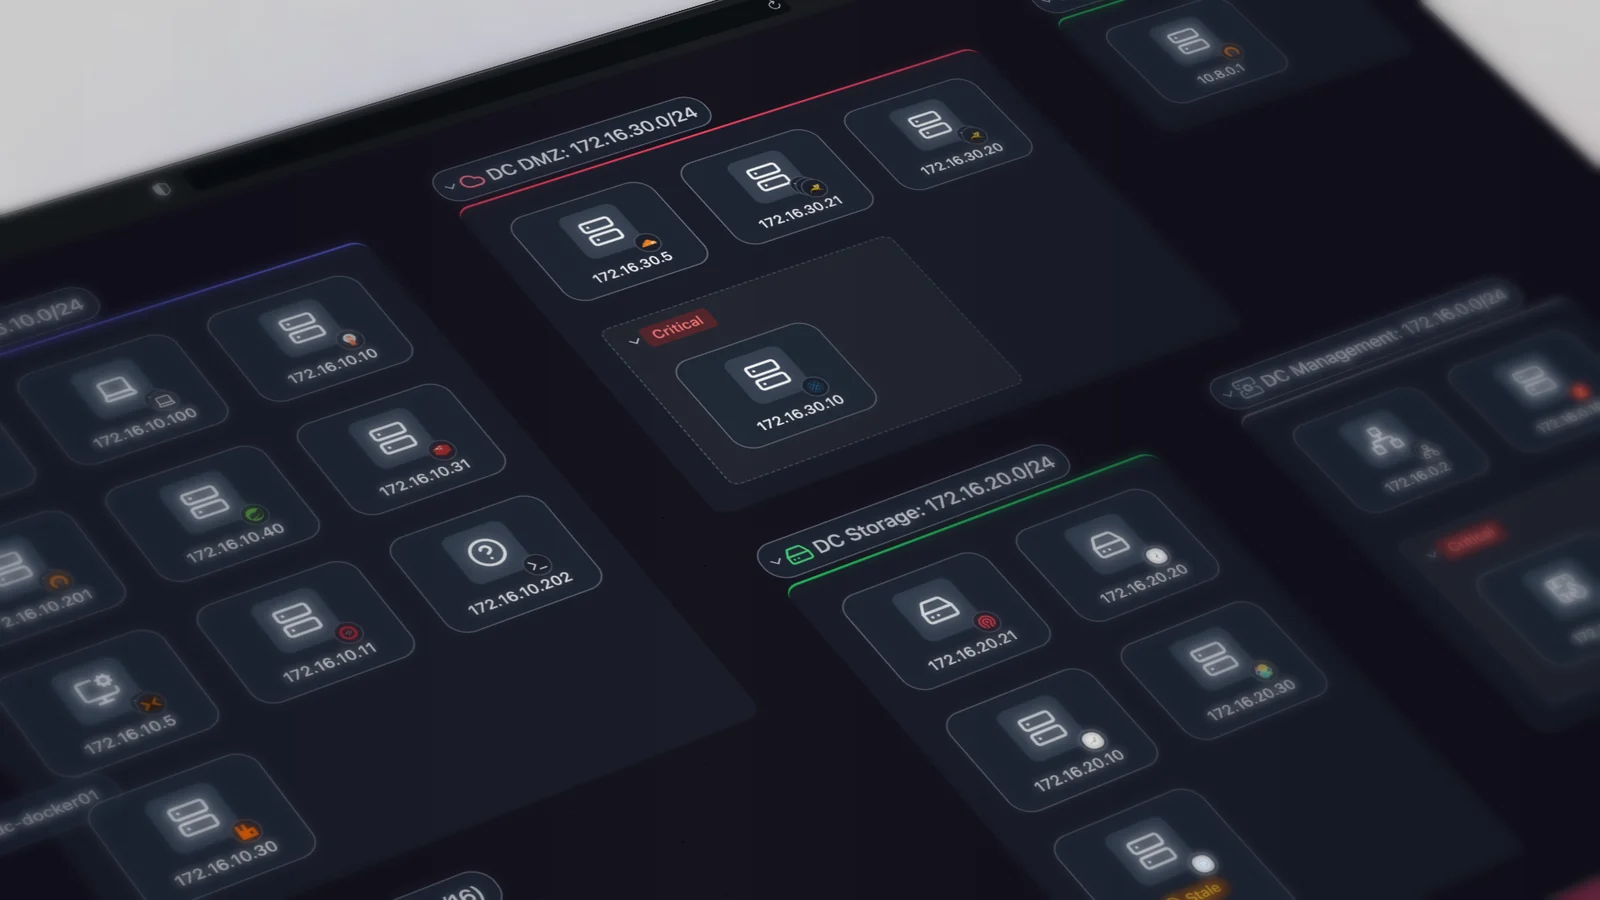
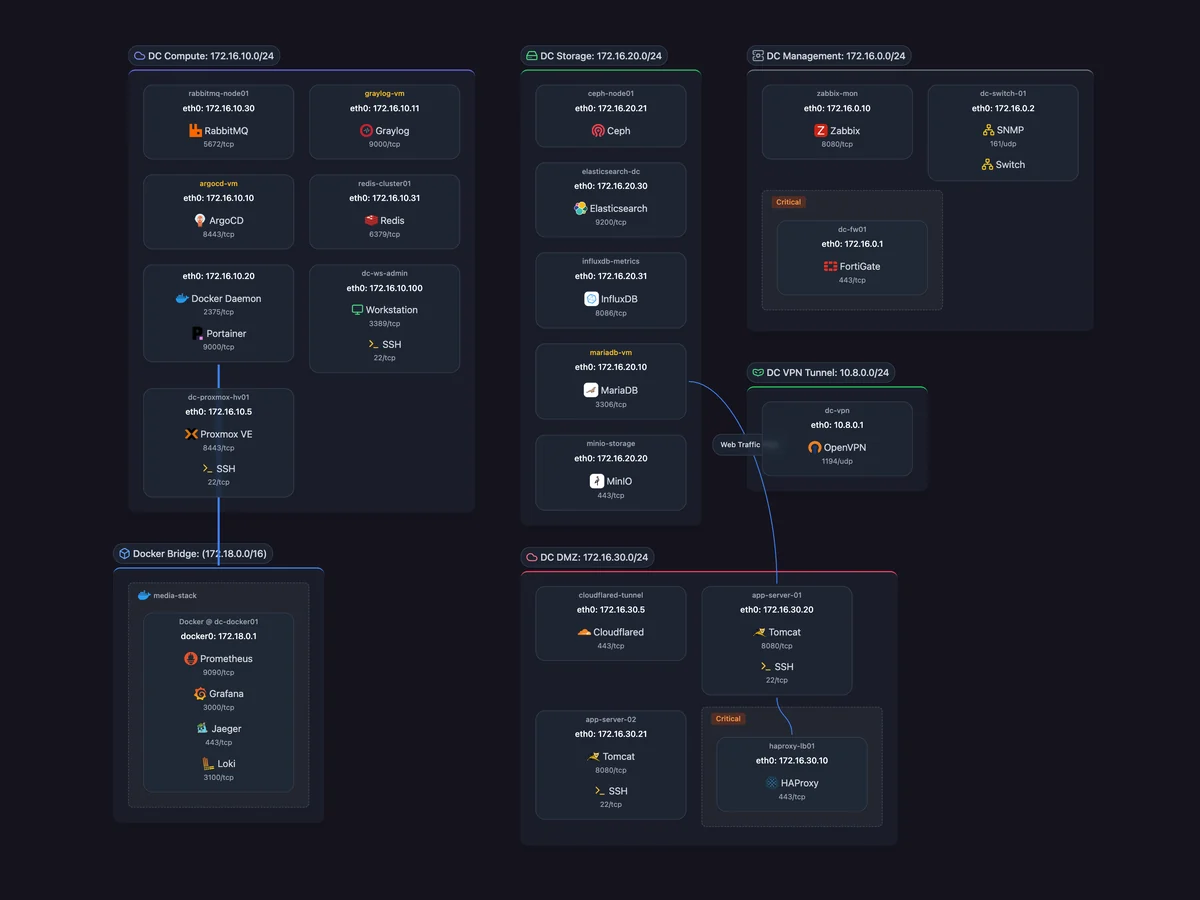
Never maintain another network diagram. Scanopy scans your network on a schedule and draws it as four views: L2, L3, workloads and applications.
curl -O https://raw.githubusercontent.com/scanopy/scanopy/refs/heads/main/docker-compose.yml
docker compose up -d
Open http://<your-server-ip>:60072 and create your account. The first discovery starts on its own.
Prefer a hosted version? Try Scanopy Cloud. Full setup options are in the docs.


Scanopy replaces manual network diagrams with a continuously maintained model of what's actually running. A single daemon scans on a schedule and produces four views from each scan: L2 (physical), L3 (logical), workloads, and applications. Unlike diagrams drawn in draw.io that go stale the week they're saved, or IaC state that misses drift and resources provisioned outside the pipeline, Scanopy reflects the current state of your infrastructure. Export as SVG, Mermaid, or Confluence; embed live maps; or feed the model into your existing source of truth.
🏢 Running Scanopy for your business? The Commercial Edition adds a commercial license, more networks and seats, Confluence export, and support, all on your own infrastructure.
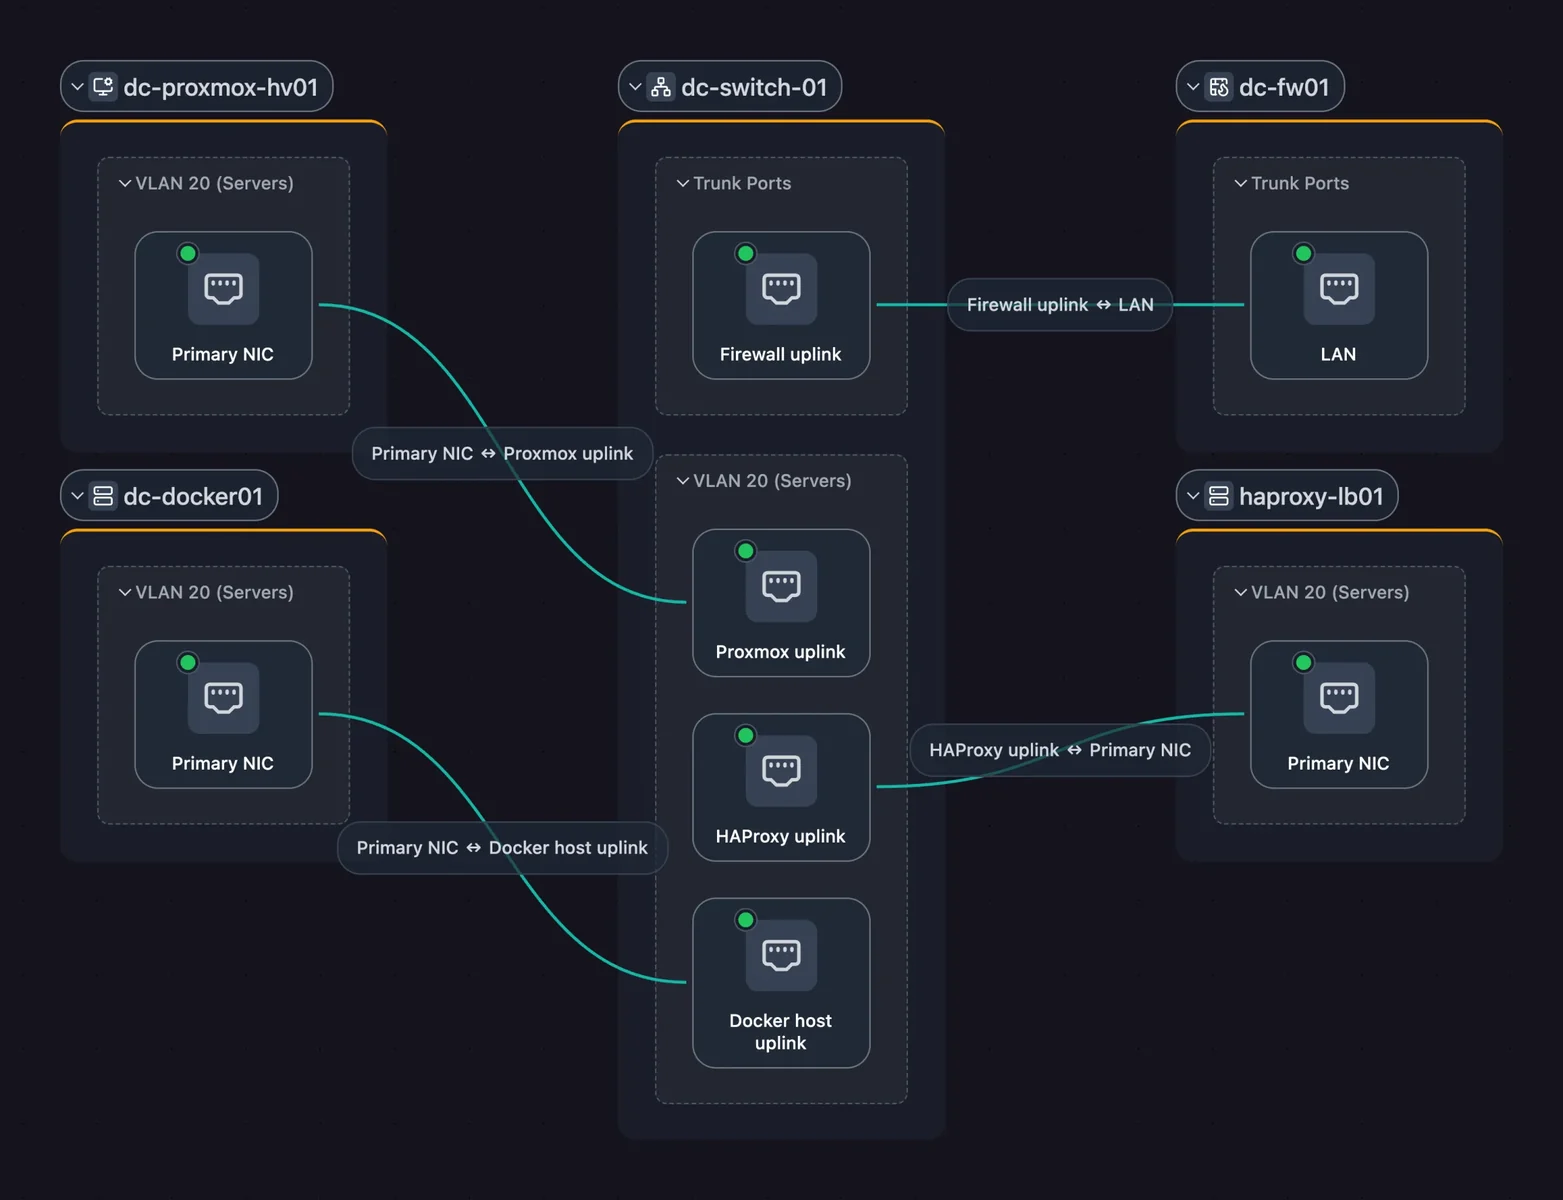
L2 (Physical) |
L3 (Logical) |
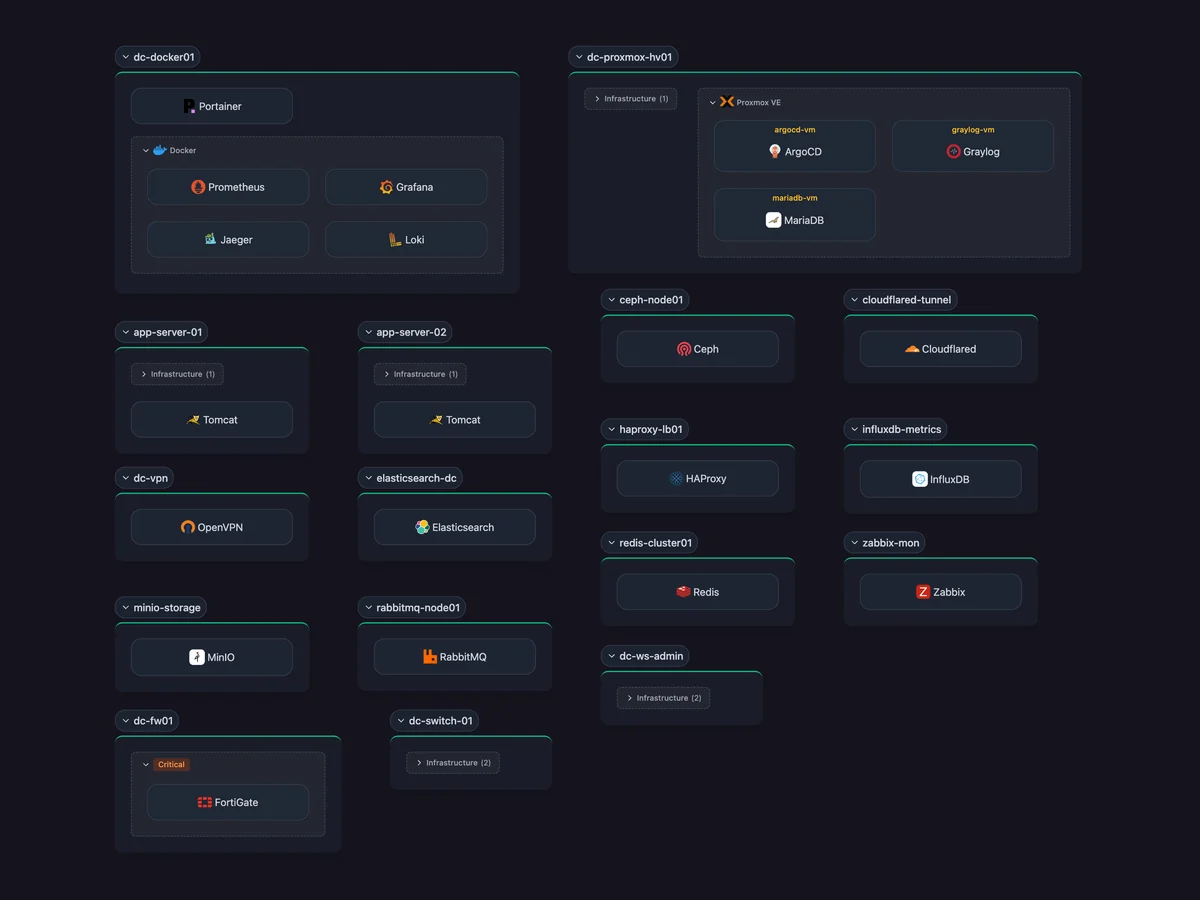
Workloads |
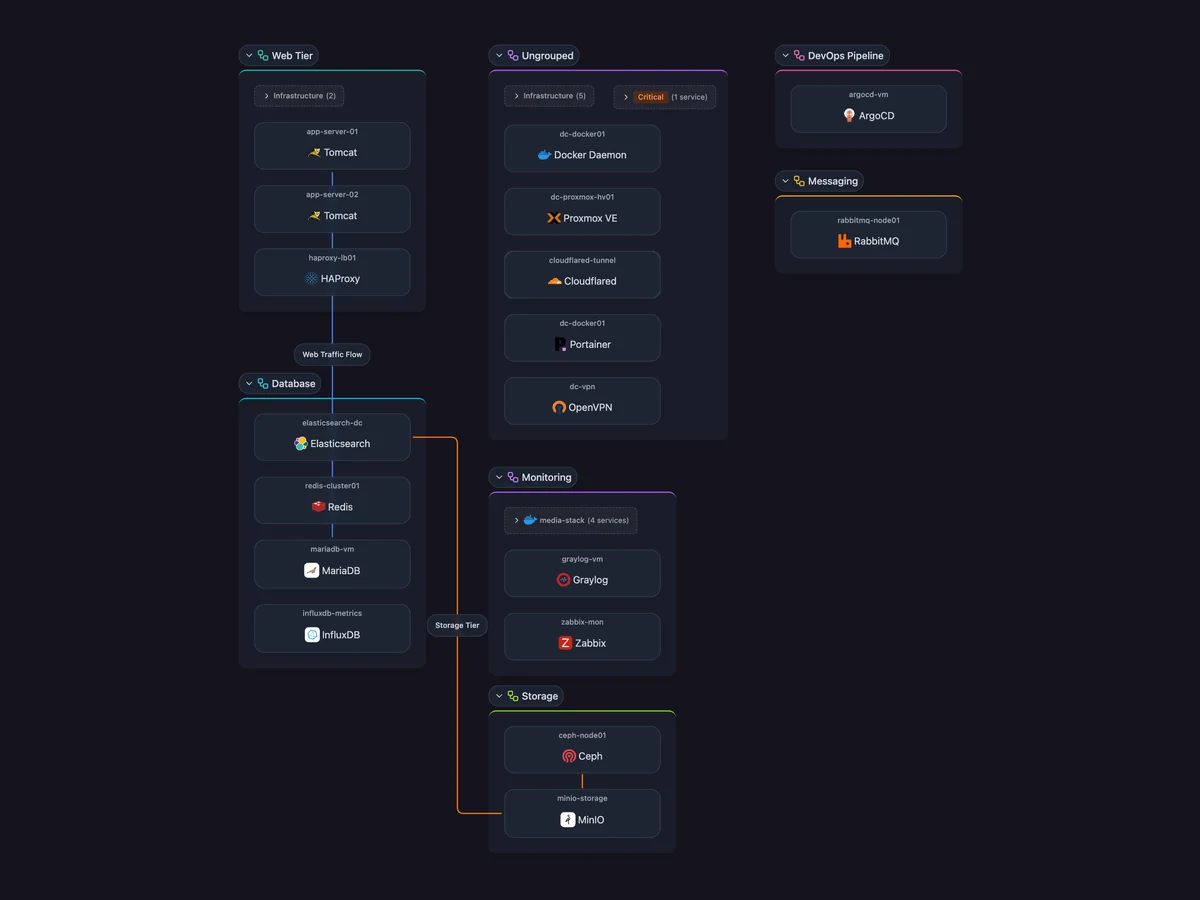
Applications |
✨ Features
Map
- Network topology: Physical (L2) links port to port from LLDP, CDP, and switch forwarding tables, and logical (L3) topology subnet by subnet.
- Workload mapping: VMs nested in their hypervisor, and containers inside the host that runs them.
- Application dependency mapping: Tag each server with its application once and the map fills in its services. You mark the dependencies between them.
Inventory
- Device inventory: Every host with its IP and MAC addresses, interfaces, open ports, services, and SNMP hardware facts. Search everything with
/, filter by site or tag, and export to CSV or read it through the REST API. - 300+ service definitions: Identifies databases, web servers, printers, cameras, and industrial devices (Modbus TCP, EtherNet/IP, OPC UA, BACnet) by open ports, service responses, and MAC vendor.
- VLANs & subnets: Reads VLAN tables from your switches over SNMP, shows native and tagged VLANs per port, and links each VLAN to its subnets.
Track & share
- Scan digests and snapshots: An email after each scheduled scan lists new, stale, and changed hosts. Snapshots record the network on a date for audits and change windows.
- Sharing, embeds & exports: Read-only links with a password and expiry, live embeds in a wiki, and exports to image, document, diagram, and wiki formats.
Discovery
- No agent per device: A daemon on Linux, macOS, Windows, or Docker scans the networks it can reach. Deploy as many as your segments need, each on its own schedule, at the rate and subnet scope you set.
- Integrations: Docker, Aruba Instant On, Podman, Proxmox VE, UniFi Controller, Wake-on-LAN, SNMP, SSH, and gNMI.
- Multi-user + RBAC: Admin, member, and viewer roles, scoped per site.
🎯 Built for teams that manage infrastructure
- IT operations: Network architecture and physical topology, current after every scan, across every site.
- MSPs: Per-client documentation with read-only portals. No logins required.
- Security & compliance: Segmentation validation and audit-ready documentation for NIS2, ISO 27001, HIPAA, and CMMC.
- Platform & DevOps: Service dependencies and workload placement without APM instrumentation.