 ayoubfaouzi/al-khaser
Öffentlich bekannte Malware-Techniken, die in freier Wildbahn verwendet werden: Virtuelle Maschine, Emulation, Debugger, Sandbox-Erkennung.


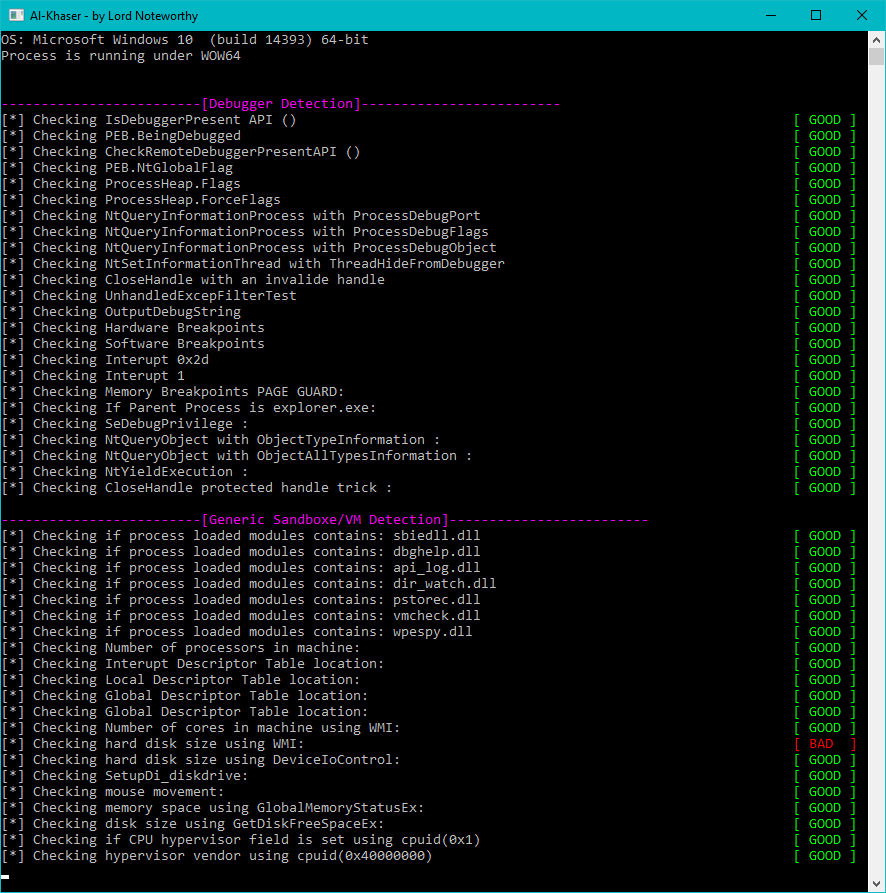
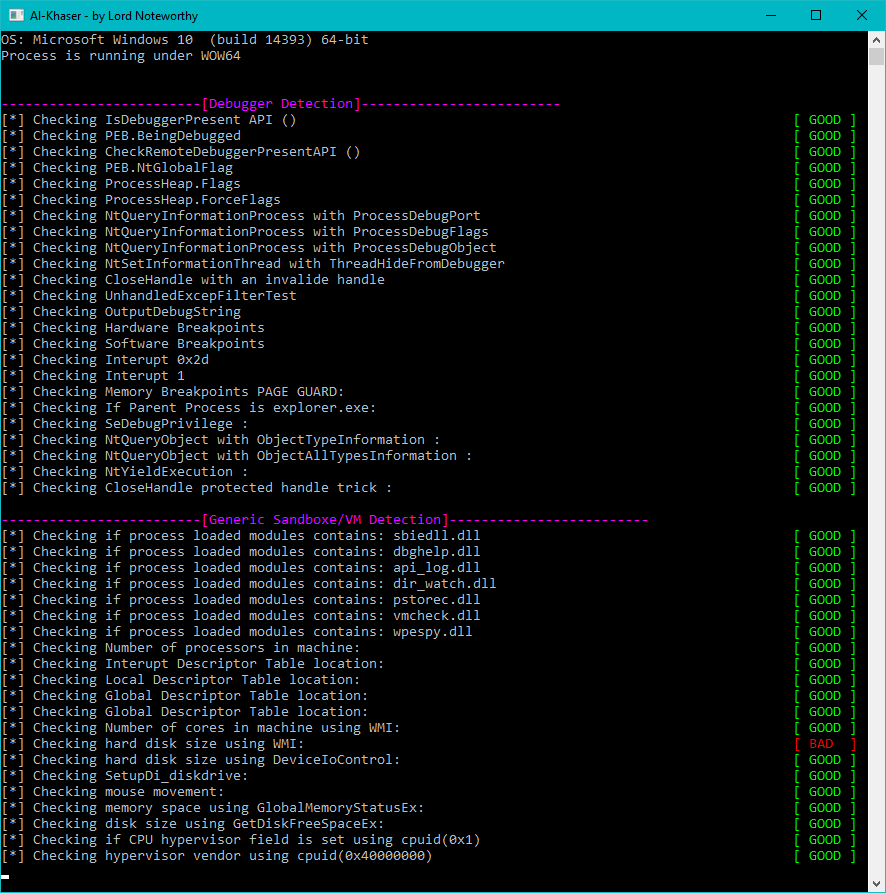
al-khaser ist eine PoC-„Malware“-Anwendung mit guten Absichten, die darauf abzielt, Ihr Anti-Malware-System zu testen. Sie führt eine Reihe typischer Malware-Tricks aus, um zu sehen, ob Sie unter dem Radar bleiben.
$ ./al-khaser.exe -h
Usage: al-khaser.exe [OPTIONS]
Options:
  --check <type>      Enable specific check(s). Can be used multiple times. Valid types are:
                        TLS              (Thread Local Storage callback checks)
                        DEBUG            (Anti-debugging checks)
                        INJECTION        (Code injection checks)
                        GEN_SANDBOX      (Generic sandbox checks)
                        VBOX             (VirtualBox detection)
                        VMWARE           (VMware detection)
                        VPC              (Virtual PC detection)
                        QEMU             (QEMU detection)
                        KVM              (KVM detection)
                        XEN              (Xen detection)
                        WINE             (Wine detection)
                        PARALLELS        (Parallels detection)
                        HYPERV           (Hyper-V detection)
                        CODE_INJECTIONS  (Additional code injection techniques)
                        TIMING_ATTACKS   (Timing/sleep-based sandbox evasion)
                        DUMPING_CHECK    (Dumping memory/process checks)
                        ANALYSIS_TOOLS   (Analysis tools detection)
                        ANTI_DISASSM     (Anti-disassembly checks)
  --sleep <seconds>   Set sleep/delay duration in seconds (default: 600).
  --delay <seconds>   Alias for --sleep.
  -h, --help          Show this help message and exit.

Examples:
  al-khaser.exe --check DEBUG --check TIMING_ATTACKS --sleep 30
  al-khaser.exe --check VMWARE --check QEMU
  al-khaser.exe --sleep 30
Sie können vorgefertigte Binärdateien (x86, x64) von der Releases-Seite dieses Projekts herunterladen. Das Passwort für die 7zs finden Sie hier.
Wenn Sie auf Anti-Analyse-Tricks stoßen, die Sie in Malware gesehen haben, zögern Sie bitte nicht, einen Beitrag zu leisten.
sample.exe or sandbox.exe.