 aman-sharma-dev/netsentryx
منصة مراقبة شبكات مدفوعة بالأحداث تقوم بالتقاط الحزم المباشر (Npcap)، وتحليلات حركة مرور منخفضة الكمون، وكشف التهديدات غير الخاضع للإشراف باستخدام PyTorch Autoencoder، مدعومة بمحرك تنبيهات غير متزامن متعدد القنوات.

محرك كشف التهديدات ومراقبة الشبكة في الوقت الفعلي عالي الأداء المدعوم بالذكاء الاصطناعي




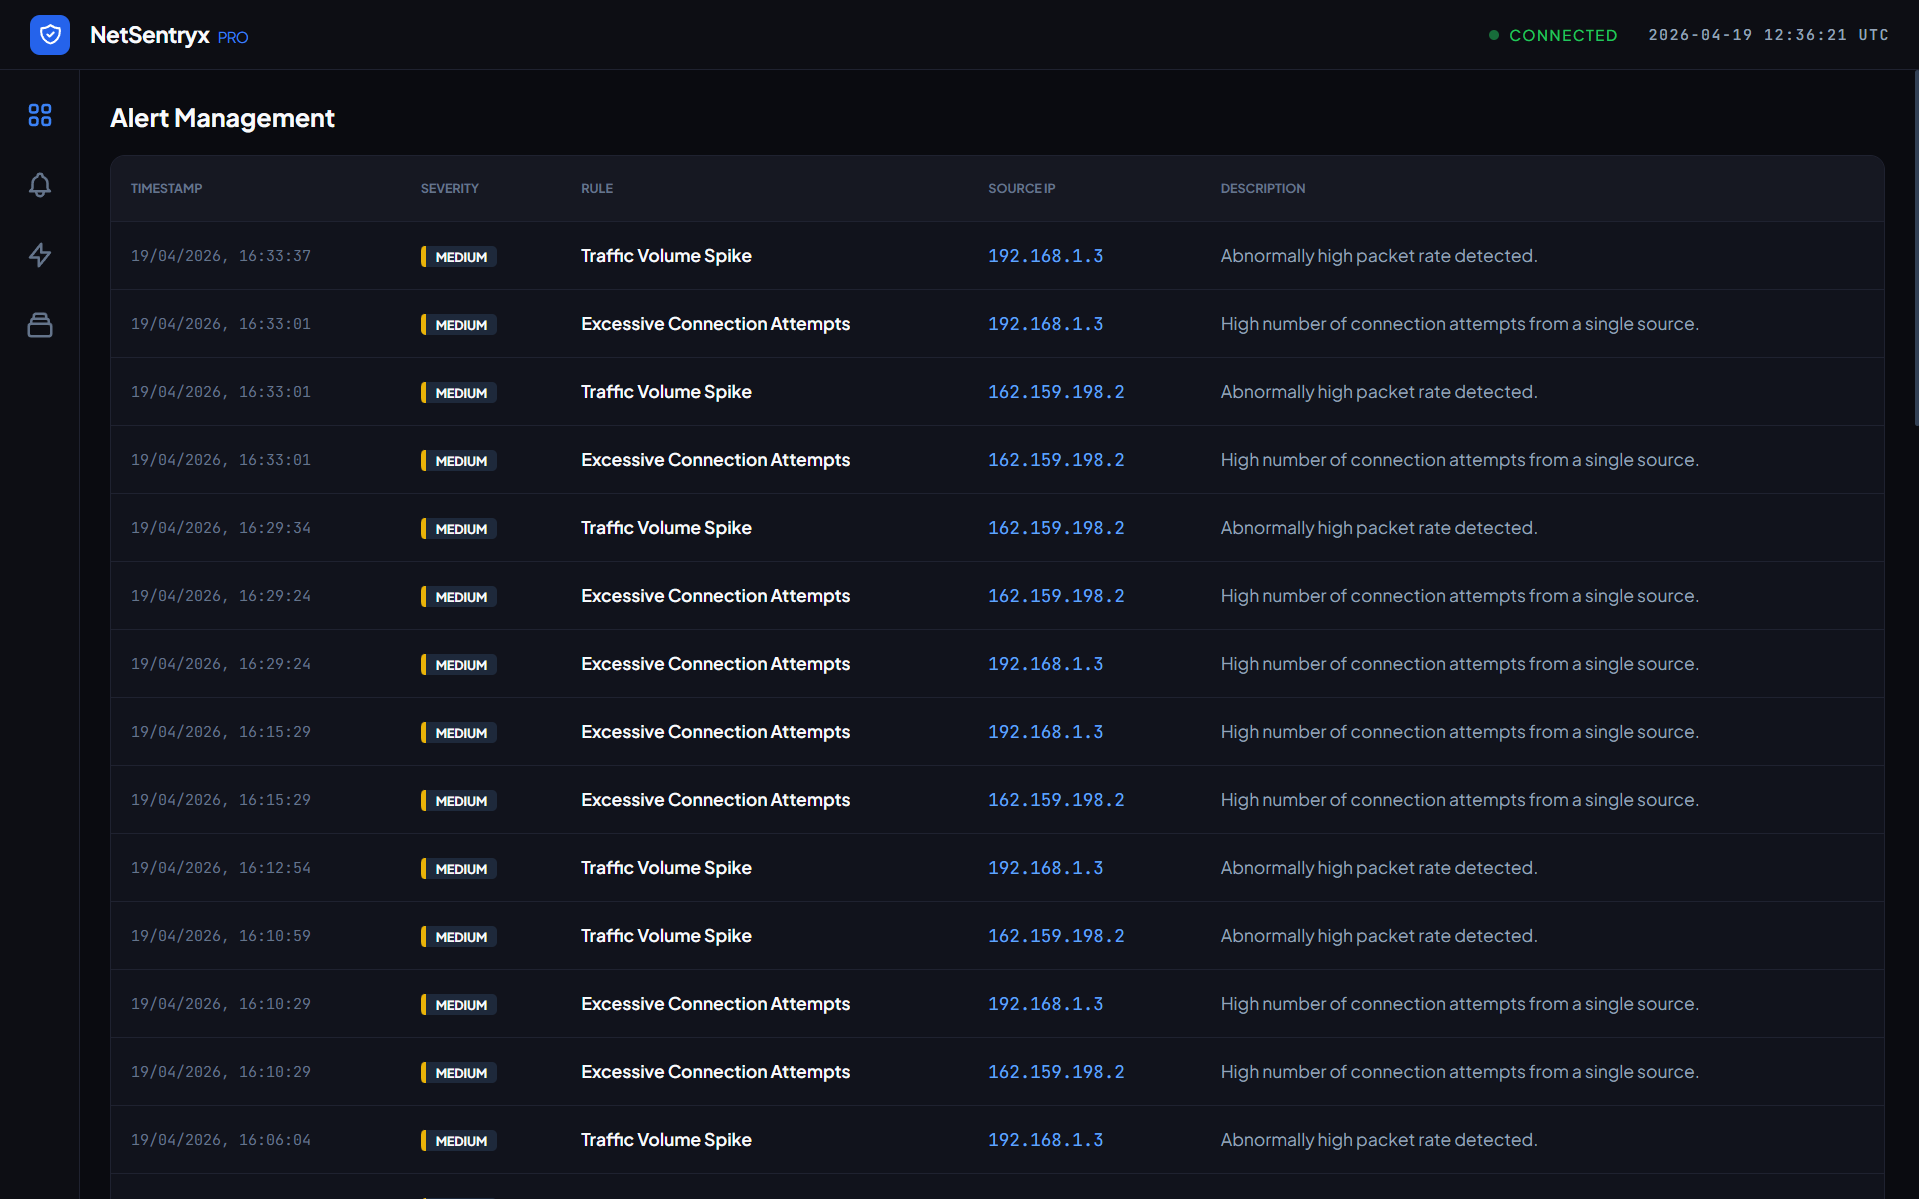
NetSentryx PRO هو منصة مراقبة شبكات واستخبارات تهديدات من الجيل التالي، تعمل بالحدث. من خلال الجمع بين التوقيعات القائمة على القواعد وشبكة PyTorch Deep Autoencoder، فإنه يوفر كشف شذوذ الحزم و netflow في أقل من 10 مللي ثانية، وتنبيهات آلية متعددة القنوات (Slack، Discord، Email)، ولوحة تحكم SOC تفاعلية في الوقت الفعلي.
يوضح مخطط التدفق التالي استيعاب البيانات، والاستدلال بالتعلم العميق في الوقت الفعلي، وخط أنابيب التنبيه، وطبقة العرض عبر WebSocket:
flowchart TD
    subgraph Capture & Ingestion
        A[Network Interface / Packet Simulator] -->|Raw Traffic Events| B(Lightweight Event Bus)
        B -->|Packet Stream| C[Flow Aggregation Engine]
    end

    subgraph Deep Learning Inference
        C -->|Aggregated Telemetry Vectors| D[PyTorch TrafficAutoencoder]
        D -->|MSE Reconstruction Loss| E{Threshold Evaluation}
    end

    subgraph Alert Dispatch
        E -->|No Anomaly| F[Status: Optimal]
        E -->|Anomaly Detected| G[FastAPI BackgroundTasks]
        G -->|Save Event| H[(SQLite Datastore)]
        G -->|Broadcast WebSocket| I[HTML Live Dashboard]
        G -->|Dispatch Webhooks| J[Slack / Discord / Custom Webhook]
        G -->|Dispatch SMTP| K[Email Alerting]
    end

    style D fill:#EE4C2C,stroke:#fff,stroke-width:2px,color:#fff
    style I fill:#005571,stroke:#fff,stroke-width:2px,color:#fff
    style G fill:#00bf8f,stroke:#fff,stroke-width:2px,color:#fff
TrafficAutoencoder) لكشف الاستغلالات المتقدمة من نوع zero-day، أو الفحص، أو هجمات DDoS بناءً على خطأ إعادة بناء الميزات متعددة المتغيرات.Mean + 3 * Std) أثناء بدء تشغيل الخادم، مما يجعله يعمل بالكامل جاهزًا للاستخدام.BackgroundTasks من FastAPI.NetSentryx/
├── config/
│ ├── config.yaml # System, dashboard, and alerting channel configurations
│ └── rules.yaml # Threat detection thresholds and rule properties
├── src/
│ ├── alerts/
│ │ ├── ml_detection.py # PyTorch TrafficAutoencoder & feature scaling
│ │ ├── manager.py # Async alert dispatcher (Discord, Slack, Email)
│ │ └── detection.py # Rule-based packet signature detection engine
│ ├── core/
│ │ ├── config_loader.py # Configuration loader utilities
│ │ ├── logger.py # Database-integrated system logger
│ │ └── time_utils.py # Timezone-aware timestamp utilities
│ ├── dashboard/
│ │ ├── templates/
│ │ │ └── index.html # Live HTML5 Dashboard template
│ │ └── server.py # FastAPI API Router and WebSocket broadcast controller
│ ├── database/
│ │ ├── manager.py # SQLite connection & database actions
│ │ └── models.py # SQLAlchemy schema definitions (Alerts, Logs, Flows)
│ ├── flows/
│ │ ├── capture.py # Scapy packet sniffer thread
│ │ └── processor.py # Flow aggregation and metric extractor
│ └── main.py # Application entrypoint
└── main.py # Root script runner
تأكد من تثبيت Python 3.10+. إذا كنت تلتقط واجهات الشبكة المباشرة:
libpcap-dev عبر sudo apt-get install libpcap-dev.استنسخ المستودع وقم بتثبيت التبعيات (يوصى بشدة باستخدام uv لتثبيت أسرع):
# Clone the repository
git clone https://github.com/yourusername/netsentryx.git
cd netsentryx

# Create virtual environment
python -m venv .venv
source .venv/bin/activate  # On Windows: .venv\Scripts\activate

# Install requirements
pip install -r requirements.txt
.env)أنشئ ملف .env في جذر المشروع لتكوين بيانات اعتماد الإشعارات:
# Discord Configuration
DISCORD_ENABLED=true
DISCORD_WEBHOOK_URL="https://discord.com/api/webhooks/your-webhook-id/your-webhook-token"

# Slack Configuration
SLACK_ENABLED=true
SLACK_WEBHOOK_URL="https://hooks.slack.com/services/YOUR_WORKSPACE_ID/YOUR_CHANNEL_ID/YOUR_SECRET_TOKEN"

# SMTP Email Configuration
SMTP_ENABLED=true
SMTP_SERVER="smtp.gmail.com"
SMTP_PORT=587
SMTP_USERNAME="[email protected]"
SMTP_PASSWORD="your-app-password"
SMTP_FROM_EMAIL="[email protected]"
SMTP_TO_EMAIL="[email protected]"
python main.py --simulate
python main.py
افتح متصفحك وانتقل إلى http://localhost:8000 لعرض لوحة التحكم المباشرة.
/api/v1/telemetry/analyzePOSTapplication/json{
"packet_count": 550,
"byte_count": 850000,
"flow_duration": 4.5,
"syn_flag_ratio": 0.85,
"port_entropy": 3.2,
"byte_rate": 188888.8,
"source_ip": "192.168.1.120",
"dest_ip": "10.0.0.5",
"protocol": "TCP"
}
{
  "status": "NORMAL",
  "threat_level": "low",
  "anomaly_score": 0.3083,
  "threshold": 2.1319
}
{
  "status": "ANOMALOUS",
  "threat_level": "critical",
  "anomaly_score": 117999.03,
  "threshold": 2.1319,
  "alert": {
    "id": 12,
    "timestamp": "2026-08-05T14:13:31.373Z",
    "rule_id": "ml_autoencoder_anomaly",
    "rule_name": "ML Autoencoder Anomaly",
    "source_ip": "192.168.1.120",
    "severity": "critical",
    "description": "Deep autoencoder reconstruction error exceeded anomaly threshold (score: 117999.0300, threshold: 2.1320).",
    "metrics": { ... }
  }
}
| Endpoint | Method | Description | Sample Response |
|---|---|---|---|
/api/alerts | GET | Fetches recent threat alerts saved in DB | [{"id": 1, "rule_name": "Port Scanning", ...}] |
/api/flows | GET | Fetches recent network flow telemetry logs | [{"source_ip": "192.168.1.10", "packet_count": 45, ...}] |
/api/logs | GET | Fetches backend system audit logs | [{"level": "INFO", "message": "ML engine trained...", ...}] |
هذا المشروع مرخص بموجب رخصة MIT - راجع ملف LICENSE للحصول على التفاصيل.

