 big-comfy/deadair
Encontra as regras de deteção no seu SIEM que estão a funcionar às cegas.



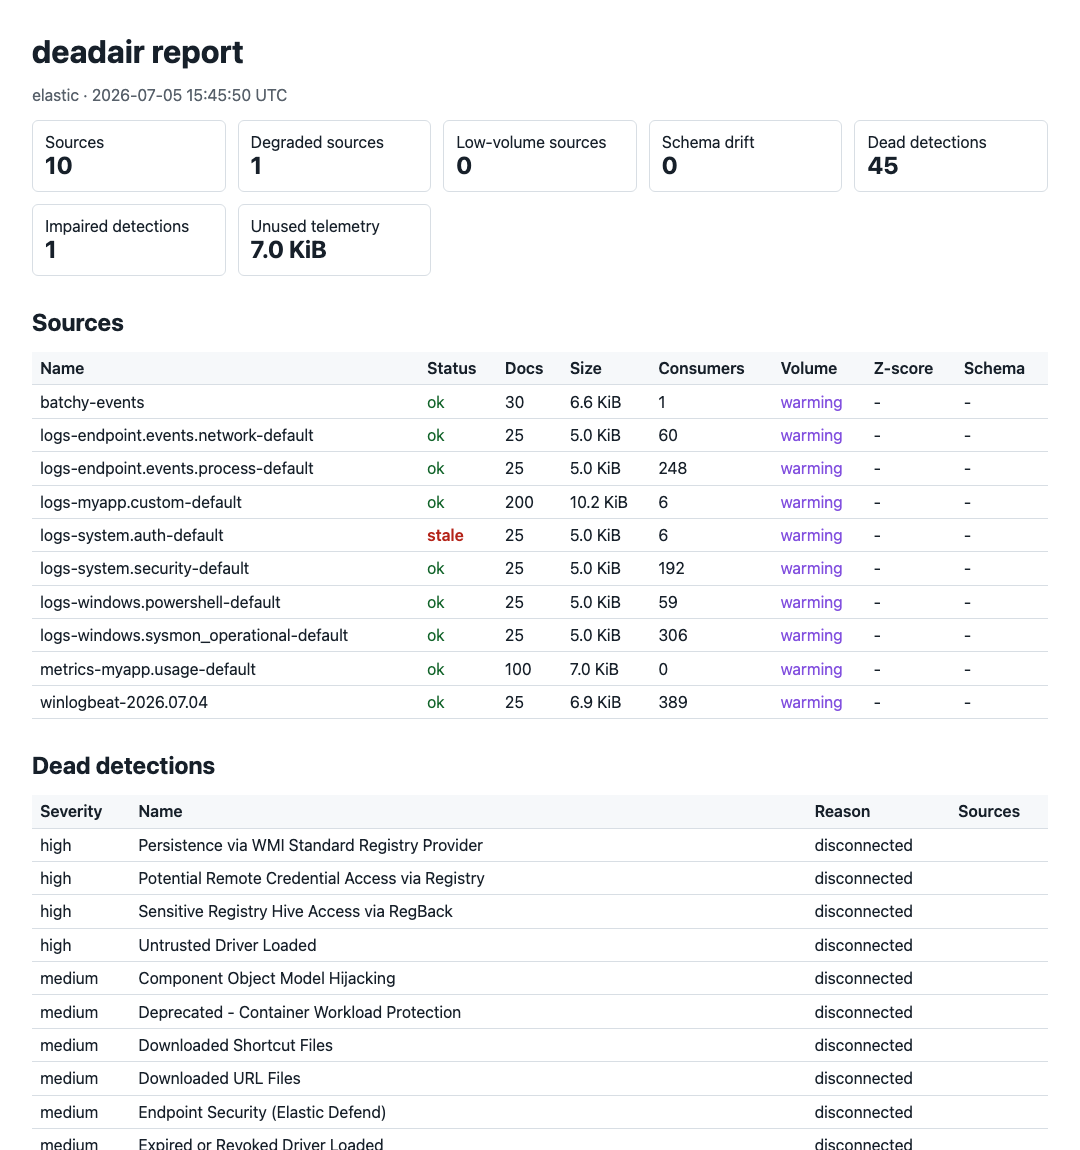
O deadair verifica se as detecções de SIEM habilitadas ainda têm a telemetria de que precisam.
Ele reporta dados ausentes ou obsoletos, atrasos de ingestão e incompatibilidades de schema.
Executa localmente · Somente leitura · Sem agente · Sem upload de telemetria
Leia o artigo técnico · Destaque no Detection Engineering Weekly · Destaque no tl;dr sec #341
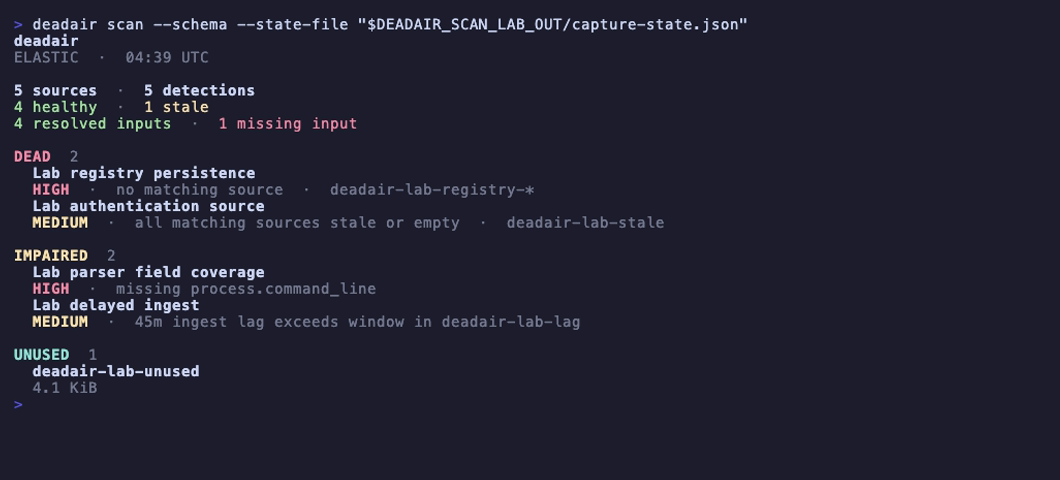
Campos ausentes e eventos atrasados em um laboratório Elastic descartável. Abra a imagem para ver a gravação curta com controles de reprodução, ou reproduza-a com make record-scan-lab.
Uma regra pode estar habilitada, agendada e sem erros depois que os dados de que precisa desapareceram. O deadair lê o inventário de regras ativas, resolve as entradas de cada regra usando a semântica nativa do backend e verifica as fontes concretas por trás delas.
Ele detecta:
O deadair oferece suporte a Elastic Security, OpenSearch Security Analytics e Microsoft Sentinel.
Baixe um binário para macOS, Linux ou Windows em GitHub Releases, ou instale com Go:
go install github.com/alephnull-sh/deadair/cmd/deadair@latest
Imprima a configuração somente leitura para o seu SIEM:
deadair setup elastic      # Elastic Security
deadair setup opensearch   # OpenSearch Security Analytics
deadair setup sentinel     # Microsoft Sentinel
Execute uma configuração, depois verifique e faça a varredura:
deadair check   # verify the credential can scan
deadair scan    # assess live rules and telemetry
Os códigos de saída são estáveis: 0 passa no gate configurado, 1 significa achados com gate e 2 significa que a varredura falhou.
Para investigar uma fonte e suas detecções consumidoras:
deadair scan --json-out report.json --html-out report.html
deadair inspect --source CommonSecurityLog report.json
Use um nome de fonte do seu relatório. O guia de investigação também aborda feeds individuais do Sentinel, manutenção e rastreamento de recuperação.
| Etapa | O que o deadair faz |
|---|---|
| Inventário | lê as detecções habilitadas e as entradas que elas declaram |
| Resolução | usa resolução nativa de índice no Elastic e OpenSearch; no Sentinel, combina análise KQL com evidências de tabela, watchlist, função salva, ASIM e cross-workspace mapeado |
| Medição | verifica a atualidade e o timing da fonte, além de schema e armazenamento onde o backend oferece suporte |
| Relatório | emite terminal, JSON, HTML, rollups de frota e métricas Prometheus com as evidências por trás de cada veredito |
O Sentinel segue o mesmo modelo de regra para fonte e adiciona watchlists literais, funções salvas, parsers ASIM, workspaces mapeados e linhagem de tabela de resumo. Ele também mostra quando uma fatia filtrada de uma tabela compartilhada ficou silenciosa ou um pipeline de resumo ficou para trás.
O guia de uso descreve as regras de evidência, e o registro de validação registra a cobertura de testes ao vivo.
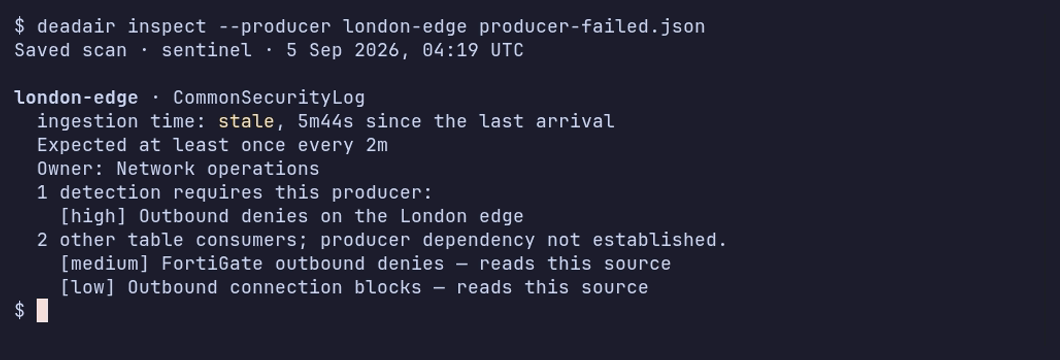
Dois feeds de firewall compartilham CommonSecurityLog. Um para; o outro continua reportando. A gravação mostra as varreduras de falha e recuperação salvas. Veja o registro de validação para as condições do laboratório.
O deadair verifica se a telemetria de uma detecção está presente e saudável. Ele não valida a lógica da regra nem prova que um ataque simulado disparará um alerta. Use validação estática de regras e testes de detecção ponta a ponta para essas tarefas.
