 orange-cyberdefense/graphcat
암호 해독 결과를 기반으로 그래프와 차트를 생성합니다.

해시캣(및 john) potfile 및 ntds에 대한 그래프와 차트를 생성하는 간단한 스크립트입니다.
git clone https://github.com/Orange-Cyberdefense/graphcat
cd graphcat
pip install .
$ graphcat.py -h
usage: graphcat.py [-h] -potfile hashcat.potfile -hashfile hashfile.txt [-john] [-format FORMAT] [-export-charts] [-output-dir OUTPUT_DIR] [-debug]

Password Cracking Graph Reporting

options:
  -h, --help            show this help message and exit
  -potfile hashcat.potfile
                        Hashcat Potfile
  -hashfile hashfile.txt
                        File containing hashes (one per line)
  -john                 John potfile
  -format FORMAT        hashfile format (default 3): 1 for hash; 2 for username:hash; 3 for secretsdump (username:uid:lm:ntlm)
  -export-charts        Output also charts in png
  -output-dir OUTPUT_DIR
                        Output directory
  -debug                Turn DEBUG output ON
Graphcat는 -potfile(기본값은 hashcat, -john을 사용하여 john potfile 제출 가능)과 -hashfile을 사용하여 hashfile이 필요합니다. hashfile은 -format 플래그와 함께 3가지 형식 중 하나의 특정 형식이어야 합니다. 기본값은 Secretsdump입니다.
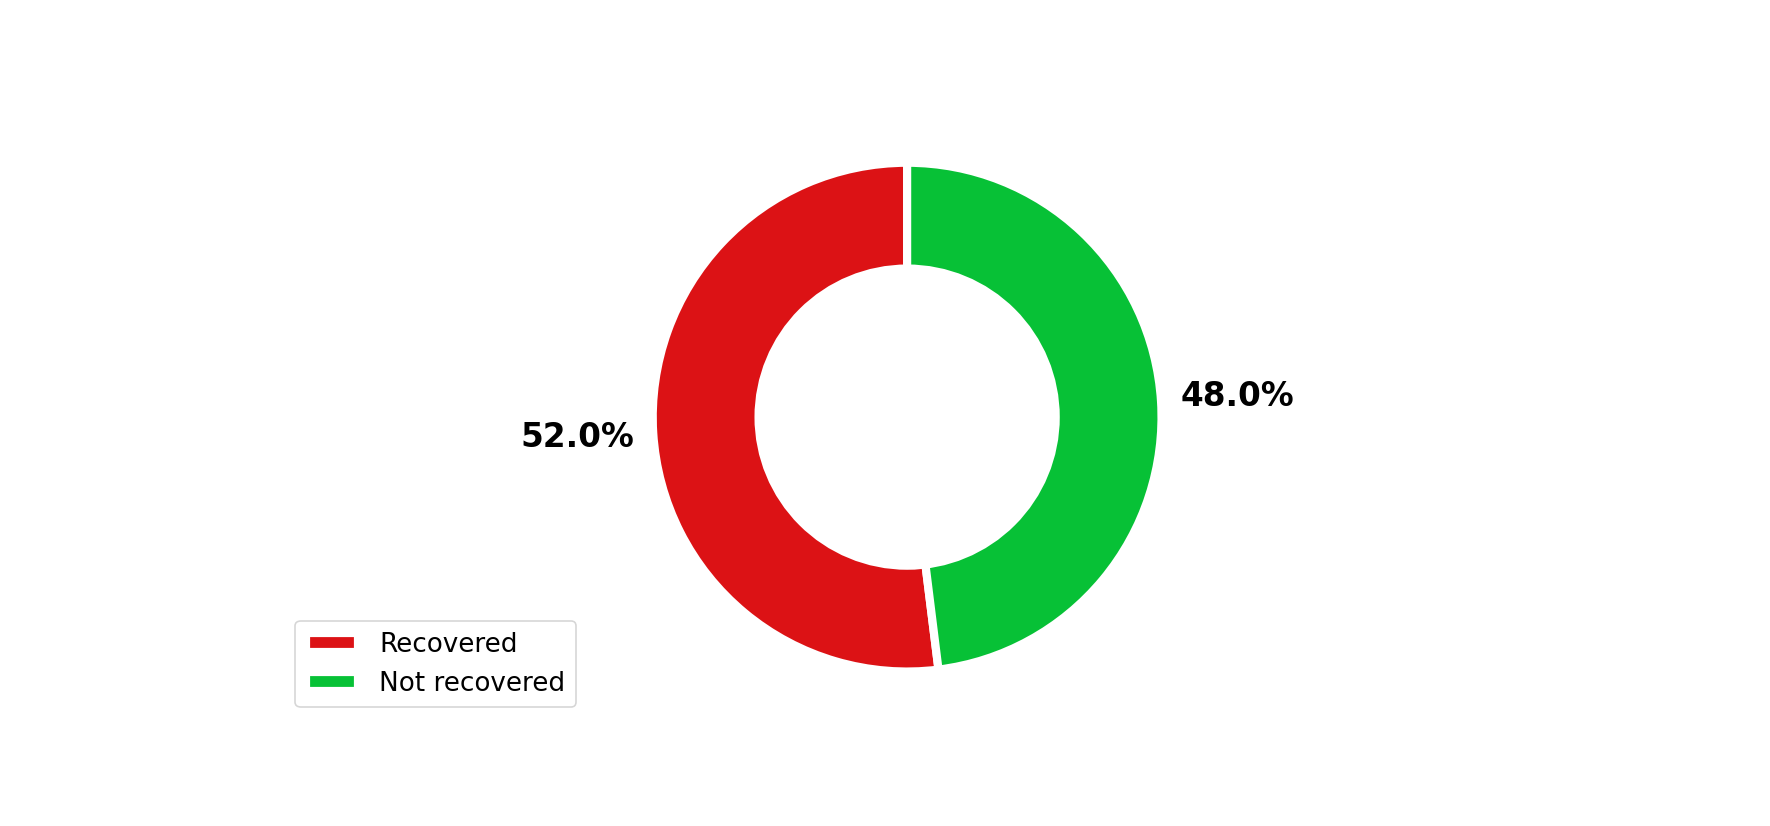
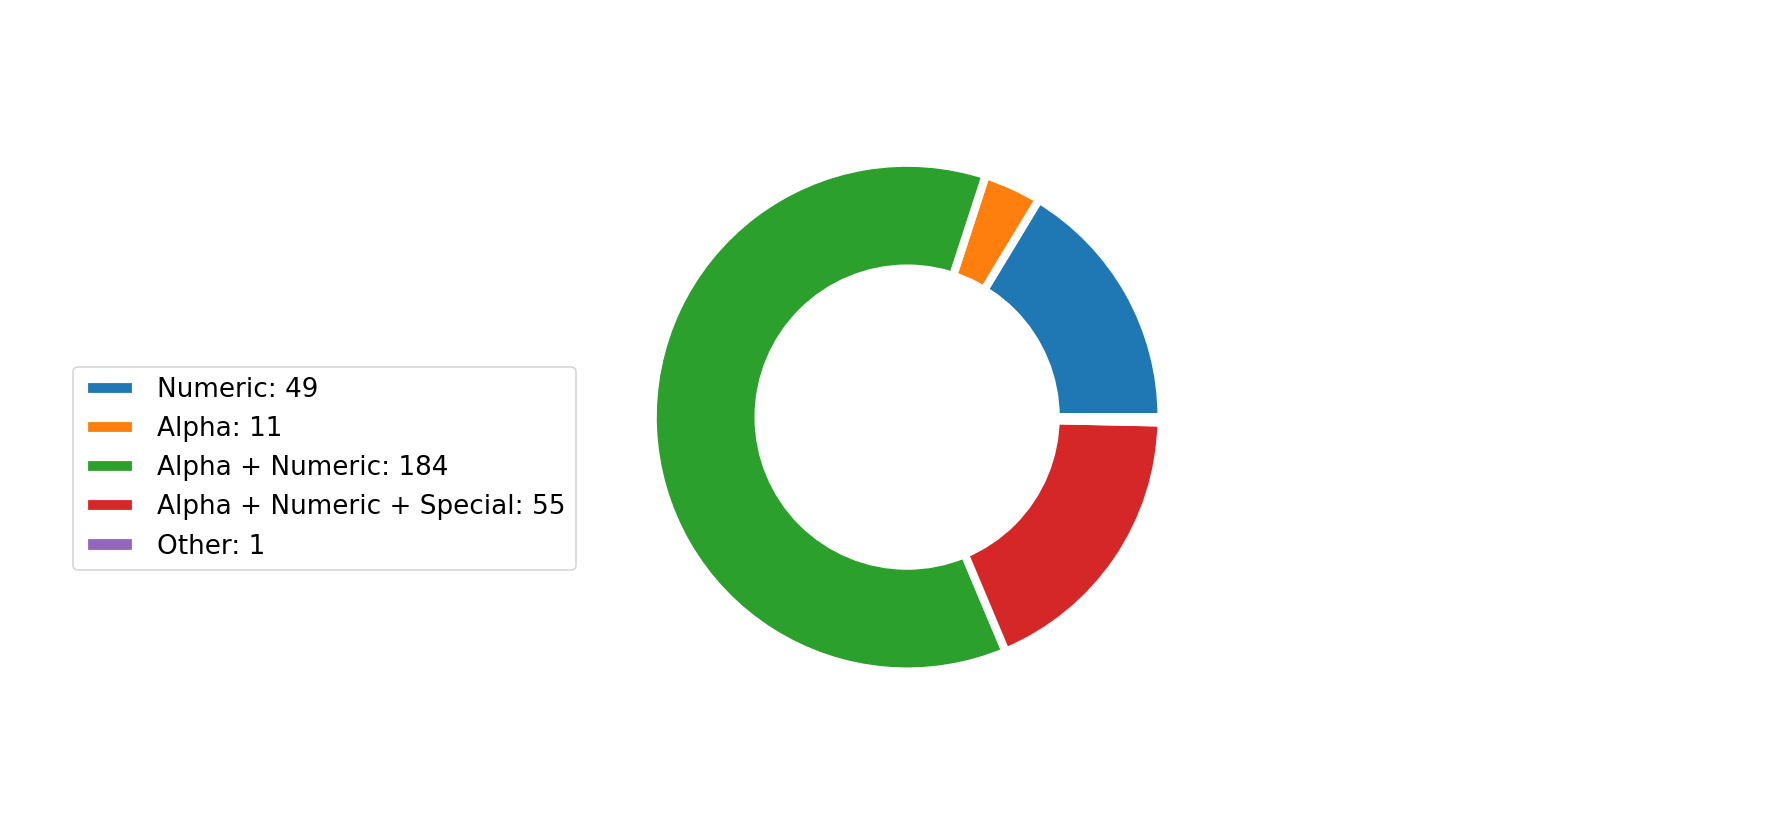
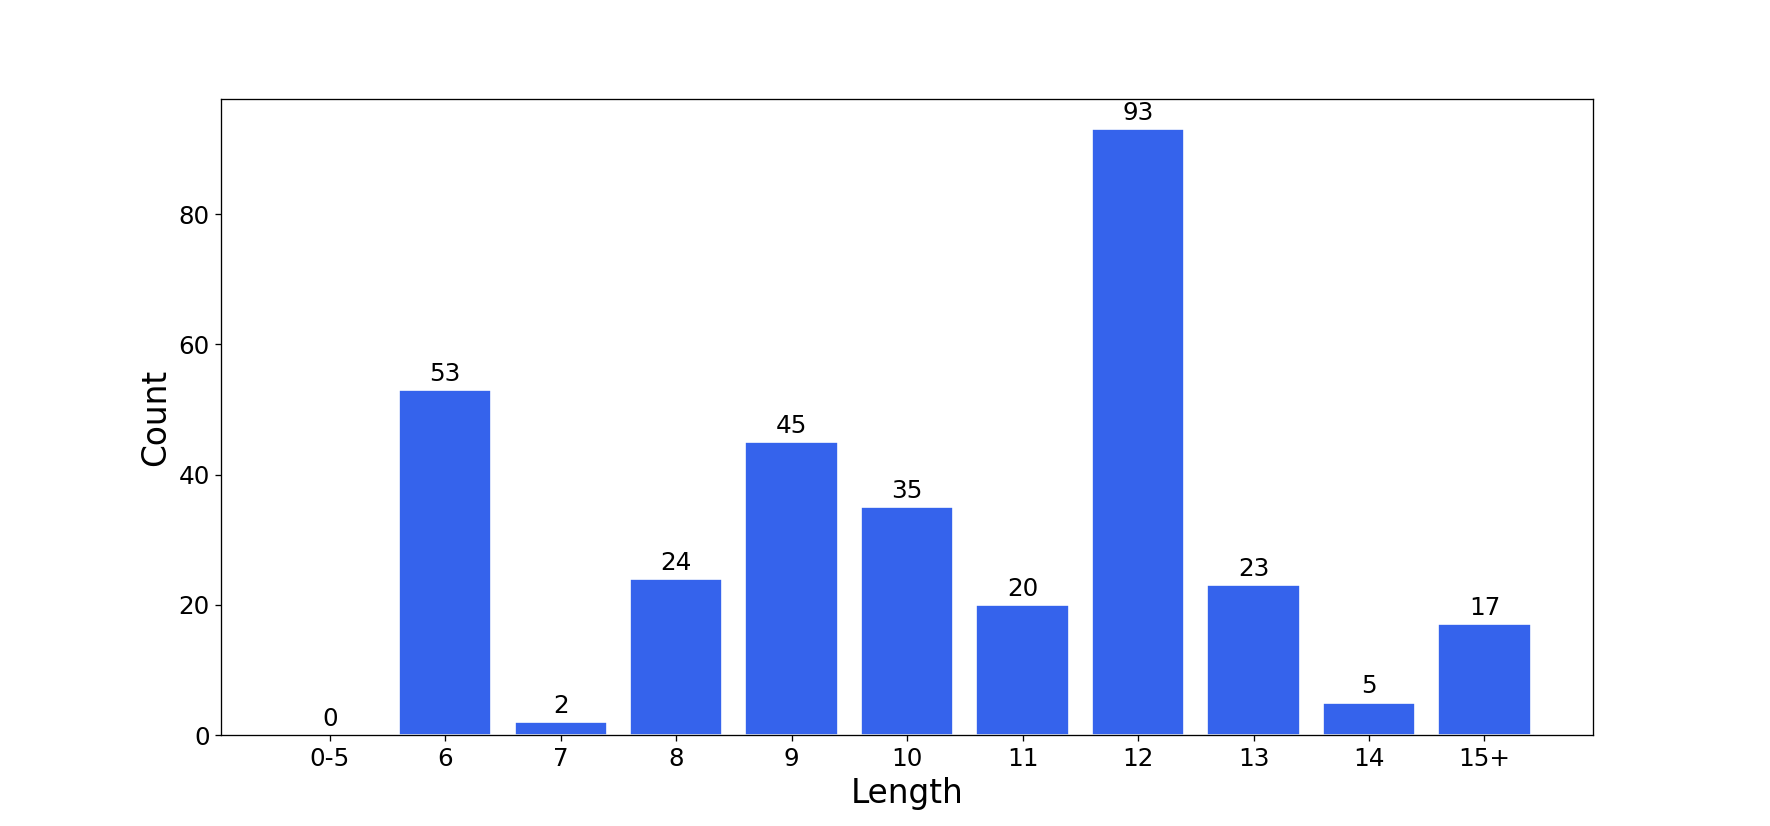
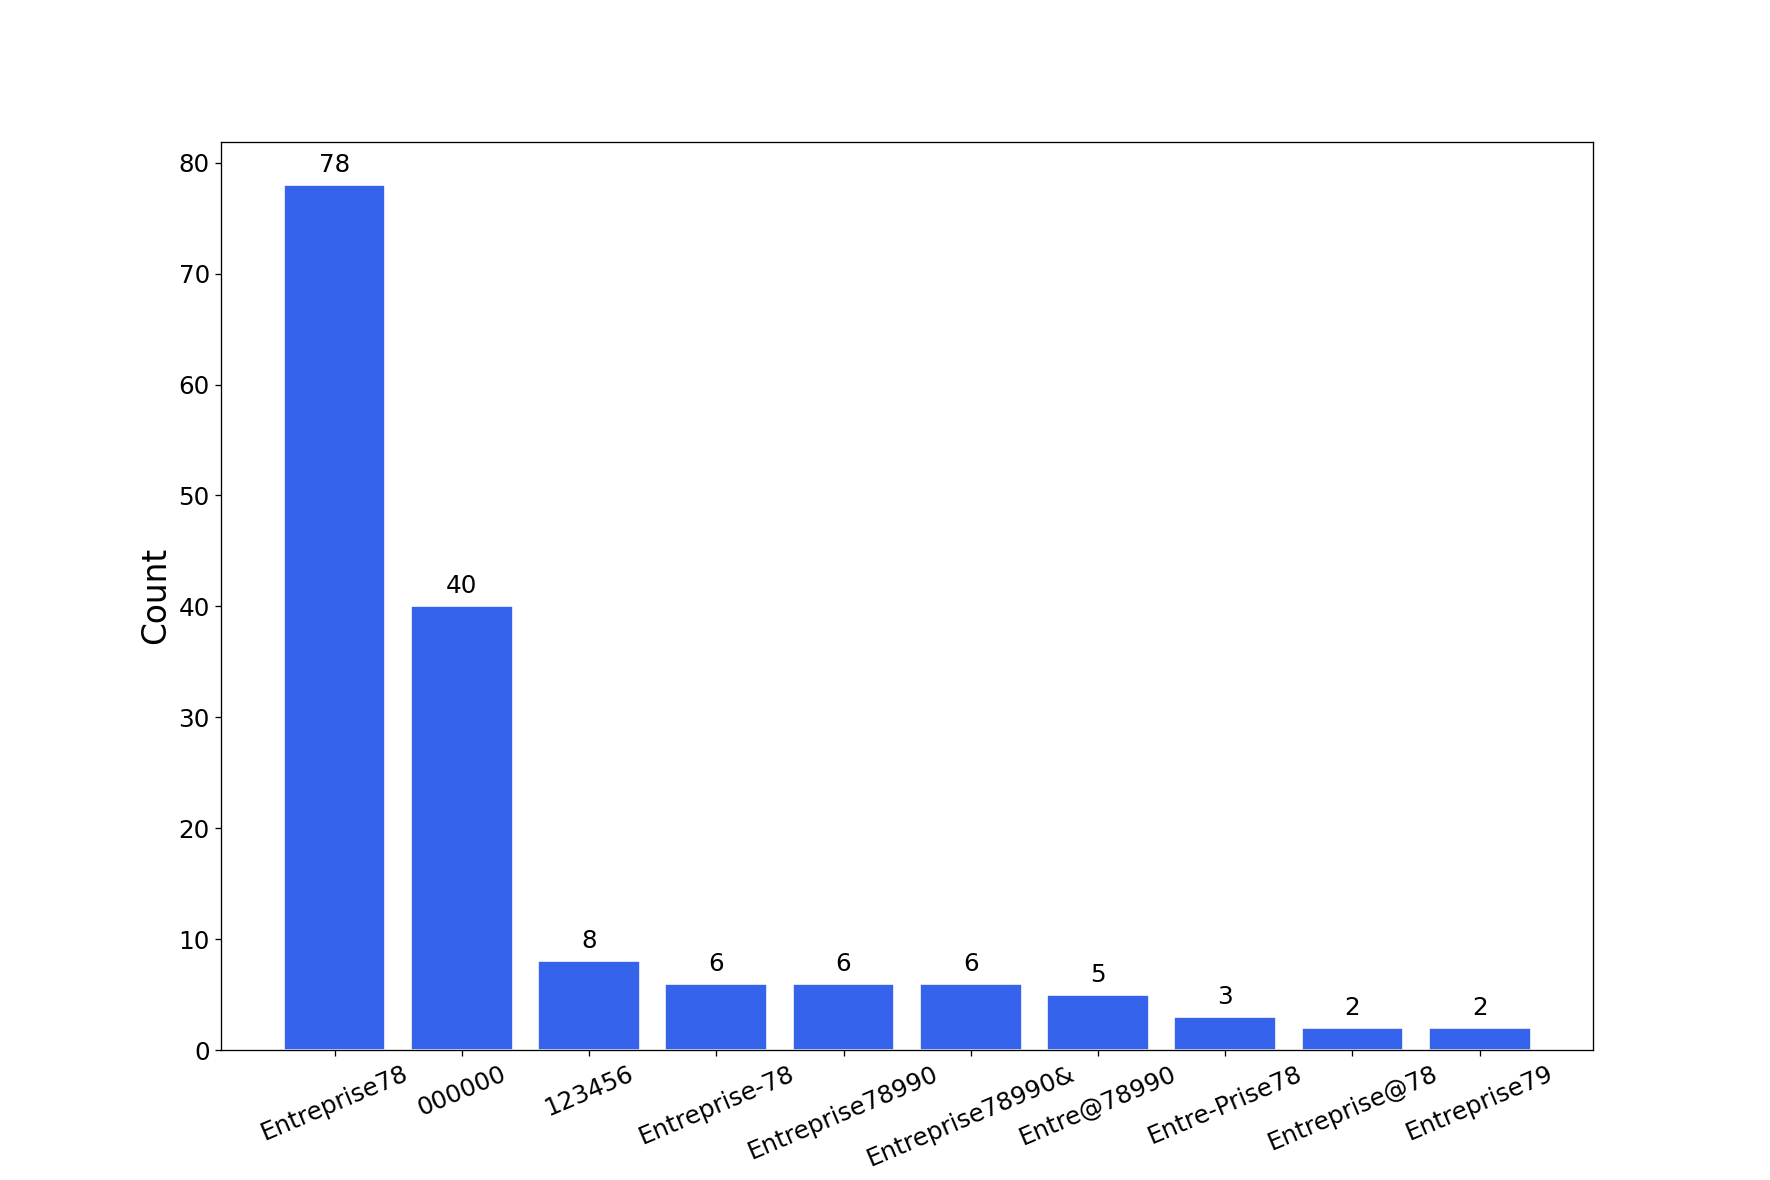
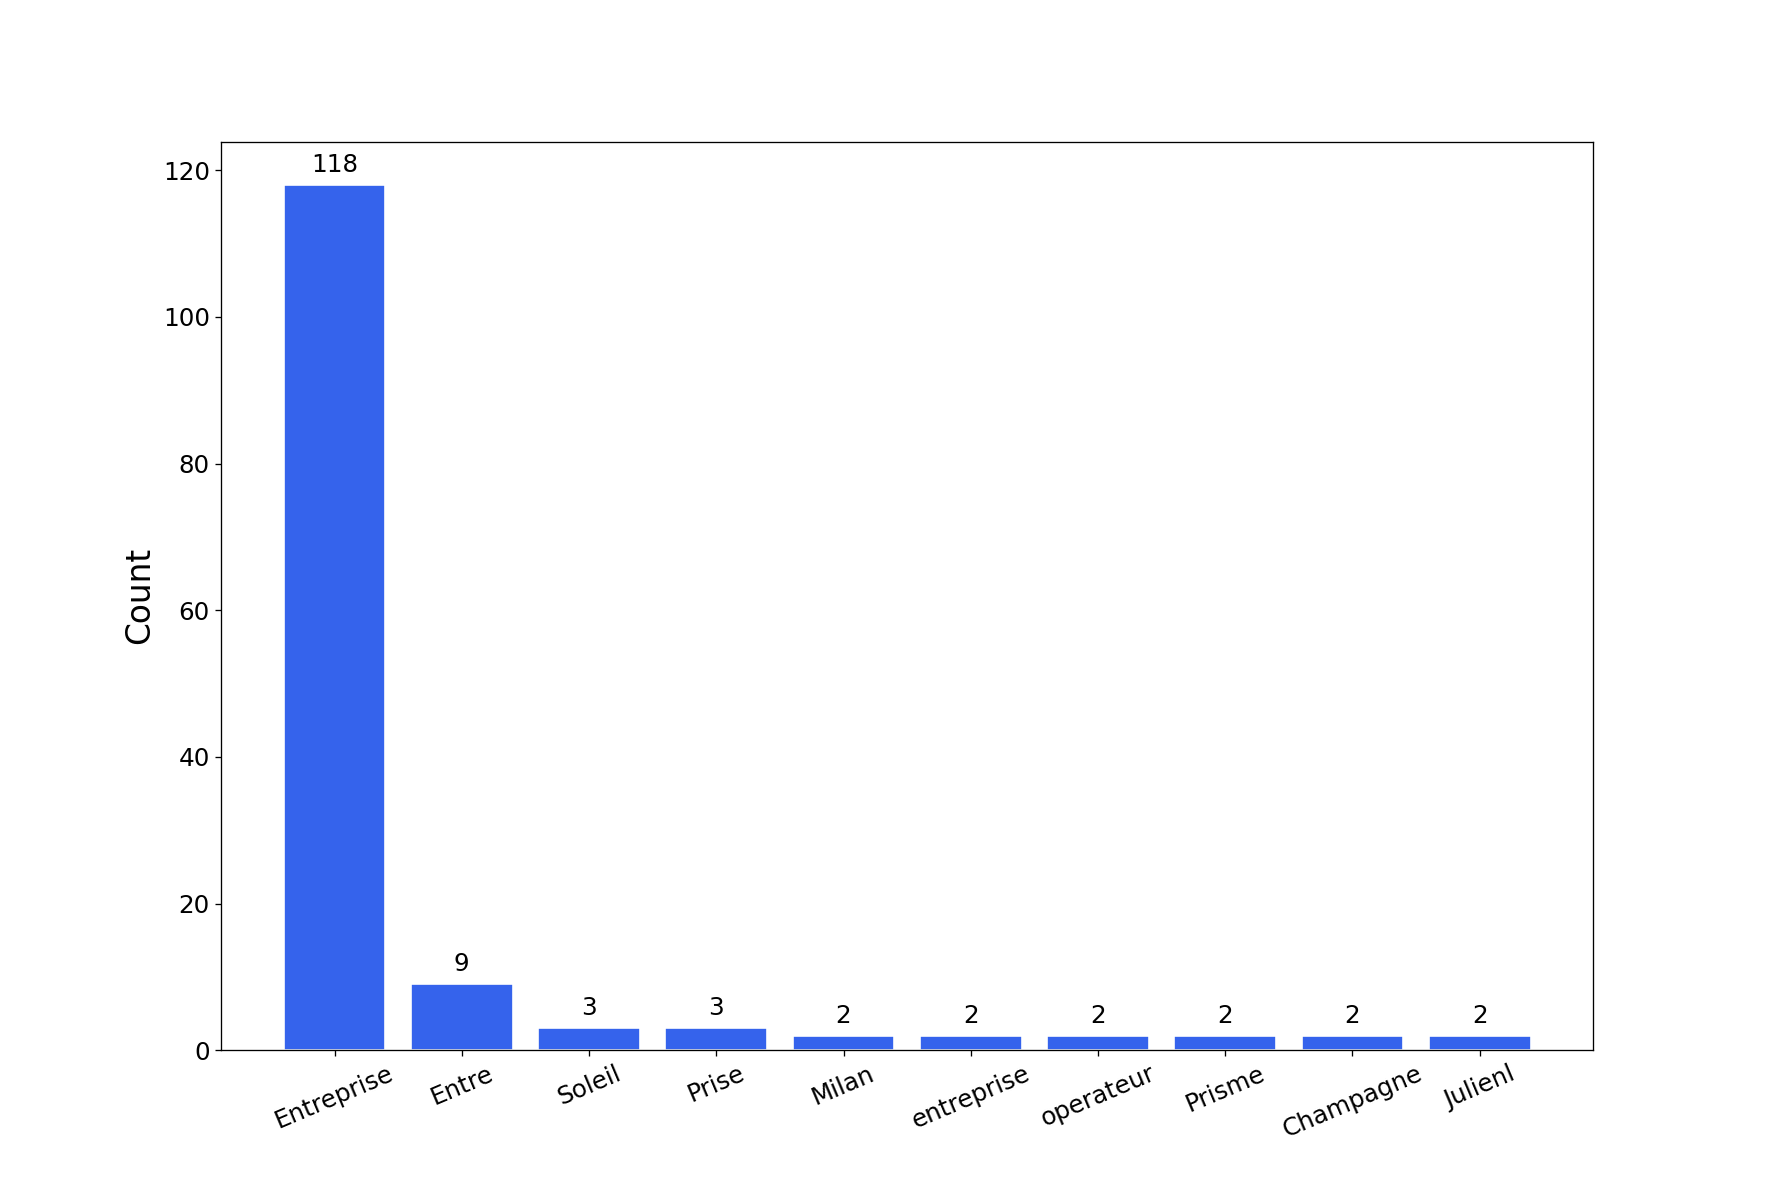
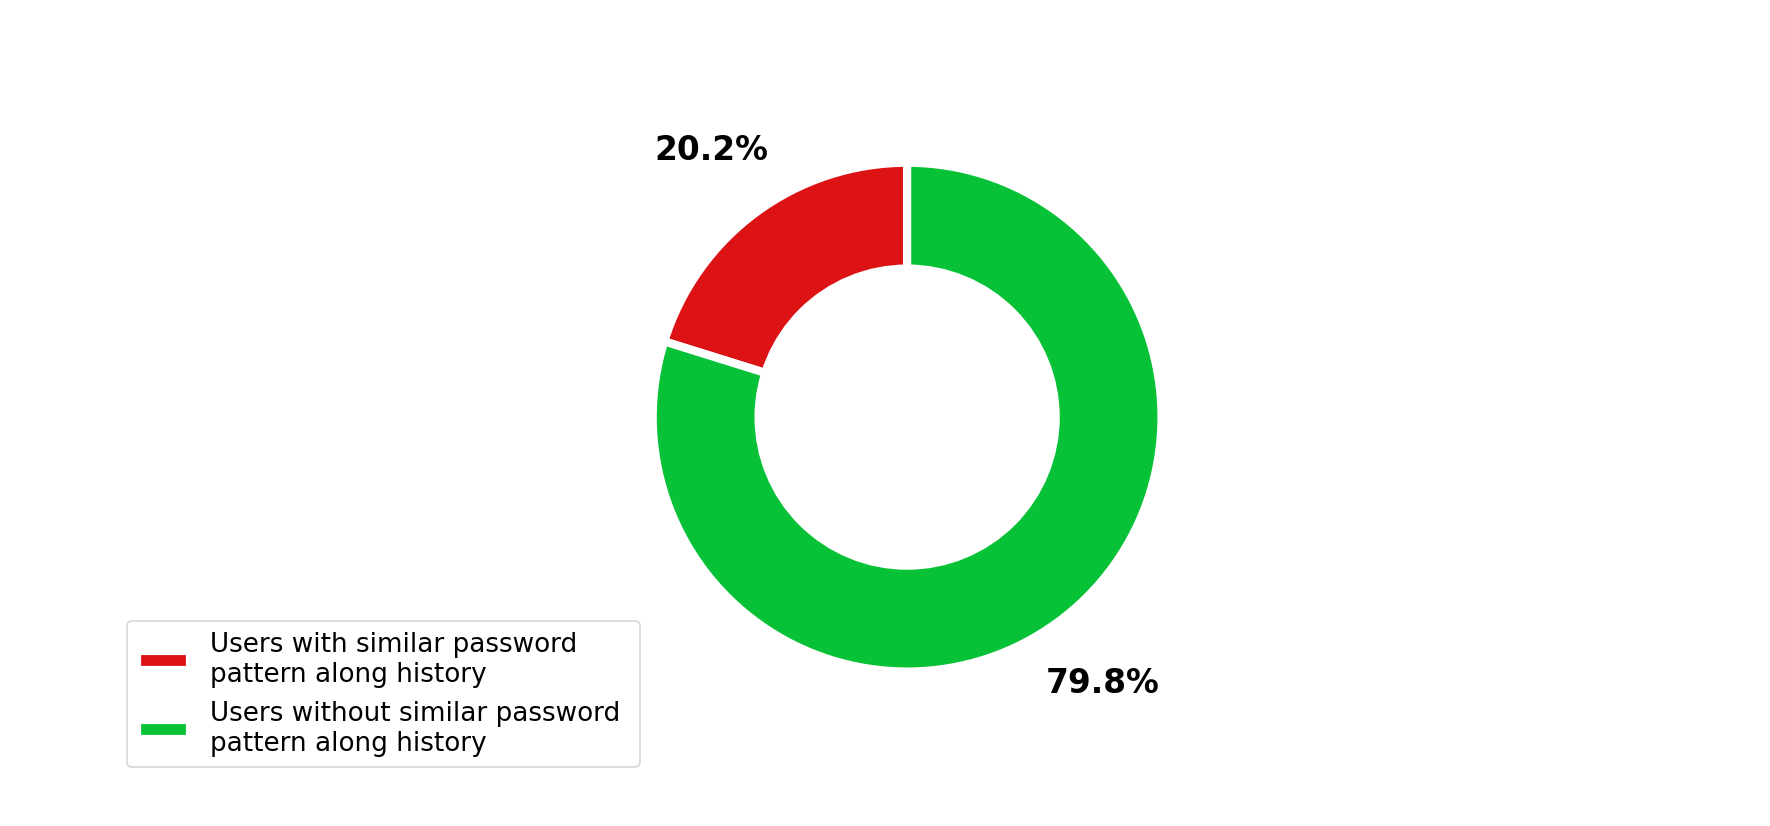
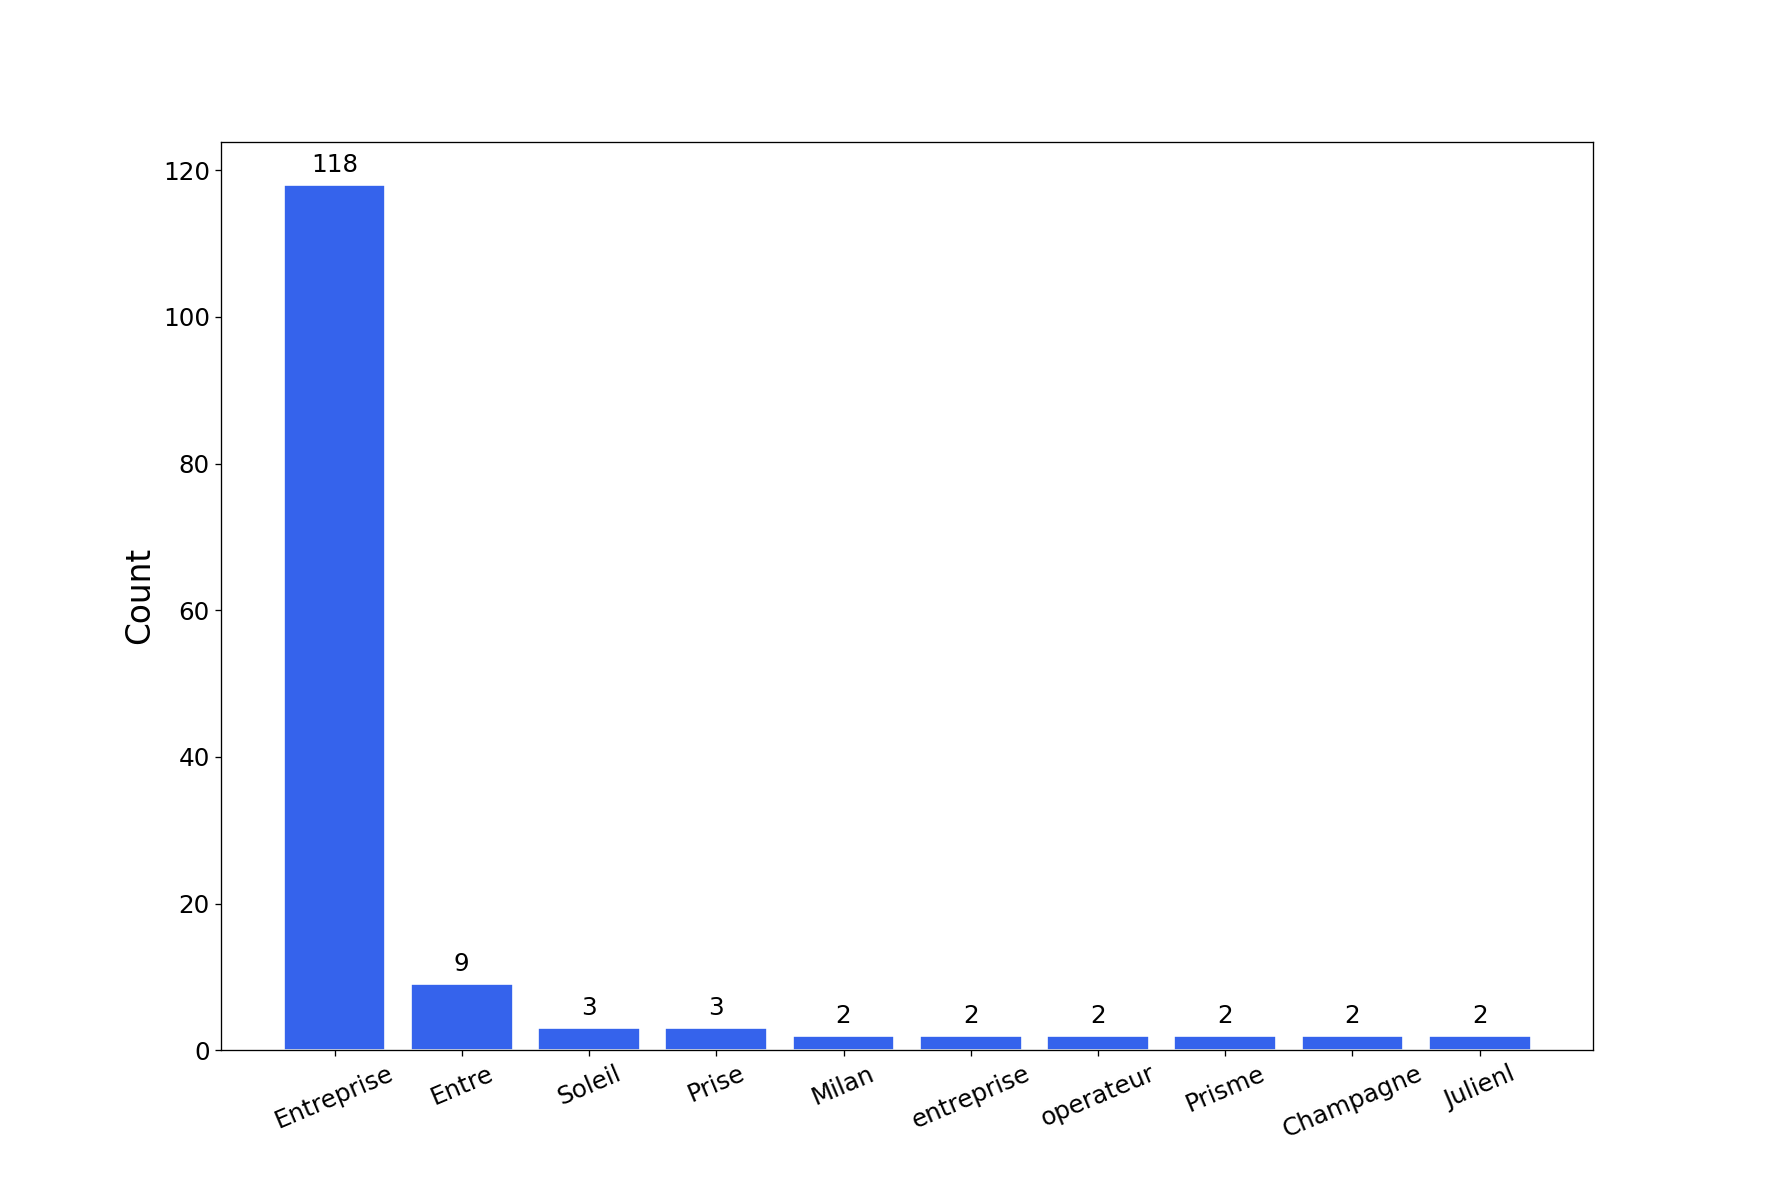
이 도구는 여러 암호 크래킹 차트가 포함된 보고서를 생성합니다. -export-charts 플래그를 사용하여 PNG 형식의 차트를 얻을 수 있습니다.
$ graphcat.py -hashfile entreprise.local.ntds -potfile hashcat.pot
[-] Parsing potfile
[-] 164 entries in potfile
[-] Parsing hashfile
[-] 1600 entries in hashfile
[-] Generating graphs...
[-] Generating report...
[-] Report available at graphcat_1672941324.pdf
1: 해시만
aad3b435b51404eeaad3b435b51404ee
aad3b435b51404eeaad3b435b51404ee
aad3b435b51404eeaad3b435b51404ee
2: 사용자명 + 해시
test1:aad3b435b51404eeaad3b435b51404ee
test2:aad3b435b51404eeaad3b435b51404ee
test3:aad3b435b51404eeaad3b435b51404ee
3: Secretsdump
waza.local\test1:4268:aad3b435b51404eeaad3b435b51404ee:aad3b435b51404eeaad3b435b51404ee:::
waza.local\test2:4269:aad3b435b51404eeaad3b435b51404ee:aad3b435b51404eeaad3b435b51404ee:::
waza.local\test3:4270:aad3b435b51404eeaad3b435b51404ee:aad3b435b51404eeaad3b435b51404ee:::
해시 파일에서 동일한 해시가 여러 번 나타나면 그만큼 여러 번 계산됩니다.
또한, 비밀번호 기록과 함께 secretsdump를 제출하면(-history 플래그), 비밀번호 기록의 유사성을 분석합니다.