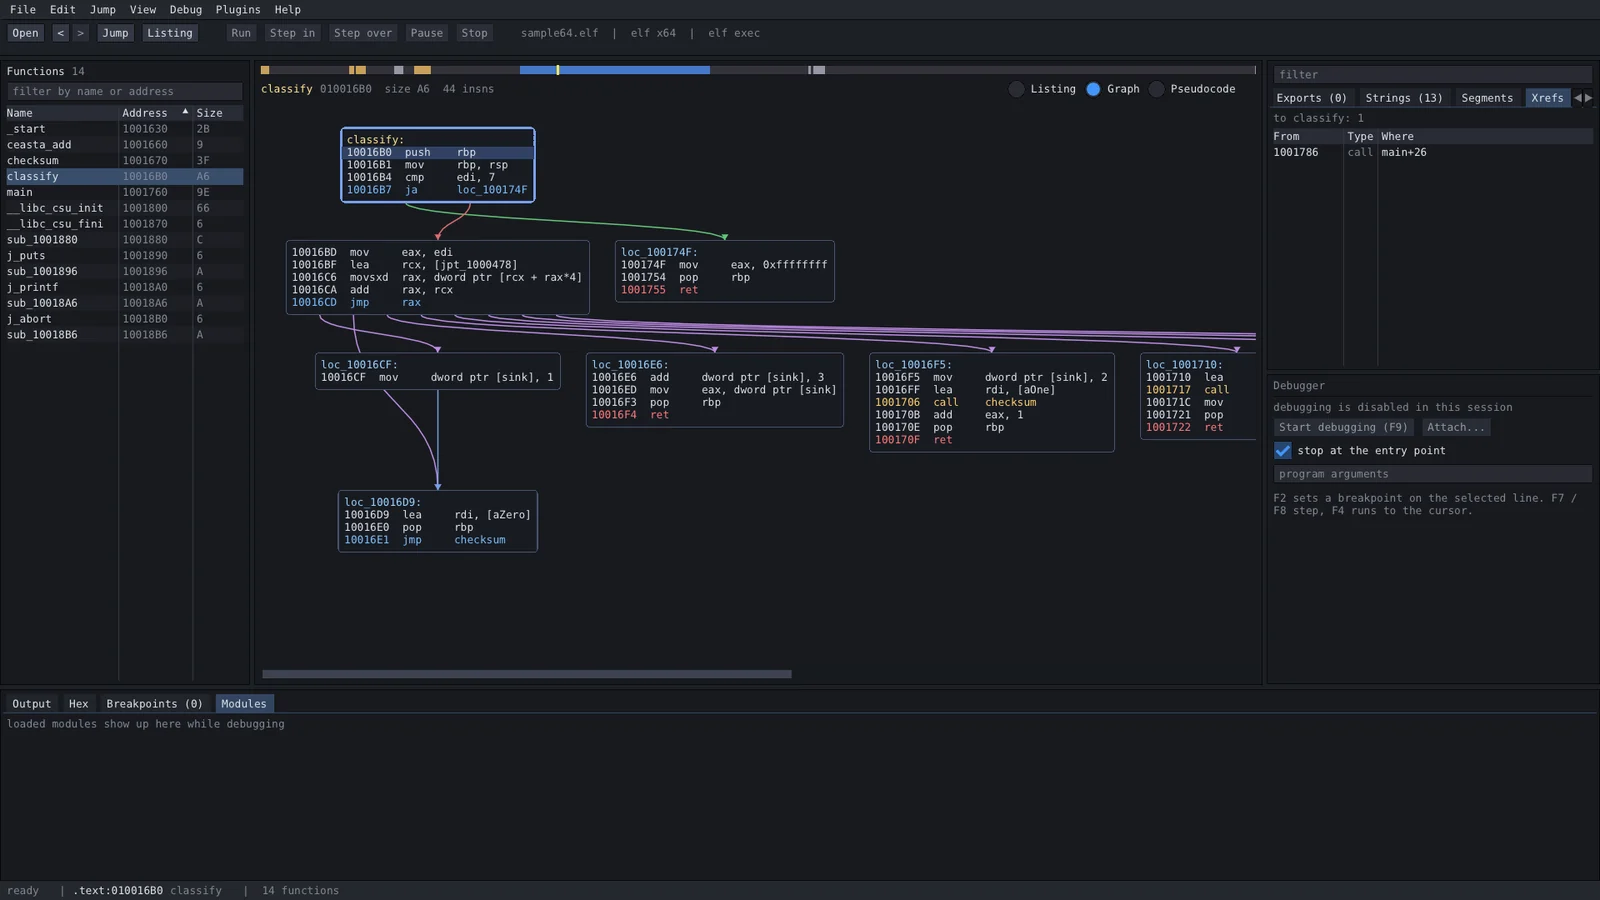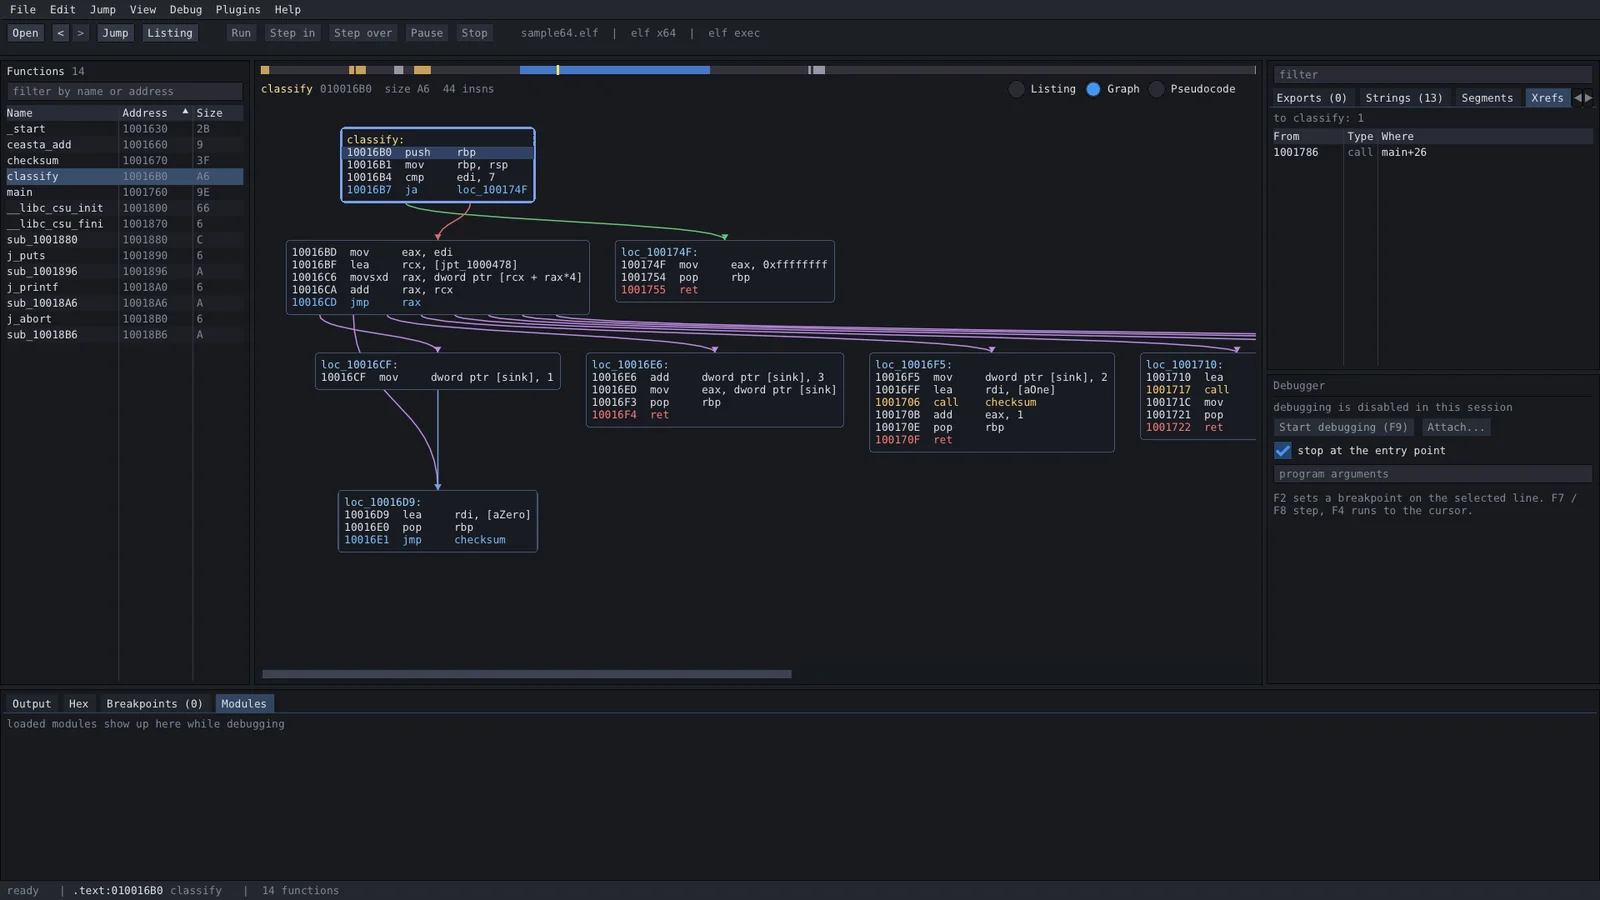

disassembler, decompiler and debugger in one, with a built-in mcp server: point an ai at a binary and it can debug it, not just read it. ida-style listing, pseudocode (f5), x64dbg-style debugger (windows and linux), binary diff, lua plugins. reads pe, elf and mach-o. runs on windows, linux and macos.

a disassembler, decompiler and debugger in one — for windows, linux and macos, x86, x64 and arm64




ida-style listing, a decompiler, a function graph, an x64dbg-style debugger, lua plugins, and a built-in MCP server so you can point an AI at a binary — one small program, everything vendored, nothing to install to build.
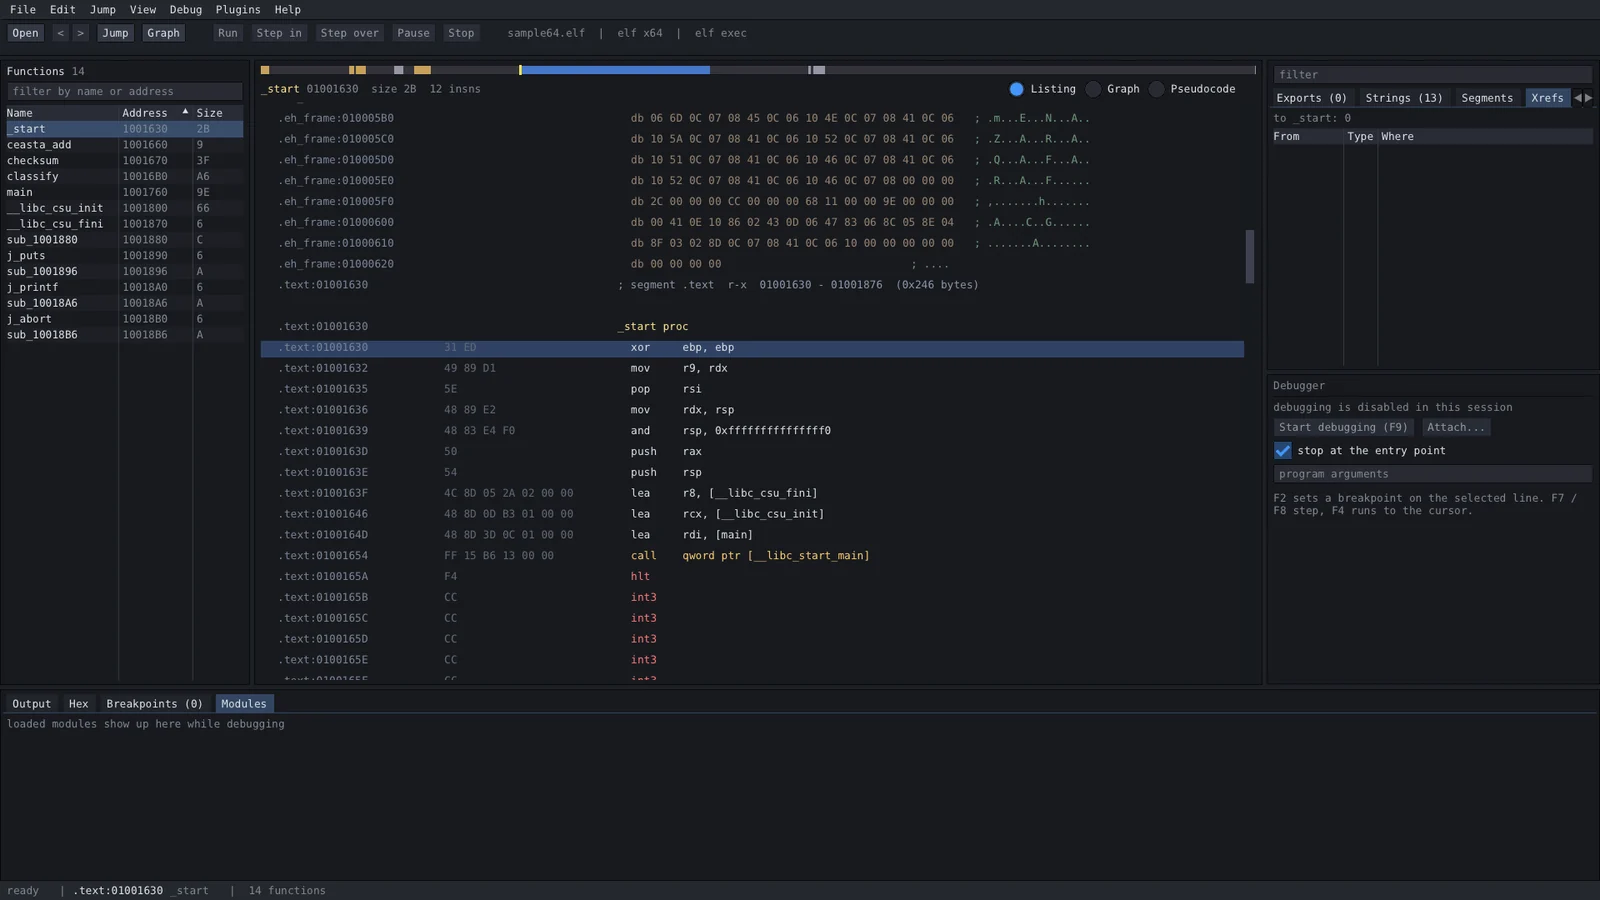
ceasta shows the same code from raw bytes up to readable c, so you can drop to whatever level you need:
; assembly - the real instructions  // pseudocode (f5) - reconstructed c

checksum proc                       int checksum(int rdi)
  movzx   edx, byte ptr [rdi]       {
  test    dl, dl                        rdx = *(char*)rdi;
  je      loc_1191                      if (rdx == 0) {
  mov     eax, 0x1505                       return 0x1505;
loc_1179:                               }
  mov     ecx, eax                      rax = 0x1505;
  shl     ecx, 5                        do {
  add     eax, ecx                          rax = rax + (rax << 5) + rdx;
  add     rdi, 1                            rdi = rdi + 1;
  movzx   edx, dl                           rdx = *(char*)rdi;
  add     eax, edx                      } while (rdx != 0);
  movzx   edx, byte ptr [rdi]           return rax;
  test    dl, dl                    }
  jne     loc_1179
  ret
loc_1191:
  mov     eax, 0x1505
  ret
that's djb2 (5381 is 0x1505, and (h << 5) + h is h * 33). click a name in the pseudocode and name things as you understand them — y on the function gives it a prototype, n renames a variable:
unsigned checksum(const char* s)
{
    rdx = *(char*)s;
    if (rdx == 0) {
        return 0x1505;
    }
    h = 0x1505;
    do {
        h = h + (h << 5) + rdx;
        s = s + 1;
        rdx = *(char*)s;
    } while (rdx != 0);
    return h;
}
the decompiler is best-effort (x86 / x64, no structs yet) — great for getting a routine quickly, while the listing stays the source of truth.
grab it from the releases page:
| file | platform | what you get |
|---|---|---|
ceasta-x.y.z-setup.exe | windows 10/11 x64 | the full app, installs for your user (no admin), start menu + optional "open with ceasta" |
ceasta-x.y.z-windows-x64.zip | windows x64 | the full app, portable — unzip and run ceasta.exe |
ceasta-x.y.z-linux-x64.AppImage | linux x64 | the full app — chmod +x and run (on linux) |
ceasta-cli-x.y.z-linux-x64.tar.gz | linux x64 | ceasta-cli + plugins: analysis, disassembly, decompiler, scripting, terminal debugger, binary diff, signatures, and the MCP server |
ceasta-x.y.z-macos.dmg | macos 11+, apple silicon and intel | the app, no debugger yet — drag it to Applications (on a mac) |
ceasta-cli-x.y.z-macos.tar.gz | macos 11+, apple silicon and intel | ceasta-cli + plugins, everything above but the debugger |
n renames it, y sets a type or a prototype. shift+f5 shows it next to the listingkuna switch — its output for the same function, lines linked to the listing, arm64 too. more belowrdi == 3), watchpoints on variables, step into / over / out, step back, run to cursor, pause, registers, stack, call stack, memory map, live memory
call decrypt "..."), record indirect call targets as xrefs (trace)ceasta-cli dbg: the same debugger in a terminalsigmake / sigapply)ceasta-cli mcp — with ready-made prompts, and names you review before they're applied. see connect an AI.i64: ctrl+s writes <file>.ceasta with your names, comments, types, breakpoints and the program itself — it opens later, or on another machine, without the original. closing asks before it throws unsaved work away.map files, and ida / ghidra (with the scripts in scripts/)ceasta-cli for scripts and cione window, nothing floating around: