
Skip to content
KitploitKITPLOIT
ツールエクスプロイトブログ
Log in
提出
ツールエクスプロイトブログ
提出

ハッキング、侵入テスト、サイバーセキュリティツールをあなたのセキュリティアーセナルに!

Kitploitはハッキング、サイバーセキュリティ、ペネトレーションテストのツールディレクトリです。最新のプロジェクトアップデートを見つけて、脆弱性の発見、システム分析、テストの自動化、セキュリティの強化を行いましょう。

··フィード·お問い合わせ·プライバシー·© 2026 Kitploit

ツールディレクトリ

カテゴリ

すべてのカテゴリを見る
Loading categories
monitor — Real-time monitoring and slowlog analysis for Valkey and Redis databases with anomaly detection, ACL auditing, and Prometheus metrics export. | Kitploit
ツール/GitHubGitHub/betterdb-inc/monitor
Database SecurityAnomaly DetectionLog Analysis
GitHubbetterdb-inc/monitor

monitor

Real-time monitoring and slowlog analysis for Valkey and Redis databases with anomaly detection, ACL auditing, and Prometheus metrics export.


リポジトリを見るウェブサイト
1.2k696817時間19分前Kitploit レビュー済み

人気

すべて見る →

コミュニティで最も使われているツールを見つけましょう。

すべてのツールを探索

ツールコレクションを閲覧

すべてのツールを見る →
共有
要求された言語のコンテンツは利用できません。英語版を表示しています。

BetterDB Monitor

Docker Pulls Docker Image Version Artifact Hub npm npm downloads API Tests License Valkey Redis

The monitoring layer that Valkey deserves.

BetterDB persists what Valkey throws away - slowlogs, command patterns, client activity, anomaly signals - so you can debug what happened at 3am, not just what's happening now. Built for Valkey 8.x with native support for COMMANDLOG, CLUSTER SLOT-STATS, and per-thread I/O metrics. Redis 6+ compatible for everything else.

Website | Docker Hub | npm | Documentation | Blog

BetterDB is built by BetterDB Inc., a public benefit company operating under the OCV Open Charter.
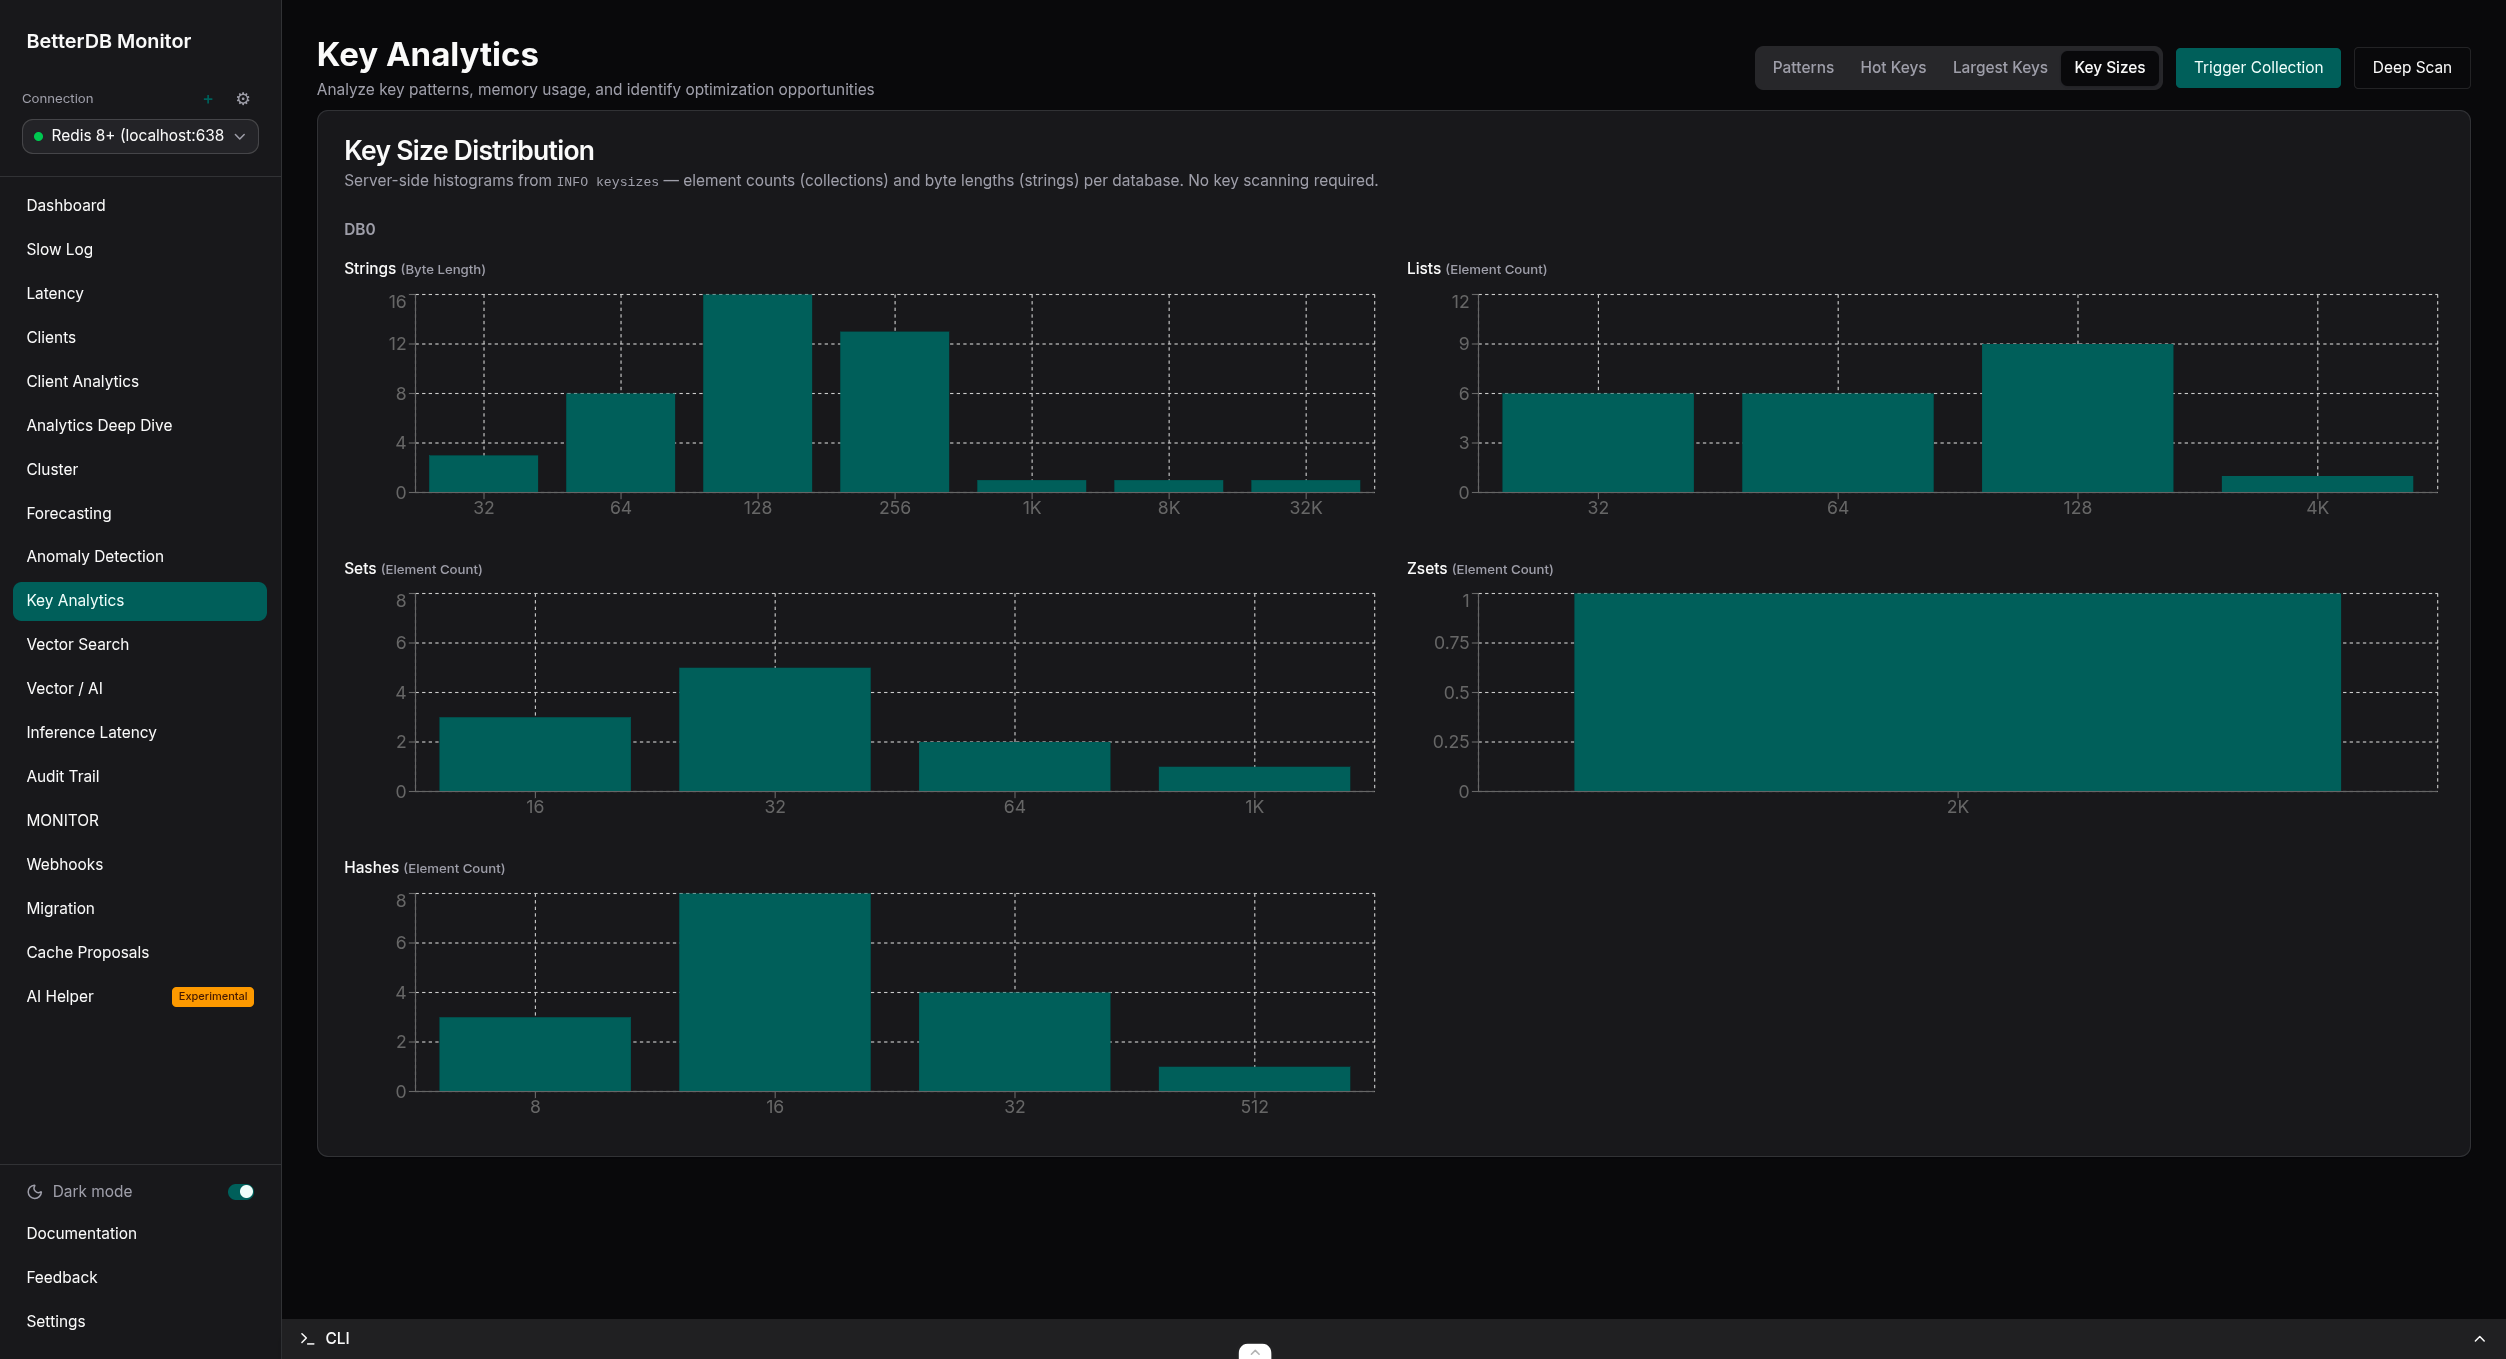
BetterDB Monitor - Key Analytics with per-type key size distribution histograms

Quick Start (Docker)

docker run -d --name betterdb -p 3001:3001 betterdb/monitor:latest

Point your browser to http://localhost:3001. To monitor a specific instance:

docker run -d \
  --name betterdb \
  -p 3001:3001 \
  -e DB_HOST=your-valkey-host \
  -e DB_PORT=6379 \
  -e DB_PASSWORD=your-password \
  betterdb/monitor:latest

Connecting to a database on your host machine? Inside the container localhost is the container itself, not your host — so use host.docker.internal as the database host. On Docker Desktop (macOS/Windows) it works out of the box; on Linux add --add-host=host.docker.internal:host-gateway to the docker run command so the name resolves. The dashboard's one-click "connect to local instance" button auto-detects this and pre-fills the right host for you.

Two image variants are published, both multi-arch (linux/amd64, linux/arm64):

TagWhat it is
latest, X.Y.Z-no-aiDefault image - every monitoring feature included, without the dependencies for the experimental local-LLM AI Helper
X.Y.ZAdds the experimental AI Helper (bring your own Ollama; disabled by default via AI_ENABLED)

See Docker Production Deployment for persistent storage, custom ports, licensing, and air-gapped setups.

Quick Start (Kubernetes / Helm)

helm repo add betterdb https://docs.betterdb.com/charts
helm repo update
helm install betterdb-monitor betterdb/betterdb-monitor \
  --namespace betterdb --create-namespace \
  --set db.host=my-valkey.default.svc.cluster.local \
  --set db.password=yourpassword

Then kubectl port-forward -n betterdb svc/betterdb-monitor 3001:3001 and open http://localhost:3001, or enable the chart's ingress. PostgreSQL-backed history, bring-your-own Secrets, and air-gapped licensing are all covered in the Kubernetes guide and the chart README.

Quick Start (CLI)

Run BetterDB Monitor without Docker:

npx @betterdb/monitor

On first run, an interactive setup wizard guides you through database connection, storage backend (SQLite, PostgreSQL, or in-memory), and server settings. Configuration is saved to ~/.betterdb/config.json.

npm install -g @betterdb/monitor   # global install
betterdb --setup                   # re-run setup wizard
betterdb --port 8080               # override server port
betterdb --db-host 1.2.3.4         # override database host
betterdb --help                    # all options

Requires Node.js >= 20.0.0 and a Valkey or Redis instance to monitor. For SQLite storage, also npm install -g better-sqlite3.


What You Get

See everything, keep everything

  • Historical analytics - query slowlogs, command patterns, client activity, and latency across any time range. The data that used to disappear after a log rotation.
  • COMMANDLOG support - Valkey 8.1+ exclusive. Large requests and large replies, not just the slow ones.
  • MONITOR capture sessions - record real traffic on demand: live tail, filter, replay, export to JSON/CSV, and cross-reference against connection history.
  • Hot key tracking - top keys by access frequency with rank movement over time. Key Analytics (Pro, free in early access) adds type, TTL, and size distributions from live sampling.
  • Cluster visibility - topology graphs, SLOT-STATS heatmaps, per-slot CPU and key distribution.
  • Cluster auto-registration - a cluster connection can auto-register every node as its own monitored connection, kept in sync as the cluster scales. See docs/cluster-auto-registration.md.
  • CPU & I/O thread metrics - per-thread visibility that no Redis tool can provide.
  • Client analytics - see exactly which service is responsible for what, attributed by client name and pattern.
  • ACL audit trail - track who accessed what, persisted for compliance and post-incident debugging.

Understand and act

  • Anomaly detection (Pro, free in early access) - automatic baseline learning with correlated events and plain-English diagnoses. 20+ detectors, no manual thresholds.
  • Capacity forecasting - projected time-to-ceiling for memory, ops/sec, CPU, and fragmentation.
  • Webhooks - HMAC-signed alert deliveries with retries and a full delivery log.
  • Live migration - move between Redis and Valkey with a three-phase analysis, execution, and validation workflow.

Built for the AI era

  • Vector search observability - FT.SEARCH ops/sec and latency with per-index health for valkey-search and RediSearch. See docs/vector-ai.
  • Inference latency - p50/p95/p99 per index, with SLA breach alerts (Pro, free in early access).
  • Semantic cache intelligence (Pro, free in early access) - hit-rate health, similarity-threshold recommendations, and an approve/reject proposal workflow. Agent memory observability included.
  • AI traces - OTLP span waterfalls from your AI application, correlated with the live Valkey state underneath each request. See docs/opentelemetry.md.

Plugs into everything

ツールをダウンロード