NcStatusCheck
Centralized monitoring for multiple Nextcloud instances
NcStatusCheck is a monitoring tool that lets you track the health of multiple Nextcloud servers from a single web interface: Nextcloud and PHP versions against their security floor, branch end of life, reachability, configuration warnings, installed apps, Docker containers and known vulnerabilities.

🎯 Features
Monitoring
- Three data collection modes per server: Basic (NC version only), Extended (full data via the serverinfo API) and Push (data sent by the remote instance)
- Version analysis for Nextcloud and PHP against a security floor that the cron keeps in sync with official releases, with a grace delay (
nc_update_grace_days) so an instance is only flagged a few days after a patch is released
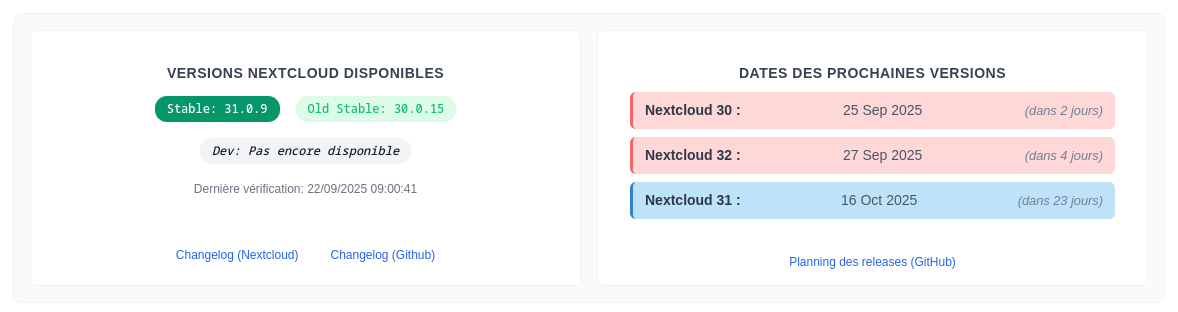
- Branch lifecycle: end of life of each Nextcloud branch (official schedule), next release dates, and how many of your servers run each branch
- Up/down tracking: current reachability plus a bounded journal of confirmed transitions, which feeds a 30-day availability % and an incident list
- SSL certificate expiry, read from the existing HTTPS probe (no extra request)
- Known vulnerabilities (opt-in): Nextcloud, Collabora and OnlyOffice advisories matched against the versions your fleet actually runs
- Installed apps audit: cross-checks
occ app:list against the Nextcloud app store (upgrade-blocking or incompatible apps, updates available, maturity and turbulence signals)
- Docker containers: stopped, restarting or unhealthy containers, and image updates checked against the registry tag catalogue (patch in your branch, newer branch). When several watched instances share a machine, containers are attributed to their own instance
- Proactive alerts (webhook and/or email): up/down state changes, plus slow signals (SSL expiry, vulnerable version, stale Push probe, critical audit report, blocking app finding, broken
occ). One alert per new condition, no reminder spam
- Pause a server (migration, decommissioning): probes and alerts are suspended, the row stays visible
- Desktop client watch: current version, release candidate in flight, measured release pace
Dashboard
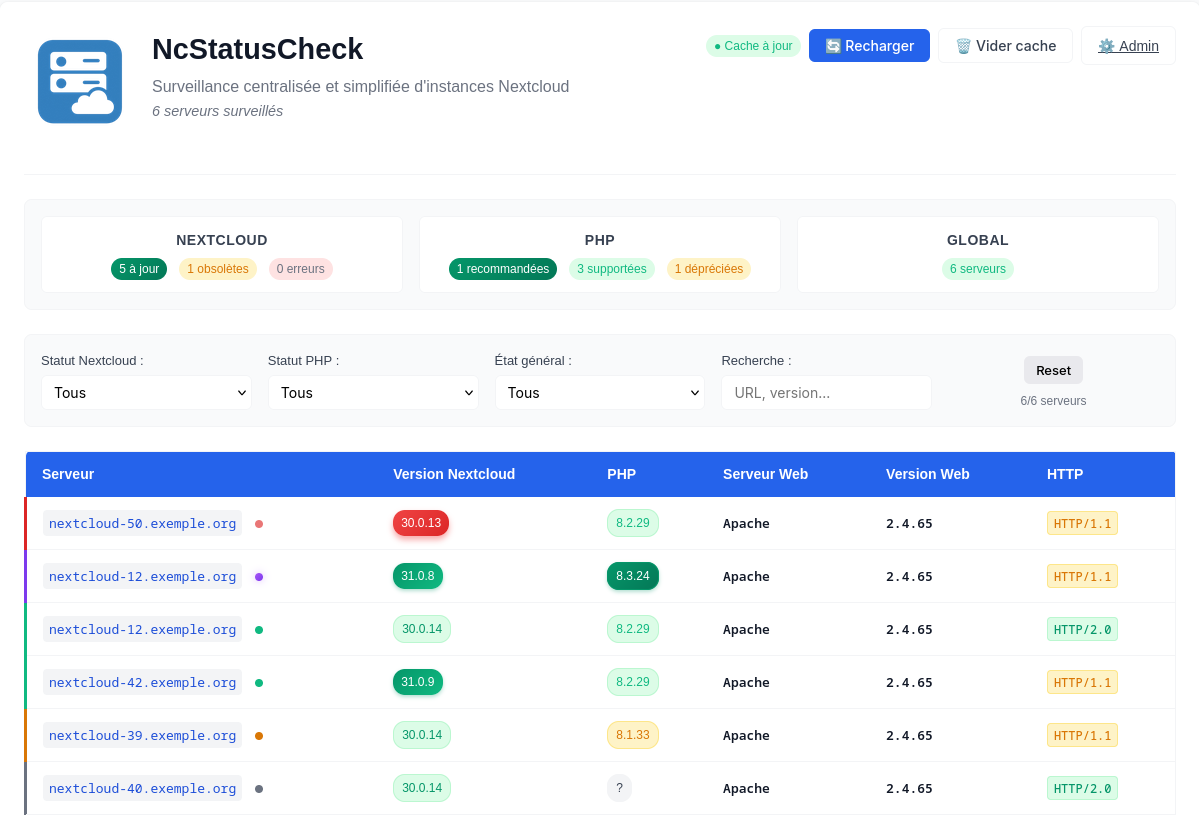
- Fleet table (Server | Nextcloud | PHP | Health) and branch lifecycle table side by side on wide screens
- Health column following "silence = all good": badges only when there is something to act on
- Synthesis cards: updates to apply, vulnerabilities, branch end of life, upcoming releases, active warnings, apps, Docker, desktop client. Each opens its details in a window
- Fleet watch for apps and Docker images, sorted by what you have to do: To review, To do, To plan, and a folded Context group
- Filters by Nextcloud status, PHP status, overall status (offline, maintenance, warnings, probe error, Docker updates…), Docker image and text search
- Tags under each server name, clickable to filter (several tags = all at once): your own tags (
client:durand, lab…), plus a 🖥 tag naming the machine when several monitored instances run on the same server (detected from Push, script v12+), one colour per machine. A tag written type:value takes the colour of its type, so every client:… tag shares one colour
- FR / EN / DE interface
Detail page
- State tiles above the tabs: reachability, 30-day availability (incident list in a window), SSL certificate, freshness of each probe
- Overview: version verdict, muted alerts (acknowledgements with their reason and expiry), instance summary (PHP, web server, database, cache, deployment, and satellite tools such as the office suite, Talk HPB or whiteboard, as seen from apps and containers), then issues grouped by area
- Tabs: technical information, applications, Docker containers, probes
- Tags under the URL, editable in place, with the other instances running on the same machine
- Every warning can be acknowledged (reason + optional expiry)
- Server audit report when the instance pushes its monthly
nc-audit.sh report
Administration
- Servers: add a server by its URL (
https:// optional), then configure its probes on its card (serverinfo token with a Test button, Push token and ready-to-use script generator), tag it, pause or remove it
- Shared hosts: say which Docker compose stack belongs to which instance when several watched Nextclouds share a machine
- NC / PHP versions: security floors, status rules, resync from official releases
- App warnings: a manual known-bug list
- Notifications: the effective alert configuration (set in
config.php, shown read-only) and a test button
- IP filtering: generates nginx / Apache / ufw allowlist rules
- Silences: audit of every acknowledgement across the fleet, and which ones still hide something
- Collection modes: help for the three probes
- "Trigger Push" button on the dashboard: asks every Push server to send its data at its next cron run
🏗️ Architecture
 jp.louvel/ncstatuscheck
