 lnfernux/log-horizon
Analizzatore di sorgenti di log per Microsoft Sentinel SIEM

<center>
<img width="500" src="https://assets.kitploit.com/production/public/readmes/13110/5c77f4fe02962fd0004a21eda7576c9eaa94dceec8f92c6317358723a3909ad9.png" />
</center>
### Microsoft Sentinel SIEM Log Source Analyzer


[](https://github.com/lnfernux/log-baseline/releases)
---
I've had to answer *"what are we actually getting out of these logs?"* or *"what is the recommended logs for Microsoft Sentinel"* more times than I can count. The answer always depend on so many things, but we can be generic. So I built this thingy right here.
**Log Horizon** connects to your Microsoft Sentinel workspace (and optionally Defender XDR), goes through every log table you're ingesting, and tells you whether you're getting security value from it or just burning money. It classifies tables, scores them against your detection rules, and gives you concrete recommendations with savings estimates.
> **Important**: This is a generic approach. If you know a log source is important to your environment, that context always takes precedence over what this tool tells you. The classifications are a starting point, not gospel.
**Want to read more? I have some posts about Log Horizon on my blog:**
1. [Tool Release: Log Horizon](https://infernux.no/blog/loghorizon-toolrelease/)
2. [Update: Log Horizon v0.5.0](https://infernux.no/blog/loghorizon-update1/)
3. [Building a practical log baseline and how Log Horizon helps you do that](https://infernux.no/blog/buildingapracticallogbaseline/)
4. [How to use Log Horizon](https://infernux.no/blog/loghorizon-howtouse/)
5. [Log Horizon 0.9.0](https://infernux.no/blog/loghorizon-0-9-0/)
## Features
| Feature | Description |
|---|---|
| **Classification Engine** | 510-entry knowledge base covering 260+ connectors, 22 categories, with lifecycle status (deprecated/legacy plus replacement tables) and automatic heuristic fallback for unknown tables |
| **Cost-Value Scoring** | Per-table cost tier vs detection tier matrix with combined assessment (High Value to Low Value), priced per observed plan (Analytics, Basic, Data Lake) |
| **Recommendations** | 14 prioritised action types: data lake or Basic candidates, zero-detection tables, XDR streaming waste, ingest-time filtering, split candidates, shared-table splits by source, plan usage, deprecated sources, retention shortfalls, XDR Checker and Detection Analyzer findings, each with savings estimates |
| **Detection Mapping** | Maps analytics rules, hunting queries, and XDR detections to each table to spot coverage gaps |
| **Correlation Tags** | Detects `#DONT_CORR#` / `#INC_CORR#` tags in rule descriptions and flags rules excluded from Defender correlation |
| **Retention Compliance** | Compares actual retention against recommended minimums based on industry standards and security best practices |
| **SOC Optimisation** | Pulls Microsoft's own SOC improvement recommendations from the Security Insights API |
| **Keyword Gap Analysis** | Flag tables you should be ingesting but aren't based on vendor/product keywords |
| **Transform Discovery** | Discovers Data Collection Rules (DCRs) targeting the workspace (subscription list filtered on destination, the workspace transformation DCR, and workspace associations), parses inline and multi-stage transforms, and labels every operation (filter, projection, column removal, enrichment, aggregation) |
| **Split Table Detection** | Identifies `_SPLT_CL` split tables and links them back to parent tables in the classification engine |
| **Split KQL Generator** | Generates portal-ready split KQL from a curated knowledge base, live rule analysis, and community field frequency stats -- condition-only format that pastes straight into the Sentinel split rule editor. Field lists are intersected with the table's live schema; anything not present is reported as dropped |
| **Detection Analyzer** | Scores analytic rules for potential noisiness using incident outcomes (auto-close ratio, false positive ratio, and incident volume percentiles) |
| **XDR Checker** | Adds an XDR-focused advisory layer: streaming coverage checks and one-year Data Lake retention guidance for XDR-related telemetry |
| **Custom Classifications** | Provide your own JSON to add or override the built-in classification database |
| **Collection Cache** | Collected workspace data is cached locally (default 60 minutes) so re-runs and re-exports take seconds; opt out with `-NoCache` |
| **Sovereign Clouds** | ARM, Log Analytics and Graph endpoints follow the signed-in Azure environment (public, US Government, China) |
| **Interactive TUI** | Spectre.Console dashboard with menus, colour-coded tables, drill-downs, retention wizard and ASCII art |
| **Export** | JSON, Markdown, or static HTML report for sharing with the team |
## Disclaimer
> [!CAUTION]
> **Disclaimer**
>
> **This tool is developed and maintained with the help of AI.** Please exercise caution when using this solution and always understand what are you running before you run it in production. The developer assumes no liability for any vulnerabilities or issues.
>
> By downloading, installing, or using this tool, you acknowledge that you have read, understood, and agree to these terms.
>
## Prerequisites
| What you need | Version |
|---|---|
| PowerShell | 7.0+ |
| Az modules | `Az.Accounts` |
| Other modules | `PwshSpectreConsole` 2.6.3+ |
| Optional | `Microsoft.Graph.Authentication` (for `-IncludeDefenderXDR` as a signed-in user) |
Endpoints follow the Azure environment of the current `Connect-AzAccount` session, so Azure Government and Azure China workspaces work without extra parameters. The public cloud values are used when no environment is available.
If you're not already logged into Azure, the module will fire up `Connect-AzAccount` for you. If you are, it'll just carry on.
Permissions: Log Analytics Reader and Microsoft Sentinel Reader on the workspace cover the analysis. Transform discovery also needs `Microsoft.Insights/dataCollectionRules/read` (Monitoring Reader) on the subscription or resource group; without it the run continues and prints a warning naming the missing permission. `-IncludeDefenderXDR` uses Microsoft Graph with `CustomDetection.Read.All`, which for a signed-in user means the optional `Microsoft.Graph.Authentication` module.
## Getting started
Pretty straight forward:
```powershell
# Grab the dependencies
Install-Module -Name Az.Accounts -Scope CurrentUser
Install-Module -Name PwshSpectreConsole -Scope CurrentUser
# Clone and import
git clone https://github.com/lnfernux/log-horizon
Import-Module ./log-horizon/LogHorizon.psd1
```
## Usage
### The basics
Start by connecting to Azure and making sure you select the right account and subscription:
```powershell
Connect-AzAccount
```
Then we can invoke the tool:
```powershell
Invoke-LogHorizon -SubscriptionId '00000000-0000-0000-0000-000000000000' -ResourceGroup 'rg-sentinel' -WorkspaceName 'my-sentinel-ws'
```
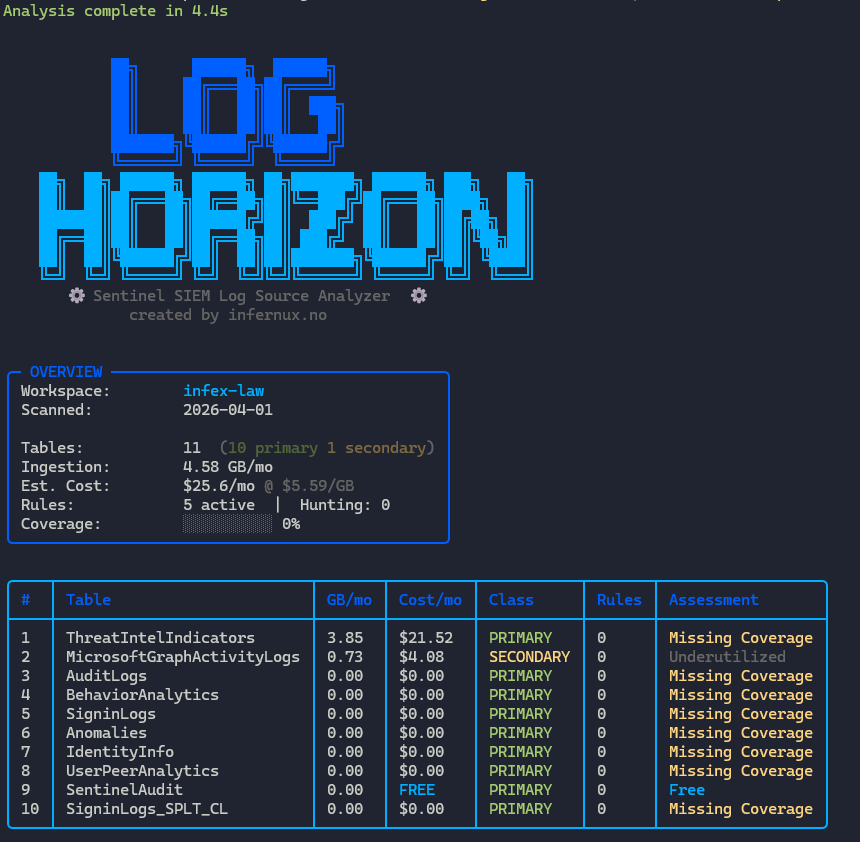
Output should look something like this:
<img width="860" height="842" alt="{F4FFA929-B24F-490C-BD3D-F75E214BCD93}" src="https://assets.kitploit.com/production/public/readmes/13110/ff9d1da85043d02a216df72913ecf63520310b8d820b1bd1278b8e4aca718494.png" />
Also has a menu to dig deeper into other outputs:
<img width="395" height="223" alt="{83CE9E6E-F373-49CD-BE05-182DB69F36BE}" src="https://assets.kitploit.com/production/public/readmes/13110/0606a575b10640bd13ebb87b930f74b2438167b5578cb843b412b4fcf273fc26.png" />
### Keyword gaps + Defender XDR
Want to know if you're missing tables related to specific vendors? Throw in some keywords. Add `-IncludeDefenderXDR` if you want the XDR analysis too.
```powershell
Invoke-LogHorizon -SubscriptionId '...' -ResourceGroup 'rg' -WorkspaceName 'ws' -Keywords 'CrowdStrike','AWS','Okta' -IncludeDefenderXDR
```
### Detection Analyzer
Enable rule quality/noise analysis based on incidents and automation rules:
```powershell
Invoke-LogHorizon -SubscriptionId '...' -ResourceGroup 'rg' -WorkspaceName 'ws' -IncludeDetectionAnalyzer -DetectionLookbackDays 90
```
### Export a report
```powershell
# JSON
Invoke-LogHorizon -SubscriptionId '...' -ResourceGroup 'rg' -WorkspaceName 'ws' -Output json -OutputPath ./report.json
# Markdown
Invoke-LogHorizon -SubscriptionId '...' -ResourceGroup 'rg' -WorkspaceName 'ws' -Output markdown -OutputPath ./report.md
# Static HTML (self-contained, no JS, works offline)
Invoke-LogHorizon -SubscriptionId '...' -ResourceGroup 'rg' -WorkspaceName 'ws' -Output html -OutputPath ./report.html
# Auto-generate timestamped filename by pointing at a directory
Invoke-LogHorizon -SubscriptionId '...' -ResourceGroup 'rg' -WorkspaceName 'ws' -Output html -OutputPath ./reports/
```
### Manage table retention and type
You can now update table retention and table type directly from the interactive TUI:
- Open `Invoke-LogHorizon` normally, then choose **Manage table retention and type** from the main menu for bulk retention or type updates.
- Open **Log Tuning / Transforms** > **Evaluate specific table** and choose **Manage retention/type for this table** for a single-table change.
For scripting or automation, use the dedicated public command:
```powershell
# Preview a single-table change (prints a Table / Plan / Interactive / Total / Status / Reason table, applies nothing)
Set-LogHorizonTableRetention -SubscriptionId '...' -ResourceGroupName 'rg' -WorkspaceName 'ws' `
-TableName 'SigninLogs' -TotalRetentionInDays 365 -WhatIf
# Switch tables to Basic and set total retention
Set-LogHorizonTableRetention -SubscriptionId '...' -ResourceGroupName 'rg' -WorkspaceName 'ws' `
-TableName 'AzureDiagnostics','VMConnection' -TargetPlan Basic -TotalRetentionInDays 730
# Use -1 for inherit/default semantics
# RetentionInDays = inherit workspace default
# TotalRetentionInDays = remove long-term retention
Set-LogHorizonTableRetention -SubscriptionId '...' -ResourceGroupName 'rg' -WorkspaceName 'ws' `
-TableName 'SigninLogs' -RetentionInDays -1 -TotalRetentionInDays -1
```
### Non-interactive / CI mode
Skip the interactive TUI and export straight to a file, useful for pipelines or scheduled runs:
```powershell
Invoke-LogHorizon -SubscriptionId '...' -ResourceGroup 'rg' -WorkspaceName 'ws' -NonInteractive -Output json -OutputPath ./reports/
```
If you omit `-Output`, the analysis object is returned to the pipeline so you can pipe it into your own logic.
### Collection cache
The data collection phase (usage, rules, incidents, tables, DCRs) is cached by default so re-running against the same workspace, for example to export a second format or to reopen the TUI, takes seconds instead of minutes. The cache lives under `$env:LOCALAPPDATA\LogHorizon\cache` (override with `-CachePath`), one file per combination of subscription, resource group, workspace, `-DaysBack`, `-DetectionLookbackDays`, `-IncludeDefenderXDR`, `-IncludeDetectionAnalyzer`, `-SkipSharedSources`, the three price parameters and the module version. Entries older than `-CacheMaxAgeMinutes` (default 60) are ignored, and every save deletes expired entries so the folder does not accumulate files from other parameter sets or older versions. Tokens are never written to the cache; authentication runs on every invocation so the retention wizard always has live credentials.
The cache file is plaintext Clixml. With `-IncludeDetectionAnalyzer` it contains incident titles, numbers, status and classification from your workspace; incident owners, rule authors and assigned-owner identities are not collected. Use `-NoCache` on shared machines or point `-CachePath` at a location with the access control you need.
```powershell
# Force a fresh collection and refresh the cache
Invoke-LogHorizon -SubscriptionId '...' -ResourceGroup 'rg' -WorkspaceName 'ws' -RefreshCache
# Never read or write the cache
Invoke-LogHorizon -SubscriptionId '...' -ResourceGroup 'rg' -WorkspaceName 'ws' -NoCache
# Accept cached data for up to a day
Invoke-LogHorizon -SubscriptionId '...' -ResourceGroup 'rg' -WorkspaceName 'ws' -CacheMaxAgeMinutes 1440
```
### Log tuning and split KQL
The interactive TUI includes a **Log Tuning / Transforms** menu with live tuning suggestions (field usage from your deployed rules and hunting queries), knowledge-base split KQL, and a per-table evaluator. Every KQL block is condition-only and pastes straight into the Sentinel split rule editor, with source attribution (knowledge base, rule analysis, or combined).
### Custom pricing
Default prices are West Europe Simplified PAYG in USD: 5.59 $/GB Analytics, 1.15 $/GB Basic, 0.20 $/GB Data Lake (0.065 ingestion + 0.13 processing, rounded). Each table is priced by the plan observed in the `Usage` table, and free status comes from `Usage.IsBillable`. Volumes use billing GB (1000 MB). If your commitment tier is different:
```powershell
Invoke-LogHorizon -SubscriptionId '...' -ResourceGroup 'rg' -WorkspaceName 'ws' -PricePerGB 4.61 -BasicPricePerGB 1.15 -LakePricePerGB 0.20
```
### All parameters
| Parameter | Type | Required | Default | Description |
|---|---|---|---|---|
| `-SubscriptionId` | string | Yes | - | Azure subscription ID |
| `-ResourceGroup` | string | Yes | - | Resource group containing the Sentinel workspace |
| `-WorkspaceName` | string | Yes | - | Log Analytics workspace name |
| `-WorkspaceId` | string | No | - | Workspace ID (auto-resolved if omitted) |
| `-Output` | string | No | - | Export format: `json`, `markdown` / `md`, or `html` (alias `-o`) |
| `-OutputPath` | string | No | - | File or directory path for export. An existing directory or a trailing separator gets a timestamped file name; a file name without an extension gets the format's extension; missing directories are created |
| `-Keywords` | string[] | No | - | Keywords for gap analysis (e.g. `'AWS','CrowdStrike'`, alias `-kw`) |
| `-IncludeDefenderXDR` | switch | No | - | Include Defender XDR custom detection analysis |
| `-IncludeDetectionAnalyzer` | switch | No | - | Include per-rule noisy detection analysis using incidents and automation rules |
| `-SkipSharedSources` | switch | No | - | Skip the per-source volume query on `CommonSecurityLog` and `Syslog` (one 7-day scan per table) |
| `-DetectionLookbackDays` | int | No | 90 | Query window for incident/automation-based detection analysis (1-365 days) |
| `-DaysBack` | int | No | 90 | Query window for usage data (1-365 days) |
| `-PricePerGB` | decimal | No | 5.59 | Sentinel Analytics tier ingestion price per GB (alias `-ppgb`) |
| `-BasicPricePerGB` | decimal | No | 1.15 | Basic Logs price per GB |
| `-LakePricePerGB` | decimal | No | 0.20 | Auxiliary / Data Lake tier price per GB (ingestion + processing) |
| `-NonInteractive` | switch | No | - | Skip the TUI dashboard and export directly (or return data to pipeline if `-Output` is omitted) |
| `-CustomClassificationPath` | string | No | - | Path to a custom JSON file to add or override classifications (alias `-clf`) |
| `-NoCache` | switch | No | - | Do not read or write the collection cache |
| `-RefreshCache` | switch | No | - | Collect fresh data and overwrite the cache entry |
| `-CacheMaxAgeMinutes` | int | No | 60 | Maximum age of a cache entry to reuse (1-10080) |
| `-CachePath` | string | No | `$env:LOCALAPPDATA\LogHorizon\cache` | Directory for cache files |
---
## Under the hood
So there's four phases.
### 1. Data collection
The module connects to Azure and pulls data from the Log Analytics, Security Insights, Azure Monitor and Microsoft Graph APIs. Every call goes through a retry wrapper (429, 5xx and transport errors) and, unless `-NoCache` is set, the collected data is cached locally for the next run.
| Data Source | API | What we grab |
|---|---|---|
| Table usage | `Usage` table (KQL) | Ingestion volume, plan and billable flag per table over your query window |
| Analytics rules | Security Insights REST | Active detection rules + which tables they hit + correlation tags, plus implicit table consumers for non-KQL rule kinds |
| Hunting queries | Log Analytics saved searches REST | Saved hunting queries + referenced tables |
| Data connectors | Security Insights REST | Installed connector inventory |
| SOC optimisation | Security Insights REST (preview) | Microsoft's built-in SOC recommendations |
| Table retention | Log Analytics Tables REST | Per-table retention, archive, plan (Analytics/Basic/Auxiliary), inherited-default flags and schema columns |
| Data collection rules | Azure Monitor REST | DCRs targeting the workspace (subscription list, workspace transformation DCR, associations) and their transforms |
| Defender XDR | Microsoft Graph | XDR custom detection rules (optional; delegated `CustomDetection.Read.All` or an Az Graph token) |
| Incidents | Security Insights REST | Incident outcomes (status/classification), timing, and rule-linking hints for rule quality scoring |
| Automation rules | Security Insights REST | Rule-level close-incident actions and title matching conditions for auto-close attribution |
| SentinelHealth | Log Analytics KQL | Automation rule run events with incident numbers for definitive auto-close attribution (optional, requires health monitoring) |
### 2. Classification
Every table gets classified through two passes:
**First**, a direct lookup against the 510-entry knowledge base in `Data/log-classifications.json`. Each entry carries the connector name, primary/secondary classification, security category, MITRE data source mappings, a recommended pricing tier and retention, and optional lifecycle flags (deprecated/legacy with replacement tables, XDR streamability, platform).
**If there's no match**, heuristic rules kick in, in this order:
- Name contains a security token such as `Alert`, `Incident`, `Threat`, `Signin`, `Logon`, `Audit`, `Risk`, `Detection` (matched at PascalCase word starts) -> **primary**
- Name looks like infra telemetry: `Flow`, `Metric`, `Diagnostic`, `Perf`, `Heartbeat`, `Health`, `Inventory`, `Usage` -> **secondary**
- Has active analytics rules pointing at it -> **primary**
- Built-in table with a Microsoft prefix (`AAD`, `Microsoft`, `Azure`, `Defender`, `Purview`, `Entra`, `Sentinel`, `Office`, `Intune`, `Windows` ...) -> **primary**, flagged for review and addition to the database
- Generic `*Log`/`*Logs` name -> **secondary**
- High volume (>10 GB/mo) with nothing detecting on it -> **secondary**
- None of the above -> **unknown**
### 3. Cost-value scoring
Each table gets scored on a few dimensions:
- **Cost tier**: Free / Low (<1 GB) / Medium (1-10 GB) / High (10-50 GB) / Very High (>50 GB)
- **Detection tier**: None / Low (1-2 rules) / Medium (3-9 rules) / High (10+ rules)
- **Assessment**: High Value / Good Value / Missing Coverage / Optimize / Low Value / Underutilized / Free Tier / Platform
- **Coverage %**: Percentage of tables with at least one analytics rule or hunting query referencing them, calculated as `tablesWithRules / totalTables * 100`. Per-table coverage sums analytics rules + hunting queries found by parsing KQL for table names. A rule that calls a solution parser (for example `ADOAuditLogs`) counts toward the parser's source tables, read from `parsers` in `field-frequency-stats.json`.
- **Implicit coverage**: Rule kinds that carry no KQL still consume tables. `Data/implicit-consumers.json` maps them (Threat Intelligence matching -> `ThreatIntelIndicators`/`ThreatIntelObjects`, Fusion -> `SecurityAlert`/`Anomalies`, UEBA -> `BehaviorAnalytics`/`UserPeerAnalytics`/`IdentityInfo`, Microsoft incident creation -> `SecurityAlert`). Enabled rules of those kinds count toward effective coverage, and each table reports a `CoverageSource` of `kql`, `xdr`, `implicit`, `platform` or `none`. Platform tables Sentinel writes for itself (`SecurityIncident`, `SentinelHealth`, `Watchlist`, `Usage` ...) are never flagged as missing coverage and get the `Platform` assessment.
- Only enabled analytics rules and enabled Defender custom detections count toward coverage.
Then the module generates recommendations (14 types):
| Type | When it fires | What to do |
|---|---|---|
| **Data Lake** | Secondary + high cost + few detections, and the table supports the Auxiliary plan (falls back to a Basic plan suggestion when only Basic is supported) | Move to Auxiliary/Data Lake tier; savings are current cost minus the same volume at the lake (or Basic) rate |
| **Low Value** | High cost + zero detections | Add rules, filter, or move to data lake |
| **XDR Optimise** | XDR-streamed + 0 Sentinel rules + XDR rules exist | Stop streaming, use the unified XDR portal instead |
| **Missing Coverage** | Primary + zero detections (not platform tables) | Write analytics rules to get value from the data |
| **Ingest-time Filter** | Primary + >20 GB + <=3 detections | Apply ingest-time transformation to cut volume |
| **Split Candidate** | Primary + high volume + detections + no existing transform | Split the table so high-value rows stay on Analytics and the rest goes to Data Lake |
| **Shared Table Split** | `CommonSecurityLog` or `Syslog` on the Analytics plan carries at least 1 GB/mo of sources the baseline recommends for the data lake, measured per source over a 7-day sample | Apply the composed split condition from **Log Tuning / Transforms > Shared table sources**. It keeps the rows matched by where-conditions of enabled rules on the table and replaces the generic split estimate for that table |
| **Plan Usage** | Usage rows show more than one plan, or the configured plan differs from what Usage observed | Review whether the plan transition was expected |
| **Deprecated Source** | A table marked deprecated or legacy in the database is still ingesting | Migrate detections to the replacement tables, then retire the old connector. Informational: no savings are claimed because the ingestion moves rather than disappears |
| **Retention Shortfall** | Workspace or table retention below the 90-day baseline | Increase total/archive retention to meet regulatory guidance |
| **Retention Improvement** | Paid, non-platform table meets 90d but sits below the category recommendation | Consider longer total retention |
| **Interactive Below Baseline** | Analytics table with interactive (hot) retention under 90 days | Raise interactive retention to the 90 days Sentinel includes, unless the short hot window is deliberate |
| **XDR Checker** | Known Defender XDR table not streamed, streamed without coverage, not forwarded to Data Lake, or below the one-year advisory | Review streaming and retention for XDR telemetry |
| **Detection Analyzer** | Rule scores >= 70 with at least 5 incidents, or has at least 5 closed incidents of which 80% or more were auto-closed by automation or closed as false positive (with `-IncludeDetectionAnalyzer`) | Tune or disable the noisy rule |
Recommendations are sorted once, High > Medium > Low and then by estimated savings, and every output (JSON, Markdown, HTML, TUI) keeps that order.
### 4. Detection Analyzer (noisiness scoring)
When you pass `-IncludeDetectionAnalyzer`, the module fetches recent incidents and automation rules, then scores every enabled analytics rule for potential noisiness.
**Per-rule metrics** (computed from incident data):
| Metric | How it's calculated |
|---|---|
| Incidents total | Count of incidents linked to the rule |
| AutoClose ratio | Incidents closed by automation rules ÷ closed incidents. Primary source: SentinelHealth table (automation rule runs by enabled close-incident or playbook rules, matched on incident number). Fallback: automation rule condition matching (analytic rule id, title and severity conditions, ANDed like Sentinel does). Rules whose conditions are only status/tactics/entities are treated as applying to every incident. With no enabled close rules, incidents closed within 5 minutes also count. |
| FalsePositive ratio | Incidents classified as false positive ÷ closed incidents |
**Noisiness score formula**:
Each metric is converted to a percentile rank across all rules that have at least one incident. The composite score is a weighted blend:
```
Score = (Volume_percentile × 0.35) + (AutoClose_percentile × 0.40) + (FalsePositive_percentile × 0.25)
```
- **Volume percentile (35%)**: how many incidents a rule generates relative to other rules.
- **AutoClose percentile (40%)**: how often incidents are auto-closed by automation rules (highest weight because automated closure is the strongest signal of low-value alerts).
- **FalsePositive percentile (25%)**: how often analysts classify the outcome as false positive.
**Score thresholds**:
| Score | Label | Meaning |
|---|---|---|
| ≥ 70 | Noisy | Rule likely needs tuning or disabling |
| ≥ 50 | Watch | Rule shows early signs of noisiness |
| < 50 | Healthy | Rule is within normal range |
| N/A | - | Rule has no correlated incidents, or fewer than 3 rules have incidents so there is nothing to rank against |
Incidents are bucketed by analytic rule id (falling back to rule name, then title), so two rules sharing a display name are scored separately.
Rules with a score ≥ 70 and at least 5 incidents are automatically surfaced as **High-priority recommendations** in the Recommendations view. So are rules with at least 5 closed incidents where 80% or more were auto-closed by automation (SentinelHealth or a matching close rule, not the 5-minute timing fallback) or closed as false positive. That ratio rule needs no population, so it still applies when fewer than 3 rules have incidents and the score is N/A.
### 5. Interactive dashboard
The main menu offers these views:
- **Dashboard**: overview stats, top 10 costliest tables (deprecated and legacy sources carry a badge), coverage bar, retention compliance summary, correlation exclusion callout
- **View Recommendations**: prioritised actions with estimated monthly savings, expandable to show the full list when there are more than 10
- **View Detection Assessment**: cost-value matrix summary, per-table rule and hunting query coverage, primary/secondary drill-down, correlation-excluded rule listing
- **View Detection Analyzer**: percentile-based noisy rule ranking with closure quality indicators (when you used `-IncludeDetectionAnalyzer`), searchable rule browser
- **View SOC Optimization**: Microsoft's own improvement suggestions with drill-down
- **View Retention Assessment**: tables below recommended minimums with current vs recommended retention, plan type, and shortfall, plus XDR advisory rows
- **View Data Transforms**: DCR transform inventory with transform type classification and full KQL per table
- **Log Tuning / Transforms**: live tuning suggestions, knowledge-base split KQL, and a per-table evaluator with a single-table retention/type change
- **View All Tables**: the full list with classification, plans, cost, rules, retention (colour-coded), and assessment; pick a table for a detail panel (coverage sources, plan support, retention, status, its recommendations)
- **Manage table retention and type**: bulk retention and plan wizard with preview and apply
- **Dictionary**: every term the tool uses (classification, cost and detection tiers, assessments, coverage sources, the 14 recommendation types, Detection Analyzer metrics and score labels, table plans, lifecycle status, XDR states, transform types) with the same definitions as this README, served from `Data/dictionary.json`
- **Export Report**: pick a format, then a path (directory for a timestamped file, or a file name; Enter keeps the current directory) and write JSON, Markdown or HTML right from the menu
- **XDR Analysis** appears on the dashboard when you used `-IncludeDefenderXDR`
---
## The classification database
Sitting at `Data/log-classifications.json`. **510 entries**, **263 connectors**, **22 categories**.
The canonical data is maintained in [log-baseline](https://github.com/lnfernux/log-baseline). A scheduled workflow checks for a newer log-baseline release once a day and opens a dependency pull request when it finds one. After review and merge, the versioned snapshot is bundled under `Data/`, so installations from PowerShell Gallery are self-contained and do not download baseline data at runtime. The bundled version, source commit, and checksums are recorded in `Data/baseline-version.json`. To vendor a release by hand, run `./scripts/Update-LogBaseline.ps1 -ArchivePath <log-baseline-x.y.z.zip>`.
### What's in each entry
| Field | What it holds |
|---|---|
| `tableName` | Log Analytics table name (`SecurityEvent`, `SigninLogs`, etc.) |
| `connector` | Which data connector produces this table |
| `classification` | `primary` (security value) or `secondary` (supporting telemetry) |
| `category` | Security category: Identity & Access, Network Security, etc. |
| `description` | Plain-English summary of what's in the table |
| `keywords` | Terms for keyword gap analysis matching |
| `mitreSources` | MITRE ATT&CK data source mappings |
| `recommendedTier` | `analytics` (hot tier) or `datalake` (auxiliary candidate) |
| `recommendedRetentionDays` | Minimum recommended total retention in days (regulatory guidance) |
| `isFree` | Whether Microsoft ingests this one for free (runtime uses `Usage.IsBillable` first) |
| `status` | Optional. `deprecated` (connector retired or ingestion stopped) or `legacy` (older collection path with a documented successor) |
| `replacedBy` | Optional. Table names to migrate to; present whenever `status` is set (may be empty) |
| `xdrStreamable` | Optional, Defender tables only. `true` for the 21 tables the Defender XDR connector streams; `false` for portal-only and TVM tables |
| `platform` | Optional. `true` for tables Sentinel itself consumes (`SecurityIncident`, `Usage`, `Watchlist`, ...) which never need analytics rules |
Tables with a `status` show a badge in the TUI and the reports, and any that still ingest raise a `DeprecatedSource` recommendation naming the replacement. Tables with `xdrStreamable: false` are never treated as XDR streaming candidates by the XDR Checker.
### Primary vs secondary security data
**Primary** (298 entries): the tables you're actually building detections on. Sign-in logs, security alerts, threat intel, audit trails, vulnerability findings, firewall hits, EDR telemetry.
**Secondary** (212 entries): supporting stuff. Perf metrics, infrastructure diagnostics, network flow volumes, inventory snapshots, config baselines, health checks.
### Categories at a glance
| Category | Count | Examples |
|---|---|---|
| Identity & Access | 56 | `SigninLogs`, `MicrosoftServicePrincipalSignInLogs`, `OktaSSO` |
| Network Security | 51 | `AZFWNetworkRule`, `NSPAccessLogs`, `DarktraceModelAlerts_CL` |
| Cloud Control Plane | 37 | `AzureActivity`, `AZKVAuditLogs`, `GoogleWorkspaceReports` |
| Network Flow | 37 | `NTANetAnalytics`, `CommonSecurityLog`, `AZFWFatFlow` |
| Endpoint Detection | 33 | `DeviceProcessEvents`, `CrowdStrikeAuditEvents`, `SentinelOneAlertsV2_CL` |
| Email Security | 33 | `EmailEvents`, `CampaignInfo`, `Ttp_Url_CL` |
| Security Alerts | 32 | `SecurityAlert`, `SentinelBehaviorInfo`, `DisruptionAndResponseEvents` |
| Application Logs | 32 | `AppServiceHTTPLogs`, `AppServiceAuditLogs`, `DynatraceAttacksV2_CL` |
| Vulnerability Mgmt | 23 | `DeviceTvmSoftwareVulnerabilities`, `Rapid7InsightVMCloudVulnerabilities` |
| Cloud Security | 21 | `EnrichedMicrosoft365AuditLogs`, `OAuthAppInfo`, `PowerAppsActivity` |
| Endpoint Telemetry | 18 | `DeviceInfo`, `Windows365NetworkLogs`, `SentinelOneAgents_CL` |
| Posture Management | 18 | `ExposureGraphNodes`, `SecurityNestedRecommendation`, `ZTSMetadata` |
| Data Security | 17 | `PurviewDataSensitivityLogs`, `DataSecurityEvents`, `PowerPlatformDlpActivity` |
| Data Platform | 16 | `SQLSecurityAuditEvents`, `CDBControlPlaneRequests`, `SnowflakeLogin_CL` |
| Threat Intelligence | 15 | `ThreatIntelIndicators`, `ThreatIntelObjects`, `CybleVisionAlerts_CL` |
| Infrastructure Diag | 14 | `AzureMetrics`, `AGWPerformanceLogs`, `ContainerAppSystemLogs` |
| Platform Health | 14 | `SentinelHealth`, `Usage`, `SecurityCaseEvent` |
| Container & K8s | 13 | `AKSAudit`, `CloudProcessEvents`, `GKEAudit` |
| Configuration Mgmt | 12 | `ConfigurationData`, `AVNMRuleCollectionChange` |
| SAP Security | 8 | `ABAPAuditLog`, `SAPBTPAuditLog_CL`, `Onapsis_Defend_CL` |
---
[Read more](https://github.com/lnfernux/log-horizon)