 d3vhex/sentora
An open-source, self-hosted AI-powered SIEM, EDR and SOAR platform for modern security operations.



Self-hosted security stack for small/mid teams that don't have a dedicated
SOC. Drop an agent on each endpoint, point them at the server, and you get
SIEM logs, file integrity, package vulnerabilities, an OpenSearch-powered
log explorer, autonomous AI triage and a SOAR playbook engine, all in one
docker compose up.
The "AI" part is a locally-running Ollama model (default llama3.2:3b).
Logs never leave the box; there's no OpenAI key, no Anthropic key, no
phone-home. If you want a smarter model and have the RAM, swap it in .env.
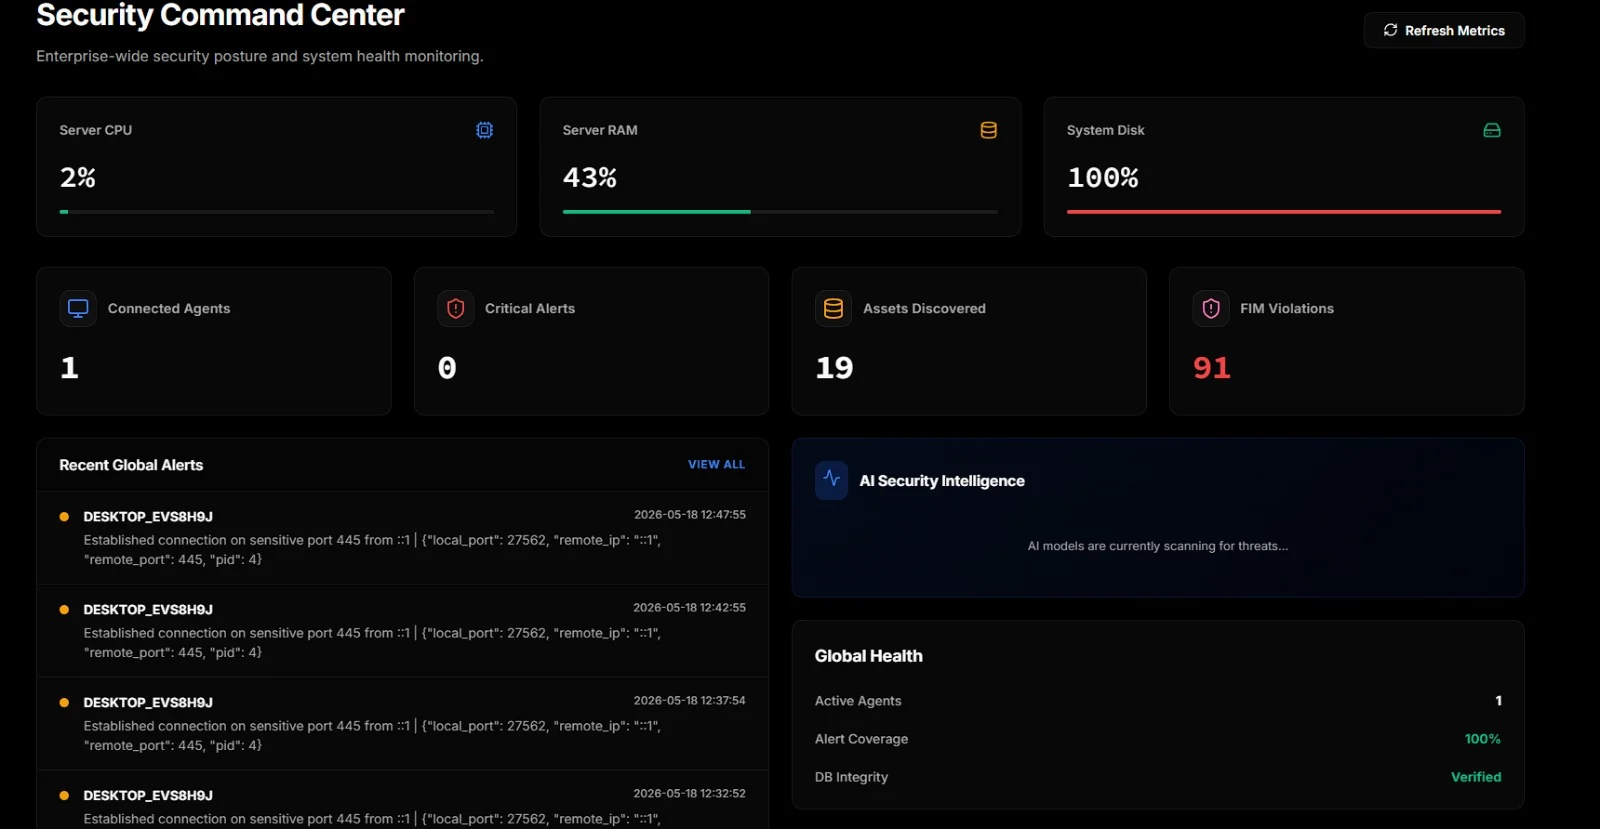
Collects telemetry from Windows and Linux agents over a single TCP channel. SIEM events, alerts, FIM, packages, network connections, open ports, Docker activity, screen frames.
Detects with Sigma rules, on the endpoint. 43 rules covering 47 MITRE
ATT&CK techniques ship in conf/sigma/builtin/; drop community rulesets in
beside them. Sigma matches named fields rather than text, so
Image|endswith: '\vssadmin.exe' cannot be defeated by the word "vssadmin"
appearing in an unrelated message — and
CommandLine|utf16le|base64offset|contains reads inside a base64
-EncodedCommand payload, where the plaintext command line shows only the
wrapper. Measured on the eval corpus: 9 of 10 attacks caught by Sigma alone,
0 of 9 hard negatives falsely flagged. This layer is deterministic and keeps
working when the model is unavailable.
Correlates across events, which no per-event rule can do. A single failed
logon is routine; five accounts failing from one source in forty seconds is a
password spray, and looking at any one of those five events will never tell
you that. Covers spray, brute force, a success arriving after repeated
failures, and bursts of account creation or service installs — on both
platforms, from Windows event IDs or from parsed auth.log lines.
Runs at two vantage points, because they see different attacks. Per host on the agent, where an attack against one machine is visible in full. And across hosts in the ingest path, where a spray walked one failure at a time over fifty machines shows up — no single agent sees more than one event, and that is the more competent attack, since spraying wide and shallow stays under both per-account lockout and per-host thresholds.
Total coverage with Sigma: 51 techniques. Every window fires once rather than once per event, and every counter is bounded — a counter keyed on an attacker-supplied username is a memory exhaustion primitive, not a detection.
Maps detections to MITRE ATT&CK, from the rules themselves. Rules carry
tags: attack.t1490, so there is no hand-kept mapping table to go stale. The
coverage page separates three states a single "coverage %" would hide:
covered and seen, covered and quiet, and not covered at all — the last
being the only one where the console's silence means nothing.
Triages every event with a local LLM. Three workers run in parallel:
one watches every incoming event in real time, one runs operator-driven
deep scans, and one decides whether to take a defensive action
(BLOCK_IP, ISOLATE_HOST, KILL_PROCESS, etc.).
Shadow mode for the defensive worker. Flip AI_SHADOW_MODE=1 and
every autonomous verdict is staged for human approval in the SOAR Hub
instead of being dispatched. Useful for tuning the model on real
traffic before letting it act on its own.
Indexes everything in OpenSearch so you can grep your fleet with fuzzy / exact / starts-with queries from one place.
Runs SOAR playbooks built in a small visual editor with multi-step, per-node result tracking, can be triggered manually or by AI verdict.
Vulnerability scans every agent's installed packages against OSV (online or via an internal mirror).
Pulls threat-intel feeds from abuse.ch (Feodo, ThreatFox, URLhaus) into a local indicator table, with staleness pruning and an air-gap switch.
Validates agent configs before pushing them. YAML parse, structural shape and regex compilation — an invalid regex is valid YAML and silently disables the rule containing it.
Built-in remote desktop via WebSocket JPEG streaming, no separate VNC install needed on the endpoint.
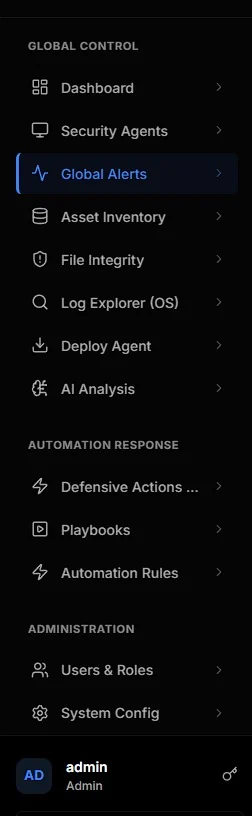
The sidebar groups everything into three sections: telemetry (dashboard, agents, alerts, assets, FIM, logs, AI), automation response (defensive actions, playbooks, automation rules), and administration.
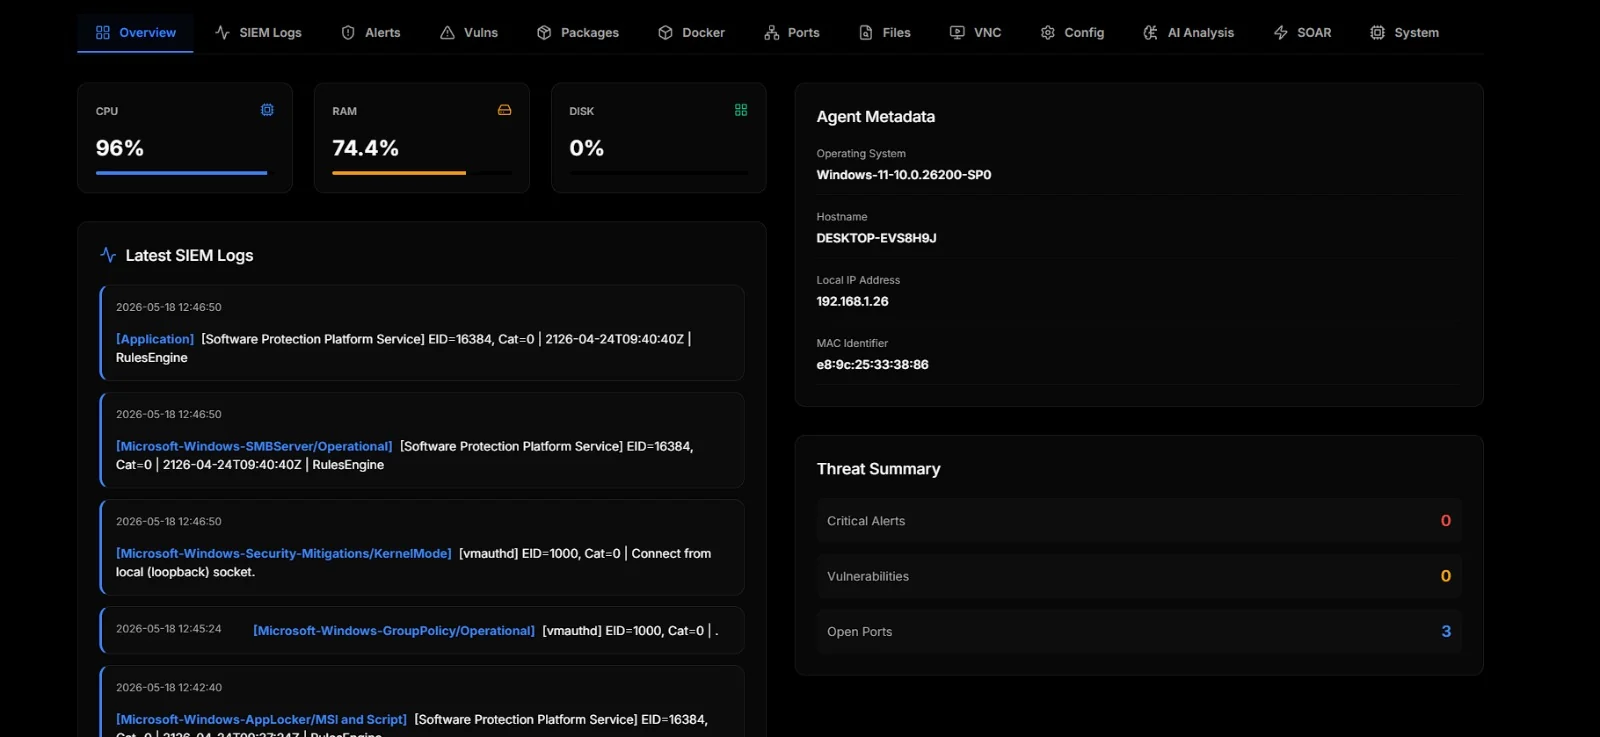
Each enrolled agent has its own page with twelve tabs. The overview shows live resource meters, the most recent SIEM logs, agent metadata and a threat summary:
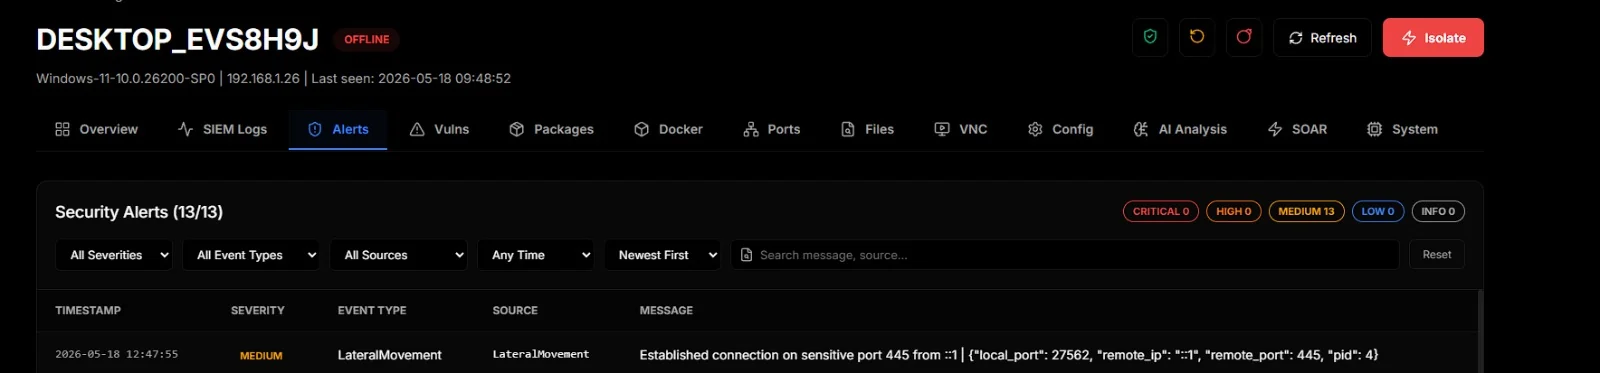
Alerts are everything the agent's own correlation rules already flagged. Severity-coloured, filterable, searchable:
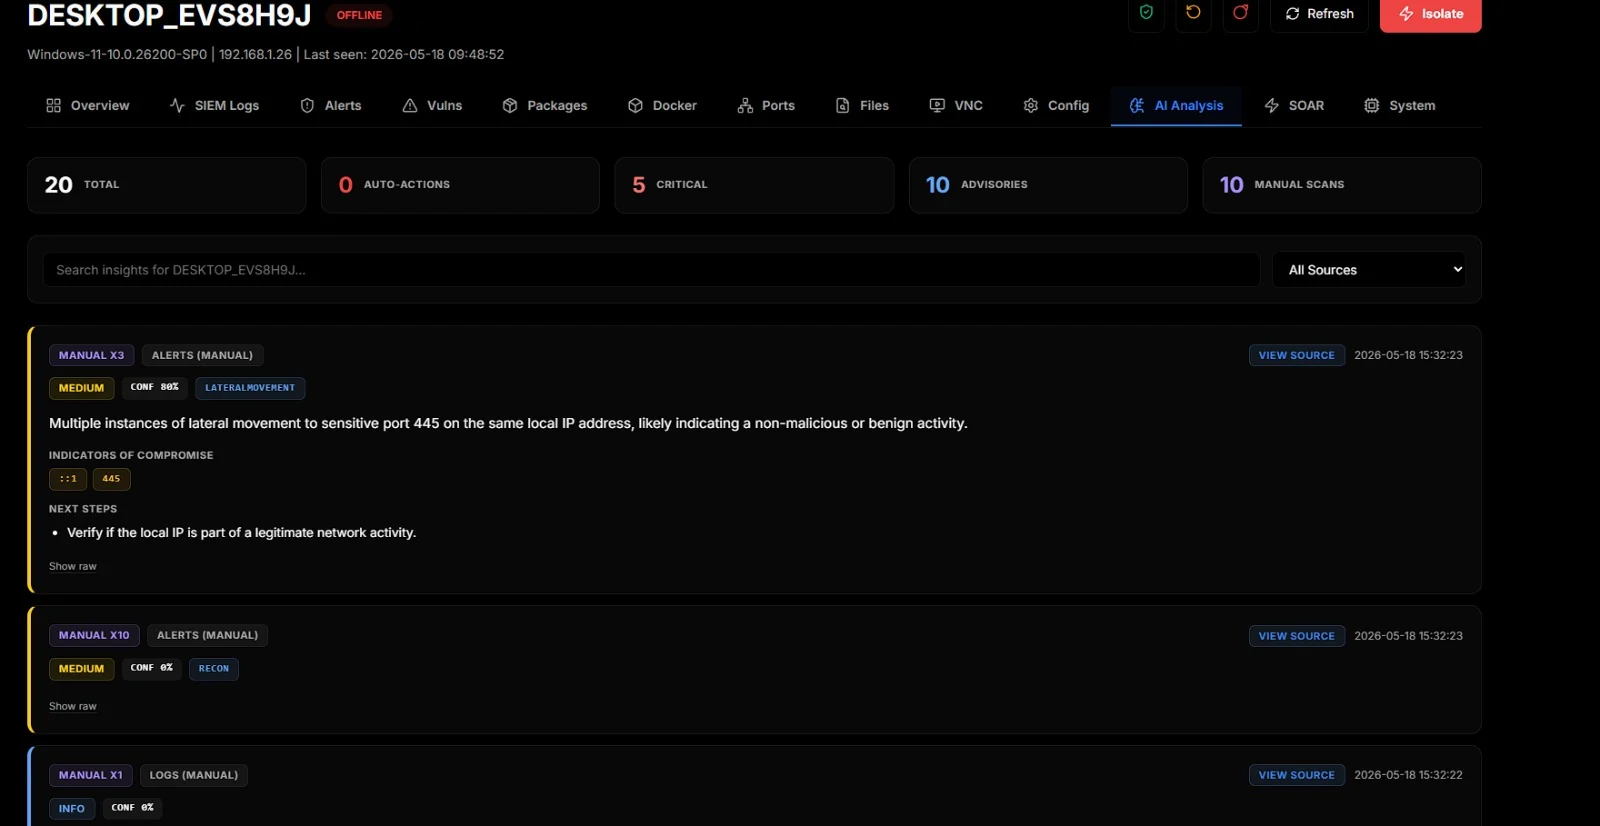
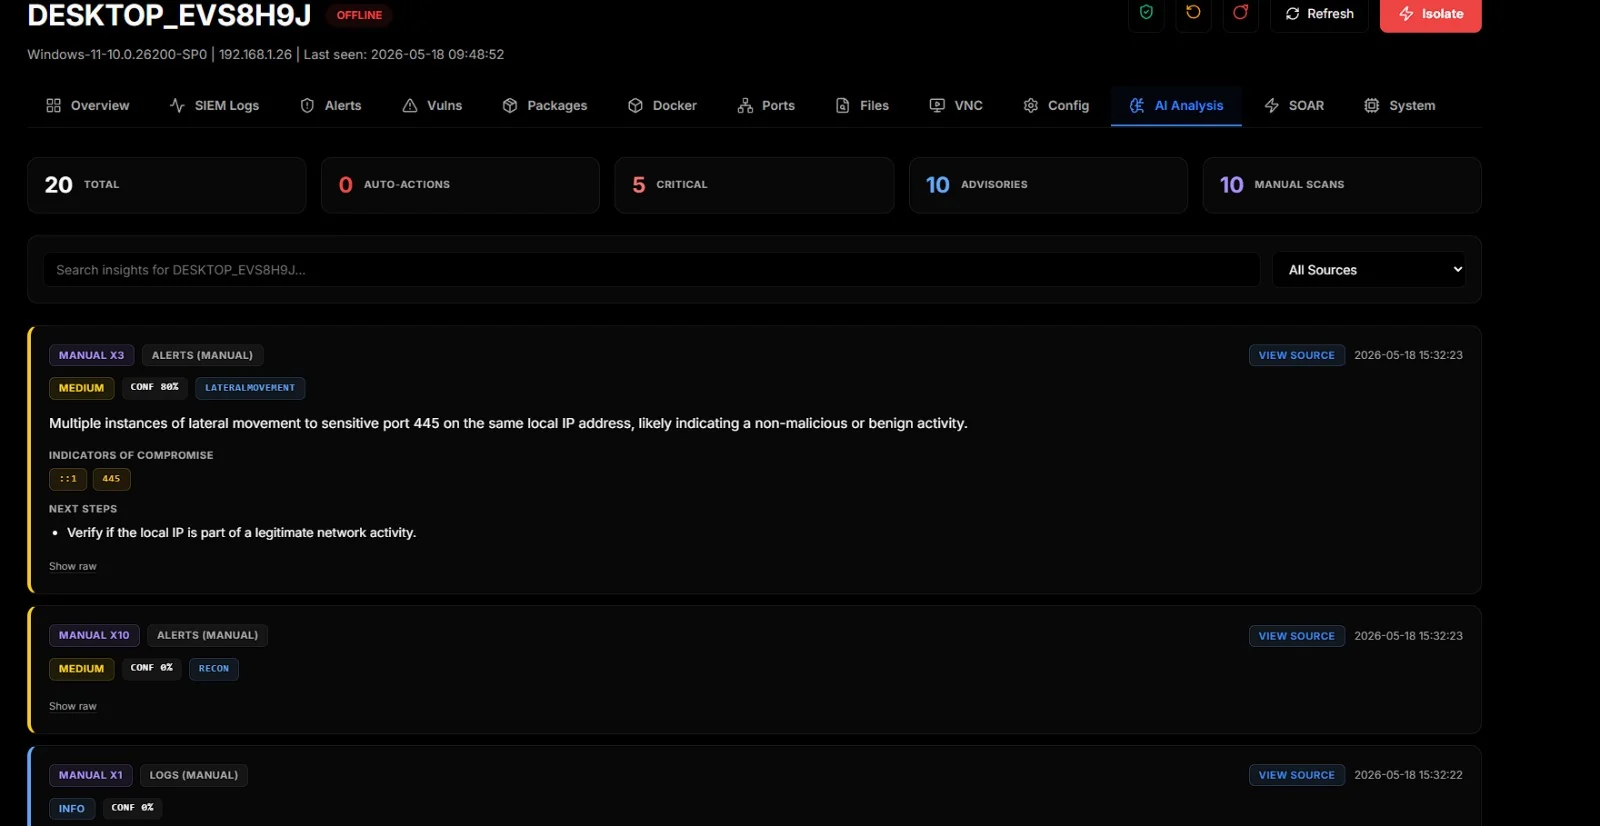
The AI Analysis tab is the operator-facing side of the local LLM. Manual and automatic scans both land here. Each insight carries a verdict chip, confidence, MITRE indicators (when the model returns them), IOCs, next steps, and a View Source button that opens the exact log row the AI looked at:
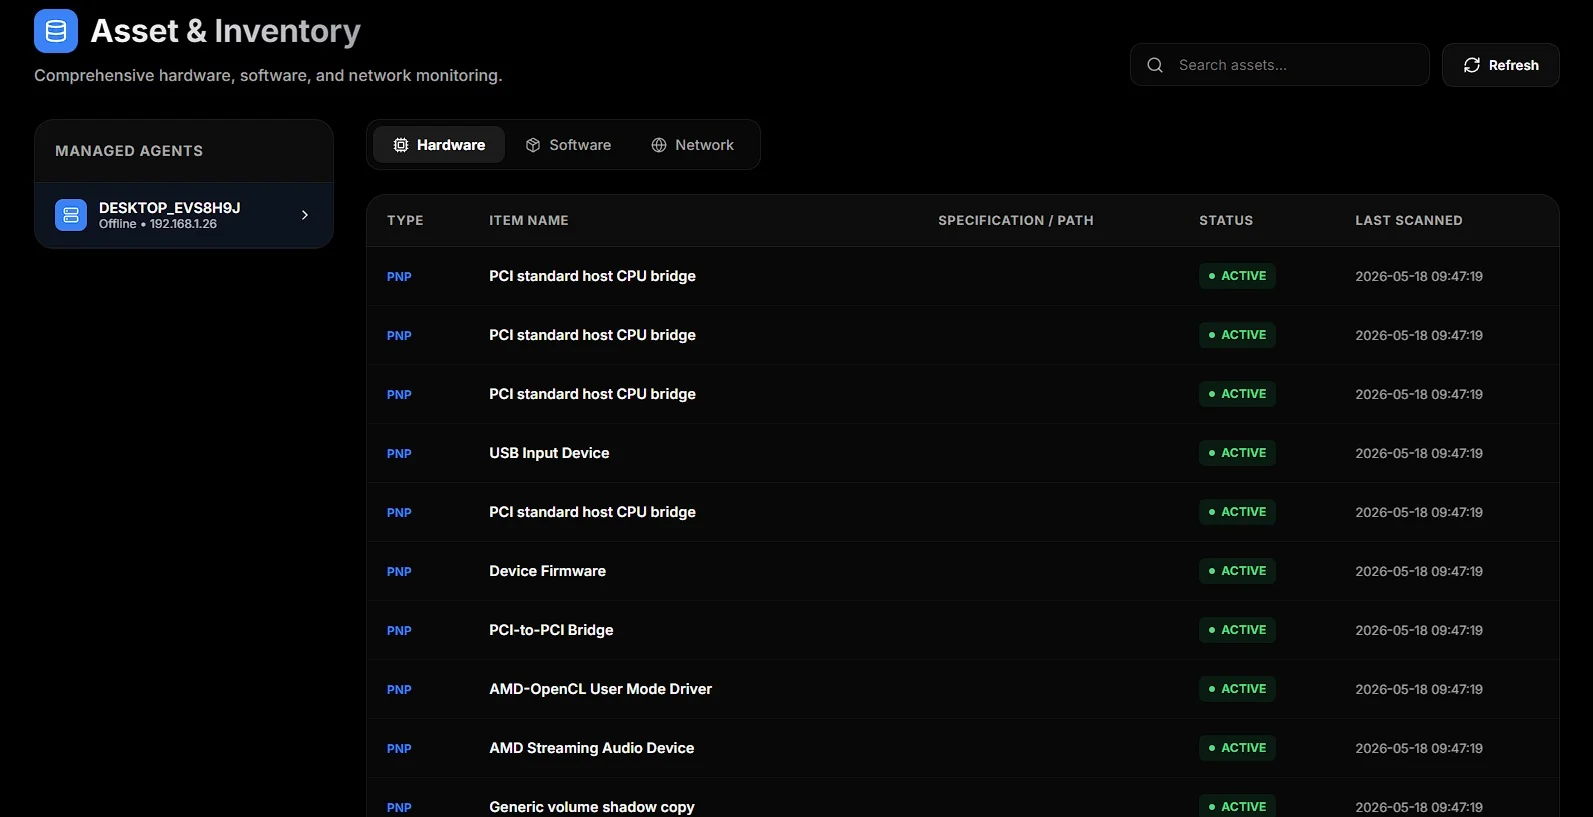
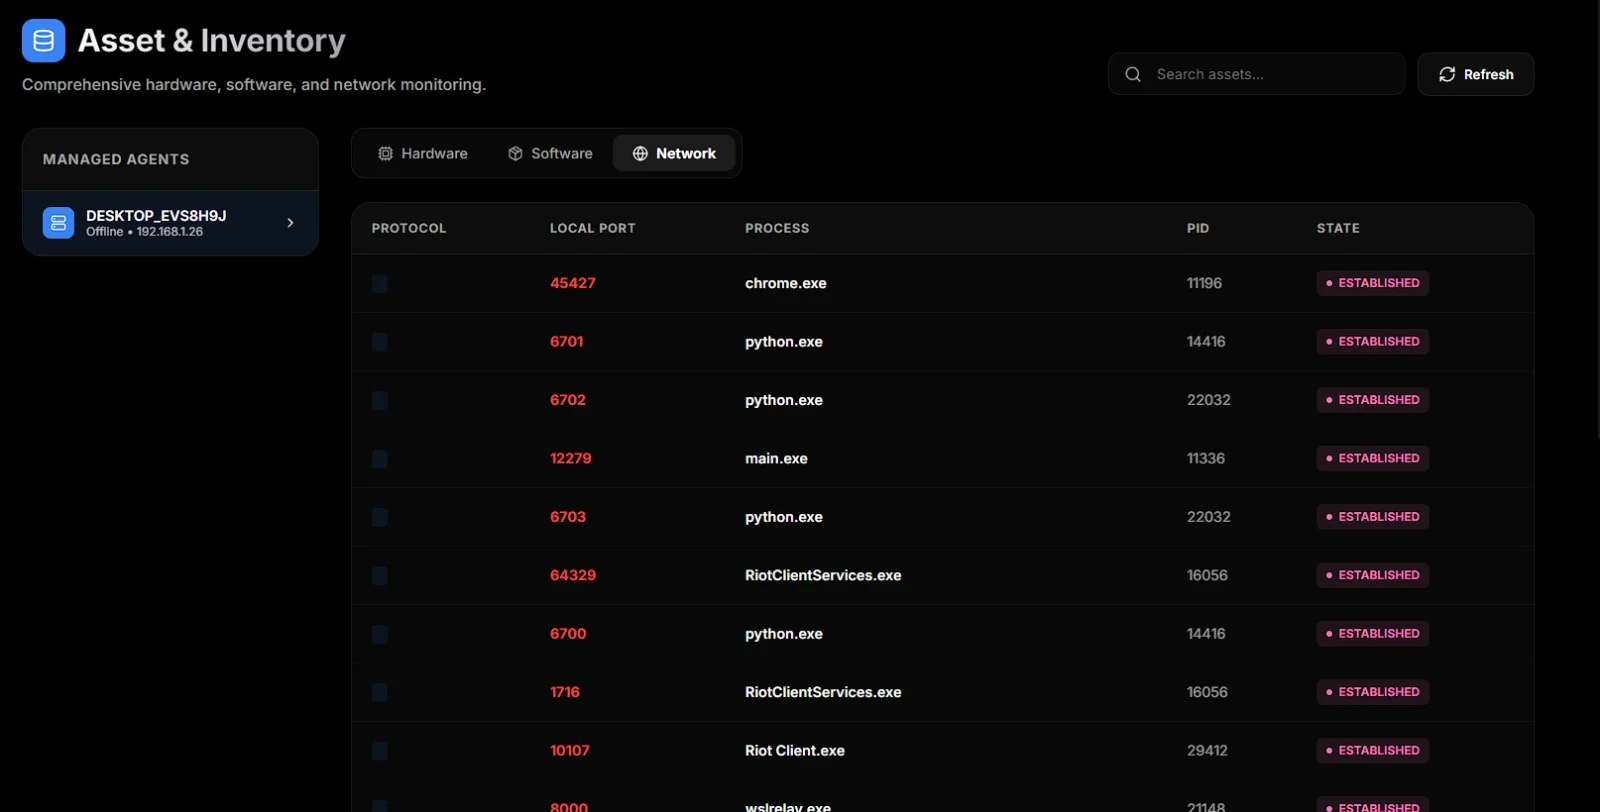
Hardware, software, and network sockets per agent. Hardware tab lists every PnP device, software lists installed packages, network lists every TCP/UDP socket with its owning process:
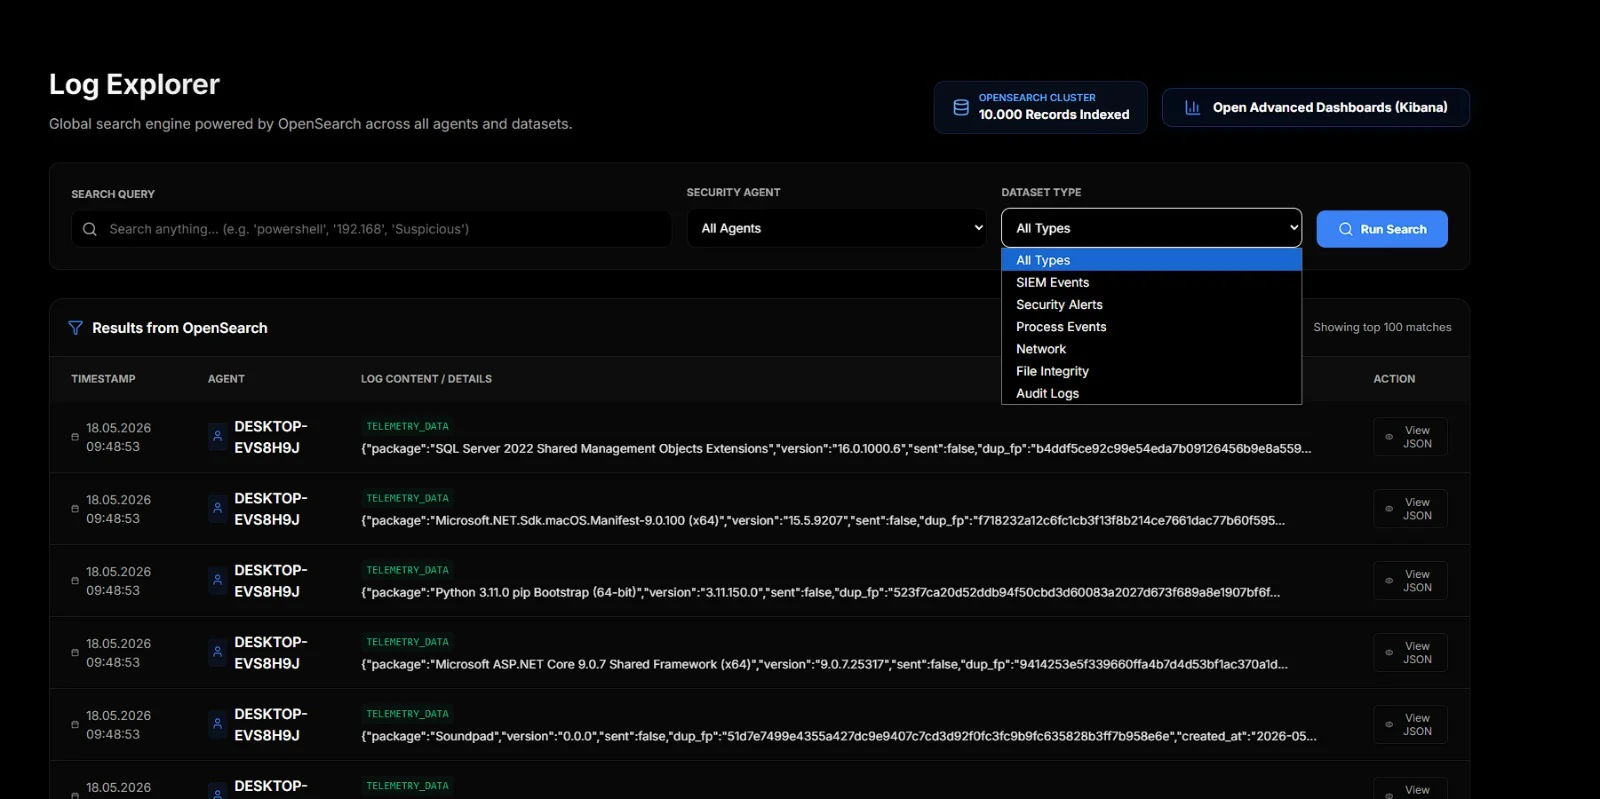
Cross-agent search backed by OpenSearch. Pick an agent, pick a dataset (SIEM events, security alerts, process events, network, FIM, audit logs), and search. There's also a button to open OpenSearch Dashboards (Kibana fork) for power users:
Every login attempt against the platform itself, both local and LDAP, with result, source IP, and timestamp. Useful when someone is in the "who-logged-in-when" mood: