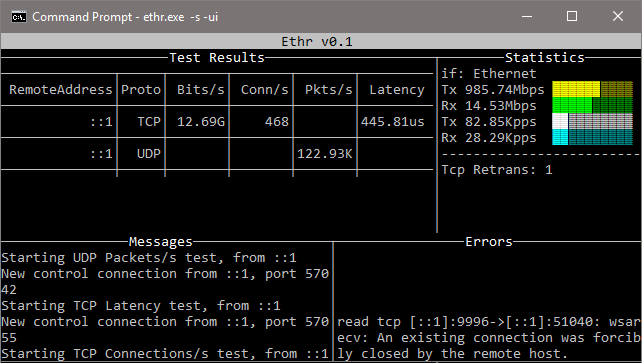
TCP, UDP, HTTP, HTTPS और ICMP पर नेटवर्क प्रदर्शन परीक्षण के लिए क्रॉस-प्लेटफ़ॉर्म CLI: बैंडविड्थ, connections/s, packets/s, विलंबता, हानि, जिटर, पिंग और ट्रेसरूट।
Ethr golang में लिखा गया एक क्रॉस-प्लेटफ़ॉर्म नेटवर्क प्रदर्शन मापन उपकरण है। इस परियोजना का लक्ष्य बैंडविड्थ, connections/s, packets/s, विलंबता (latency), हानि (loss) और जिटर (jitter) के व्यापक नेटवर्क प्रदर्शन मापन के लिए एक देशी उपकरण प्रदान करना है, जो TCP, UDP, HTTP, HTTPS जैसे कई प्रोटोकॉल और Windows, Linux तथा अन्य Unix सिस्टम जैसे कई प्लेटफ़ॉर्म पर कार्य करता है।
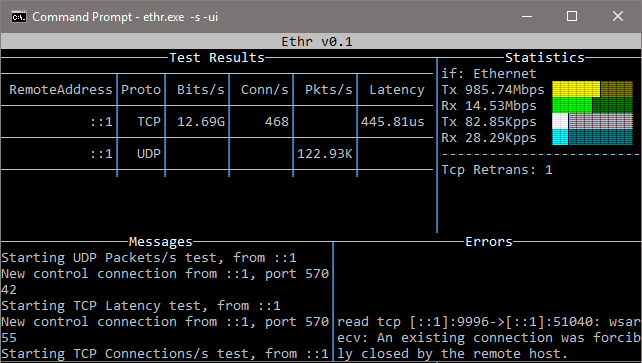
Ethr मौजूदा ओपन सोर्स नेटवर्क प्रदर्शन उपकरणों से प्रेरणा लेता है और उन विचारों पर आधारित है। बैंडविड्थ मापन के लिए, यह TCP और UDP ट्रैफ़िक के लिए iPerf3 के समान है। iPerf3 में थ्रॉटल किए गए परीक्षण, समृद्ध फीचर सेट जैसे कई और विकल्प हैं, जबकि Ethr कई थ्रेड्स का समर्थन करता है, जो इसे 1024 या उससे भी अधिक कनेक्शनों तक स्केल करने, एक ही सर्वर के साथ कई क्लाइंट्स के संचार आदि की अनुमति देता है। विलंबता मापन के लिए, यह Windows पर latte या Linux पर sockperf के समान है।
Ethr अन्य उपकरणों की तुलना में अधिक परीक्षण माप प्रदान करता है, उदाहरण के लिए यह बैंडविड्थ, connections/s, packets/s, विलंबता और TCP कनेक्शन सेटअप विलंबता के मापन को एक ही उपकरण में प्रदान करता है। भविष्य में, और अधिक सुविधाएँ (उम्मीद है कि अन्य योगदान देंगे) जोड़ने के साथ-साथ अधिक प्रोटोकॉल समर्थन जोड़ने की योजना है, ताकि यह नेटवर्क प्रदर्शन मापन के लिए एक व्यापक उपकरण बन सके।
Ethr golang के कारण स्वाभाविक रूप से क्रॉस-प्लेटफ़ॉर्म है, जैसा कि cygwin जैसी अमूर्त परत के माध्यम से संकलन करने के विपरीत है, जो कार्यक्षमता को सीमित कर सकती है। यह iPerf3, ntttcp, psping, sockperf और latte जैसे उपकरणों की कार्यक्षमता को मिलाकर और कई प्लेटफ़ॉर्म और कई प्रोटोकॉल के लिए एक ही उपकरण प्रदान करके प्रदर्शन मापन को एकीकृत करने की आशा करता है।
https://github.com/Microsoft/ethr/releases/latest
Linux
wget https://github.com/microsoft/ethr/releases/latest/download/ethr_linux.zip
unzip ethr_linux.zip
Windows Powershell
wget https://github.com/microsoft/ethr/releases/latest/download/ethr_windows.zip -OutFile ethr_windows.zip
Expand-Archive .\ethr_windows.zip -DestinationPath .
OSX
wget https://github.com/microsoft/ethr/releases/latest/download/ethr_osx.zip
unzip ethr_osx.zip
नोट: इसे स्रोत से बनाने के लिए go संस्करण 1.11 या उच्चतर आवश्यक है।
हम Ethr निर्भरताओं को प्रबंधित करने के लिए go-module का उपयोग करते हैं। अधिक जानकारी के लिए कृपया go-modules का उपयोग कैसे करें! देखें।
git clone https://github.com/Microsoft/ethr.git
cd ethr
go build
यदि ethr को $GOPATH/src ट्री के अंदर क्लोन किया गया है, तो कृपया सुनिश्चित करें कि आप go कमांड को GO111MODULE=on के साथ चलाएँ!
कमांड का उपयोग करके इमेज बनाएं:
docker build -t microsoft/ethr .
बाइनरी बनाएं:
Linux
docker run -e GOOS=linux -v $(pwd):/out microsoft/ethr make build-docker
Windows
docker run -e BINARY_NAME=ethr.exe -e GOOS=windows -v $(pwd):/out microsoft/ethr make build-docker
OS X
docker run -e BINARY_NAME=ethr -e GOOS=darwin -v $(pwd):/out microsoft/ethr make build-docker
go get github.com/microsoft/ethr
मान लीजिए आप yay (https://github.com/Jguer/yay) का उपयोग कर रहे हैं:
yay -S ethr
ethr.exe बनाने के लिए 'स्रोत से निर्माण' विषय का अनुसरण करें।
नया रिलीज़ संस्करण जोड़ने के लिए ethr.nuspec को संशोधित करें
vim ethr.nuspec
एक nuget पैकेज बनाएं(Ethr.0.2.1.nupkg जैसा)
nuget.exe pack ethr.nuspec
पैकेज को nuget.org पर अपलोड करें।
सहायता:
ethr -h
सर्वर:
ethr -s
टेक्स्ट UI के साथ सर्वर:
ethr -s -ui
क्लाइंट:
ethr -c <server ip>
उदाहरण:
// Start server
ethr -s
// Start client for default (bandwidth) test measurement using 1 thread
ethr -c localhost
// Start bandwidth test using 8 threads
ethr -c localhost -n 8
// Start connections/s test using 64 threads to server 10.1.0.11
ethr -c 10.1.0.11 -t c -n 64
// Run Ethr server on port 9999
./ethr -s -port 9999
// Measure TCP connection setup latency to ethr server on port 9999
// Assuming Ethr server is running on server with IP address: 10.1.1.100
./ethr -c 10.1.1.100 -p tcp -t pi -d 0 -4 -port 9999
// Measure TCP connection setup latency to www.github.com at port 443
./ethr -x www.github.com:443 -p tcp -t pi -d 0 -4
// Measure TCP connection setup latency to www.github.com at port 443
// Note: Here port 443 is driven automatically from https
./ethr -x https://www.github.com -p tcp -t pi -d 0 -4
// Measure ICMP ping latency to www.github.com
sudo ./ethr -x www.github.com -p icmp -t pi -d 0 -4
// Run measurement similar to mtr on Linux
sudo ./ethr -x www.github.com -p icmp -t mtr -d 0 -4
// Measure packets/s over UDP by sending small 1-byte packets
./ethr -c 172.28.192.1 -p udp -t p -d 0
ICMP से संबंधित परीक्षणों, Ping, TraceRoute, MyTraceRoute के लिए, Windows को फ़ायरवॉल के माध्यम से ICMP की अनुमति देना आवश्यक है। यह PowerShell का उपयोग करके निम्नलिखित कमांड द्वारा किया जा सकता है। हालाँकि, इसका उपयोग केवल तभी करें जब आपके सेटअप की सुरक्षा नीति इसकी अनुमति देती है।
// Allow ICMP packets via Firewall for IPv4
New-NetFirewallRule -DisplayName "ICMP_Allow_Any" -Direction Inbound -Protocol ICMPv4 -IcmpType Any -Action Allow -Profile Any -RemotePort Any
// Allow ICMP packets via Firewall for IPv6
New-NetFirewallRule -DisplayName "ICMPV6_Allow_Any" -Direction Inbound -Protocol ICMPv6 -IcmpType Any -Action Allow -Profile Any -RemotePort Any
इसके अलावा, TCP आधारित TraceRoute और MyTraceRoute के लिए Administrator मोड आवश्यक है, अन्यथा Ethr ICMP TTL exceeded संदेश प्राप्त नहीं कर पाएगा।
ICMP Ping, ICMP/TCP TraceRoute और MyTraceRoute के लिए, sudo के माध्यम से विशेषाधिकार (privileged) मोड आवश्यक है।
-h
Help
-no
Disable logging to file. Logging to file is enabled by default.
-o <filename>
Name of log file. By default, following file names are used:
Server mode: 'ethrs.log'
Client mode: 'ethrc.log'
-debug
Enable debug information in logging output.
-4
Use only IP v4 version
-6
Use only IP v6 version
In this mode, Ethr runs as a server, allowing multiple clients to run
performance tests against it.
-s
Run in server mode.
-ip <string>
Bind to specified local IP address for TCP & UDP tests.
This must be a valid IPv4 or IPv6 address.
Default: <empty> - Any IP
-port <number>
Use specified port number for TCP & UDP tests.
Default: 8888
-ui
Show output in text UI.
In this mode, Ethr client can only talk to an Ethr server.
-c <server>
Run in client mode and connect to <server>.
Server is specified using name, FQDN or IP address.
-b <rate>
Transmit only Bits per second (format: <num>[K | M | G])
Only valid for Bandwidth tests. Default: 0 - Unlimited
Examples: 100 (100bits/s), 1M (1Mbits/s).
-cport <number>
Use specified local port number in client for TCP & UDP tests.
Default: 0 - Ephemeral Port
-d <duration>
Duration for the test (format: <num>[ms | s | m | h]
0: Run forever
Default: 10s
-g <gap>
Time interval between successive measurements (format: <num>[ms | s | m | h]
Only valid for latency, ping and traceRoute tests.
0: No gap
Default: 1s
-i <iterations>
Number of round trip iterations for each latency measurement.
Only valid for latency testing.
Default: 1000
-ip <string>
Bind to specified local IP address for TCP & UDP tests.
This must be a valid IPv4 or IPv6 address.
Default: <empty> - Any IP
-l <length>
Length of buffer to use (format: <num>[KB | MB | GB])
Only valid for Bandwidth tests. Max 1GB.
Default: 16KB
-n <number>
Number of Parallel Sessions (and Threads).
0: Equal to number of CPUs
Default: 1
-p <protocol>
Protocol ("tcp", "udp", "http", "https", or "icmp")
Default: tcp
-port <number>
Use specified port number for TCP & UDP tests.
Default: 8888
-r
For Bandwidth tests, send data from server to client.
-t <test>
Test to run ("b", "c", "p", "l", "cl" or "tr")
b: Bandwidth
c: Connections/s
p: Packets/s
l: Latency, Loss & Jitter
pi: Ping Loss & Latency
tr: TraceRoute
mtr: MyTraceRoute with Loss & Latency
Default: b - Bandwidth measurement.
-tos
Specifies 8-bit value to use in IPv4 TOS field or IPv6 Traffic Class field.
-w <number>
Use specified number of iterations for warmup.
Default: 1
-T <string>
Use the given title in log files for logging results.
Default: <empty>
In this mode, Ethr talks to a non-Ethr server. This mode supports only a
few types of measurements, such as Ping, Connections/s and TraceRoute.
-x <destination>
Run in external client mode and connect to <destination>.
<destination> is specified in URL or Host:Port format.
For URL, if port is not specified, it is assumed to be 80 for http and 443 for https.
Example: For TCP - www.microsoft.com:443 or 10.1.0.4:22 or https://www.github.com
For ICMP - www.microsoft.com or 10.1.0.4
-cport <number>
Use specified local port number in client for TCP & UDP tests.
Default: 0 - Ephemeral Port
-d <duration>
Duration for the test (format: <num>[ms | s | m | h]
0: Run forever
Default: 10s
-g <gap>
Time interval between successive measurements (format: <num>[ms | s | m | h]
Only valid for latency, ping and traceRoute tests.
0: No gap
Default: 1s
-ip <string>
Bind to specified local IP address for TCP & UDP tests.
This must be a valid IPv4 or IPv6 address.
Default: <empty> - Any IP
-n <number>
Number of Parallel Sessions (and Threads).
0: Equal to number of CPUs
Default: 1
-p <protocol>
Protocol ("tcp", or "icmp")
Default: tcp
-t <test>
Test to run ("c", "cl", or "tr")
c: Connections/s
pi: Ping Loss & Latency
tr: TraceRoute
mtr: MyTraceRoute with Loss & Latency
Default: pi - Ping Loss & Latency.
-tos
Specifies 8-bit value to use in IPv4 TOS field or IPv6 Traffic Class field.
-w <number>
Use specified number of iterations for warmup.
Default: 1
-T <string>
Use the given title in log files for logging results.
Default: <empty>
Windows
परीक्षण किया गया: Windows 10, Windows 7 SP1
परीक्षण नहीं किया गया: अन्य Windows संस्करण
Linux
परीक्षण किया गया: Ubuntu Linux 18.04.1 LTS, OpenSuse Leap 15
परीक्षण नहीं किया गया: अन्य Linux संस्करण
OSX
परीक्षण किया गया: OSX का परीक्षण योगदानकर्ताओं द्वारा किया गया है
अन्य
इस समय कोई अन्य प्लेटफ़ॉर्म परीक्षण नहीं किया गया है
कार्य सूची के कार्य आइटम नीचे दिखाए गए हैं। इन कार्य आइटमों या किसी अन्य सुविधाओं और बगफिक्स के लिए योगदान का स्वागत है।
यह परियोजना योगदान और सुझावों का स्वागत करती है। अधिकांश योगदानों के लिए आपको एक योगदानकर्ता लाइसेंस समझौते (CLA) से सहमत होना आवश्यक है, जिसमें यह घोषित किया गया हो कि आपके पास अपने योगदान का उपयोग करने का अधिकार है, और वास्तव में आप हमें अपने योगदान का उपयोग करने के अधिकार प्रदान करते हैं। विवरण के लिए, https://cla.microsoft.com पर जाएँ।
जब आप एक पुल अनुरोध सबमिट करते हैं, तो एक CLA-bot स्वचालित रूप से निर्धारित करेगा कि क्या आपको CLA प्रदान करने की आवश्यकता है और PR को उचित रूप से सजाएगा (जैसे, लेबल, टिप्पणी)। बस बॉट द्वारा दिए गए निर्देशों का पालन करें। आपको हमारे CLA का उपयोग करने वाले सभी रिपॉजिटरी में यह केवल एक बार करना होगा।
इस परियोजना ने Microsoft Open Source Code of Conduct को अपनाया है। अधिक जानकारी के लिए Code of Conduct FAQ देखें या किसी अतिरिक्त प्रश्न या टिप्पणी के लिए [email protected] से संपर्क करें।
| प्रोटोकॉल | Bandwidth | Connections/s | Packets/s | Latency | Ping | TraceRoute | MyTraceRoute |
|---|
| TCP | हाँ | हाँ | NA | हाँ | हाँ | हाँ | हाँ |
| UDP | हाँ | NA | हाँ | नहीं | NA | नहीं | नहीं |
| ICMP | नहीं | NA | NA | NA | हाँ | हाँ | हाँ |