 yeet-src/sigwire
Live kernel signal observability tool using eBPF tracepoints to stream every signal raised on a Linux host, showing sender, target, disposition, handler latency, and syscall interruptions in real time.

sigwire
tail -ffor signals. Every signal any process on the box raises — who sent it, who it hit, which signal, how it was raised (kill(2), the kernel, a POSIX timer), whether the target caught it and how long its handler ran, whether it tore a blocked syscall out withEINTR— decoded off the kernel's signal tracepoints and streamed live to your terminal. Nostrace -fon one pid, noptrace, no cooperation from the processes involved.




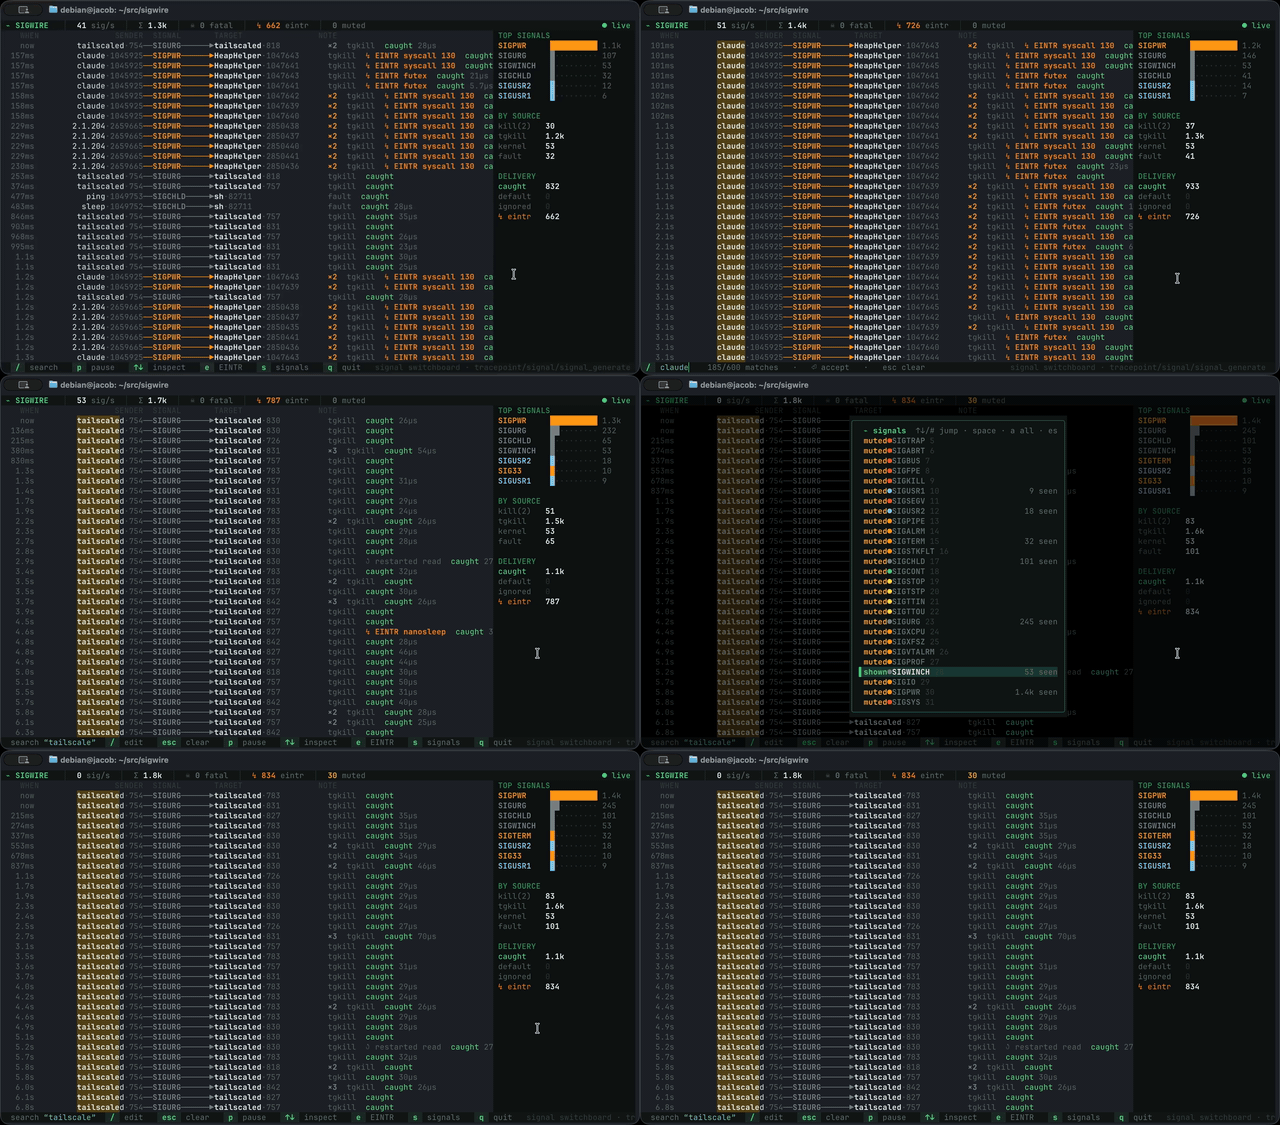
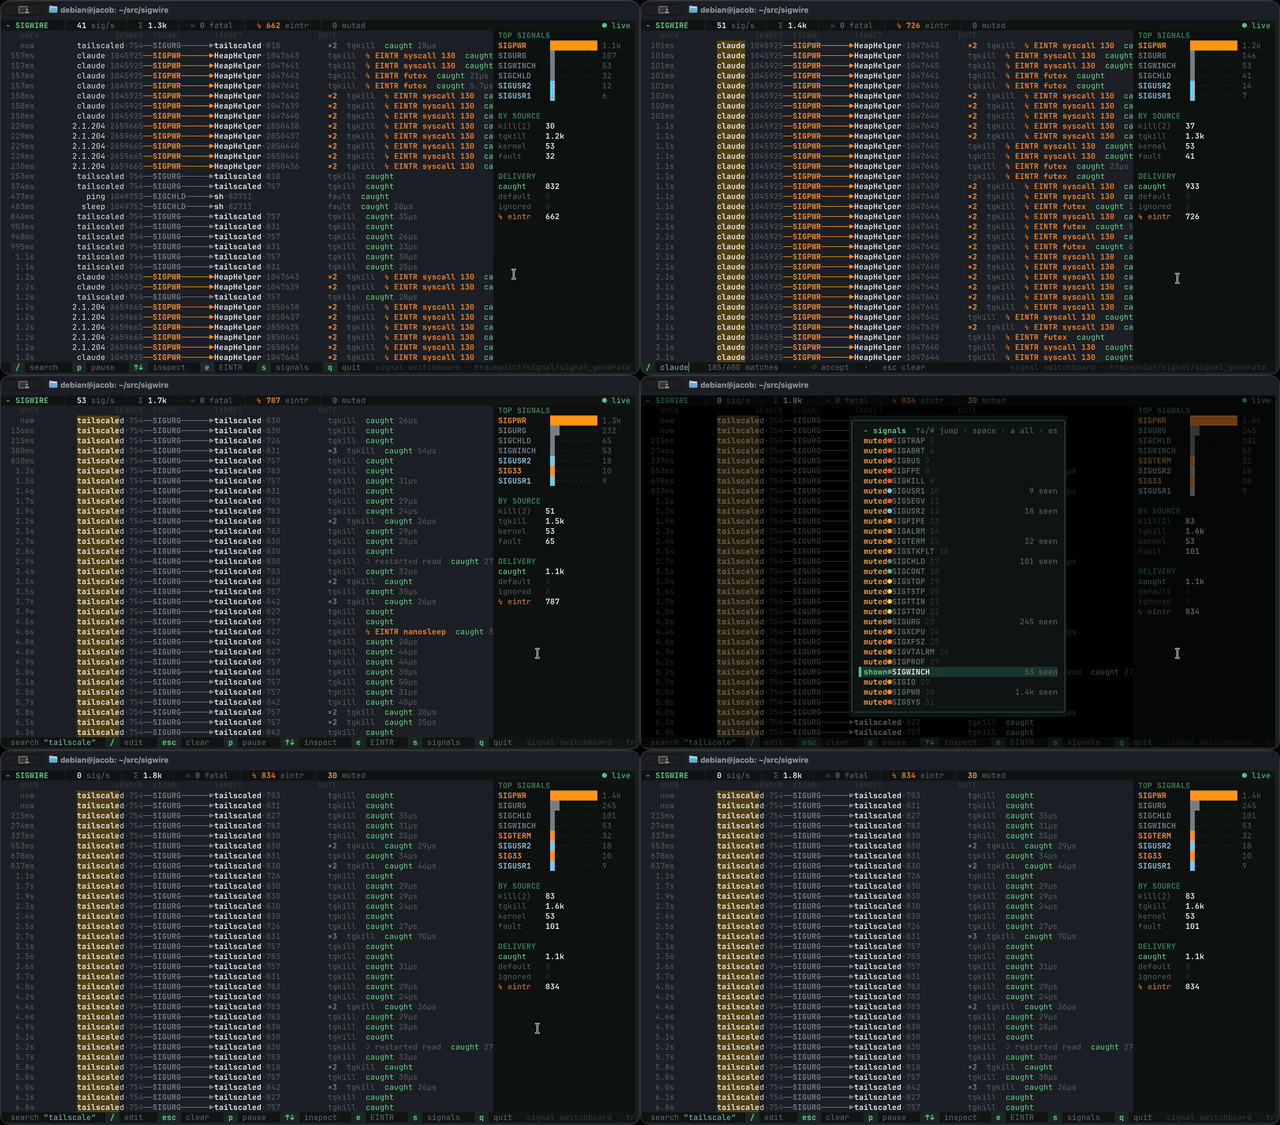
sigwire turns the kernel's signal machinery into a live patchbay: each line is sender ──SIGNAL──▶ target, coloured by severity, tagged with how it was raised, whether the target caught it (and how long its handler ran), whether it interrupted a blocked syscall (↯ EINTR read), collapsed to ×N when something spams, and marked ☠ when it's a genuine killing blow. A side rail tallies what's flying across the wire; pause and pick a row to inspect the full picture — disposition, handler address, sigaction flags, and the signals the target was blocking at that instant.
Because it hooks the kernel's tracepoints, not any one process, a single run watches every signal on the host at once — your app, a supervisor, the kernel's own fault machinery — with none of them aware they're being traced.
[!TIP] Two sides of every signal. sigwire watches both
signal:signal_generate(the sender's view — who raised what, the switchboard line) andsignal:signal_deliver(the target's view — did it catch it, with which handler and flags, what was it blocking, and did it interrupt a syscall). Two more hooks —rt_sigreturn(2)and the syscall-exit tracepoint — time the handler and catch EINTR. It's all correlated back into one row. This split is also why the☠ fatalcount is deliberately conservative (see What counts as fatal): generation happens before delivery, so the sender side can't know a signal's fate — only the delivery side can, and only for the cases it observes.
curl -fsSL https://yeet.cx | sh              # install the yeet daemon (one time)
yeet run github:yeet-src/sigwire             # run the dashboard (the daemon does the privileged BPF load)
Manual install guide | Linux only
Nothing to configure — signals are constant background traffic on any box, so rows start landing at the top immediately. Want to make some yourself? kill -USR1 <pid>, Ctrl-C a foreground job, or start any managed runtime and watch its GC/scheduler ping its own threads (↯ EINTR futex scrolling by).
The feed follows the newest signal by default; select a row or pause and it holds still while data keeps flowing underneath.
| key | action |
|---|---|
p · Space | pause / resume the feed (freeze it to read) |
↑/↓, k/j | pause and inspect a row — opens the detail panel |
/ | fuzzy filter — matches process, pid, signal, source, and disposition; matched characters highlight live |
e | filter to interrupted syscalls only (↯ EINTR / ↺ restarted) |
s | open the signal picker — mute or show any signal, live |
Esc | back out one layer — clear the filter / close the picker / drop the selection, then quit |
q | quit |
Each row is one generated signal, newest at the top:
 WHEN            SENDER  SIGNAL        TARGET               NOTE
  now       bash·4402──SIGINT───▶  node·8813        kill(2)  ↯ EINTR read  caught 41µs
 1.2s    systemd·1──────SIGTERM──▶  nginx·1291       kill(2)  caught 1.2ms
 3.4s     kernel·8813──SIGSEGV──▶  chrome·8813       fault    default  ☠
 4.1s   postgres·507──SIGUSR1───▶  postgres·509 ×6  kill(2)  caught 9µs
Each row is one block: the sender → target are comm·pid (the sender is whoever raised the signal, current; the target is who it's aimed at), the wire in the middle carries the signal name coloured by severity, ×N folds a burst of the identical signal into one line, and the note on the right gives the source, then any syscall interruption, then the disposition.
Each row is frozen the moment its delivery resolves and never mutates again — so a burst scrolls past as a stable log, not a flickering aggregate.
The wire is coloured by severity on the same 256-color palette as the rest of the UI:
| severity | signals | colour |
|---|---|---|
| kill | SIGKILL | hot red |
| fatal (core-dumping) | SEGV BUS ABRT ILL FPE TRAP SYS QUIT | red |
| terminating | TERM INT HUP PIPE ALRM … | amber |
| job control | STOP TSTP TTIN TTOU | yellow |
| continue | CONT | green |
| user | USR1 USR2 | cyan |
| real-time | SIGRTMIN+n | violet |
| housekeeping | CHLD URG WINCH … | grey |
The note is the source (kill(2), tgkill, sigqueue, timer, kernel, fault); then, if it interrupted a blocked syscall, ↯ EINTR read (or ↺ restarted read when SA_RESTART auto-resumed it); then the disposition — caught 41µs (a handler ran, and how long it took), default (no handler, the default action applied), or ⊘ ignored. A ☠ marks a genuine killing blow (see What counts as fatal).
[!NOTE]
↯ EINTRis the one to watch. A signal that lands while a thread is parked in a slow syscall (read,poll,accept,futex,nanosleep, …) yanks it out: the syscall returns-1/EINTRand, unless the handler setSA_RESTART, it does not resume — the app has to retry. Forgetting that is a classic, maddening, timing-dependent bug ("why did myread()fail once?"). sigwire shows it happening, live, and which syscall took the hit. Presseto hide everything else and watch only the interrupts.
The rail on the right is the aggregate view: top signals by volume, a breakdown by source, and a delivery tally — how many signals were caught vs. hit their default vs. ignored.
Press ↑/↓ (or p) to freeze the feed and select a row; the rail turns into a detail panel with everything the delivery side knows about that exact signal:
 SIGNAL
  SIGUSR1  (10)  user
 from    ctarget·3980913
 to      ctarget·3980913
 RAISED
  via     tgkill
  code    SI_TKILL
  scope   thread
  result  delivered
 DELIVERY
  handled caught
  syscall EINTR ← read
  handler 0x55f0a1c3
  ran     3.0ms
  flags   SA_SIGINFO
 TARGET BLOCKS
  SIGINT SIGQUIT SIGTERM
caught (ran a userspace handler), default (→ the default action: terminate / core dump / stop / ignore), or ignored.EINTR ← read (userspace saw EINTR) or restarted read (SA_RESTART resumed it transparently).rt_sigreturn(2) that ends it. (Runtimes that only latch a flag in the C handler and do the real work later — CPython, Go — show a tiny time here; that's them, not sigwire.)sigaction flags on the handler (SA_RESTART, SA_SIGINFO, SA_NODEFER, …).sigprocmask) at the moment of delivery, straight off its task_struct.Esc closes the inspector; p resumes the live feed.
