 yampelo/beagle
Beagle is an incident response and digital forensics tool which transforms security logs and data into graphs.






Beagle is an incident response and digital forensics tool which transforms data sources and logs into graphs. Supported data sources include FireEye HX Triages, Windows EVTX files, SysMon logs and Raw Windows memory images. The resulting Graphs can be sent to graph databases such as Neo4J or DGraph, or they can be kept locally as Python NetworkX objects.
Beagle can be used directly as a python library, or through a provided web interface.
The library can be used either as a sequence of functional calls from a single datasource.
>>> from beagle.datasources import SysmonEVTX

>>> graph = SysmonEVTX("malicious.evtx").to_graph()
>>> graph
<networkx.classes.multidigraph.MultiDiGraph at 0x12700ee10>
As a graph generated from a set of multiple artifacts
>>> from beagle.datasources import SysmonEVTX, HXTriage, PCAP
>>> from beagle.backends import NetworkX

>>> nx = NetworkX.from_datasources(
    datasources=[
        SysmonEVTX("malicious.evtx"),
        HXTriage("alert.mans"),
        PCAP("traffic.pcap"),
    ]
)
>>> G = nx.graph()
<networkx.classes.multidigraph.MultiDiGraph at 0x12700ee10>
Or by strictly calling each intermediate step of the data source to graph process.
>>> from beagle.backends import NetworkX
>>> from beagle.datasources import SysmonEVTX
>>> from beagle.transformers import SysmonTransformer

>>> datasource = SysmonEVTX("malicious.evtx")

# Transformers take a datasource, and transform each event
# into a tuple of one or more nodes.
>>> transformer = SysmonTransformer(datasource=datasource)
>>> nodes = transformer.run()

# Transformers output an array of nodes.
[
    (<SysMonProc> process_guid="{0ad3e319-0c16-59c8-0000-0010d47d0000}"),
    (<File> host="DESKTOP-2C3IQHO" full_path="C:\Windows\System32\services.exe"),
    ...
]

# Backends take the nodes, and transform them into graphs
>>> backend = NetworkX(nodes=nodes)
>>> G = backend.graph()
<networkx.classes.multidigraph.MultiDiGraph at 0x126b887f0>
Graphs are centered around the activity of individual processes, and are meant primarily to help analysts investigate activity on hosts, not between them.
Beagle is available as a docker file:
docker pull yampelo/beagle
mkdir -p data/beagle
docker run -v "$PWD/data/beagle":"/data/beagle" -p 8000:8000 yampelo/beagle
It is also available as library. Full API Documentation is available on https://beagle-graphs.readthedocs.io
pip install pybeagle
Note: Only Python 3.6+ is currently supported.
Rekall is not automatically installed. To install Rekall execute the following command instead:
pip install pybeagle[rekall]
Any entry in the configuration file can be modified using environment variables that follow the following format: BEAGLE__{SECTION}__{KEY}. For example, in order to change the VirusTotal API Key used when using the docker image, you would use -e parameter and set the BEAGLE__VIRUSTOTAL__API_KEY variable:
docker run -v "data/beagle":"/data/beagle" -p 8000:8000 -e "BEAGLE__VIRUSTOTAL__API_KEY=$API_KEY" beagle
Environment variables and directories can be easily defined using docker compose
version: "3"

services:
    beagle:
        image: yampelo/beagle
        volumes:
            - /data/beagle:/data/beagle
        ports:
            - "8000:8000"
        environment:
            - BEAGLE__VIRUSTOTAL__API_KEY=$key$
Beagle's docker image comes with a web interface that wraps around the process of both transforming data into graphs, as well as using them to investigate data.
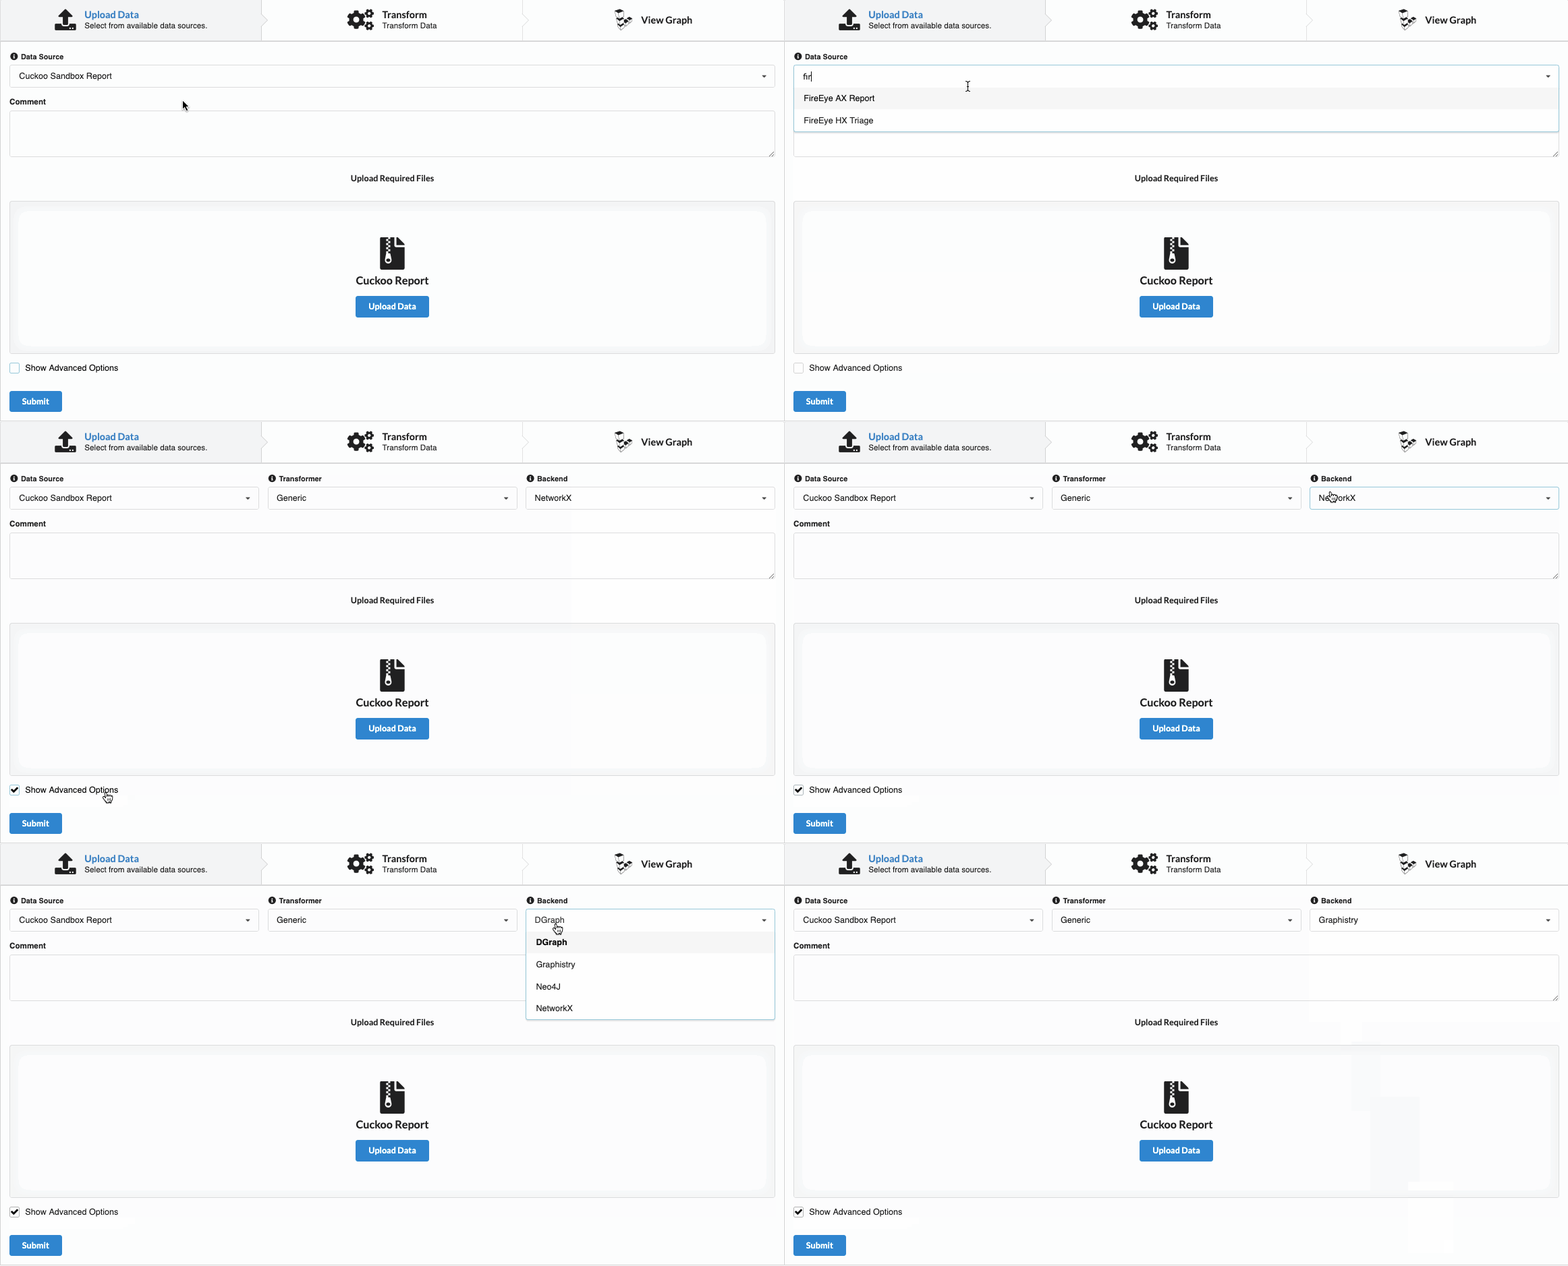
The upload form wraps around the graph creation process, and automatically uses NetworkX as the backend. Depending on the parameters required by the data source, the form will either prompt for a file upload, or text input. For example:
Any graph created is stored locally in the folder defined under the dir key from the storage section in the configuration. This can be modified by setting the BEAGLE__STORAGE__DIR environment variable.
Optionally, a comment can be added to any graph to better help describe it.
Each data source will automatically extract metadata from the provided parameter. The metadata and comment are visible later on when viewing the existing graphs of the datasource.
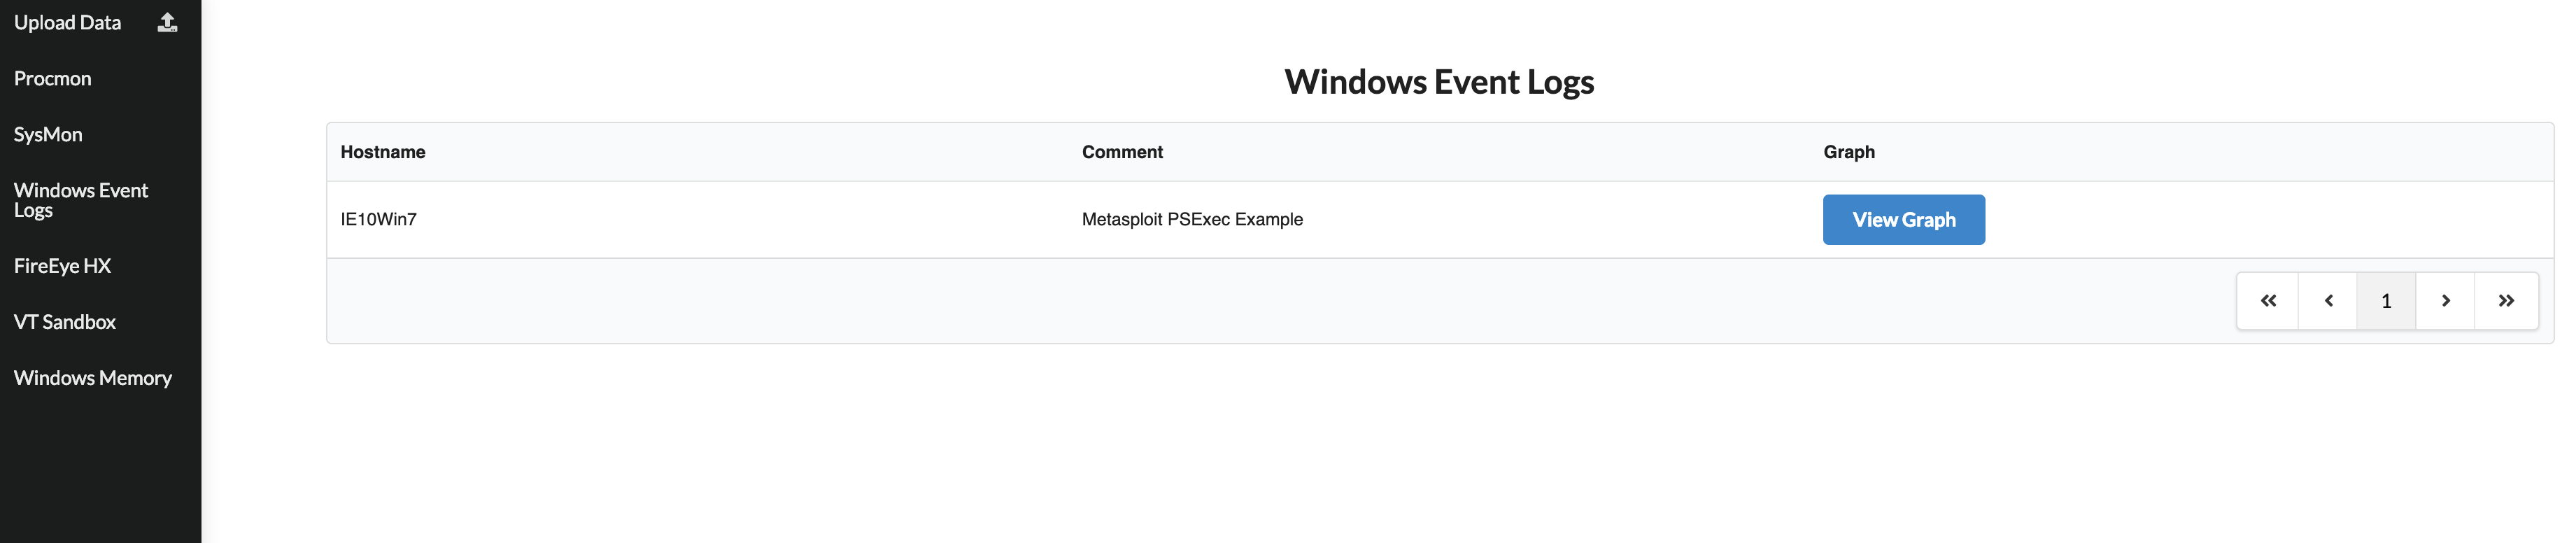
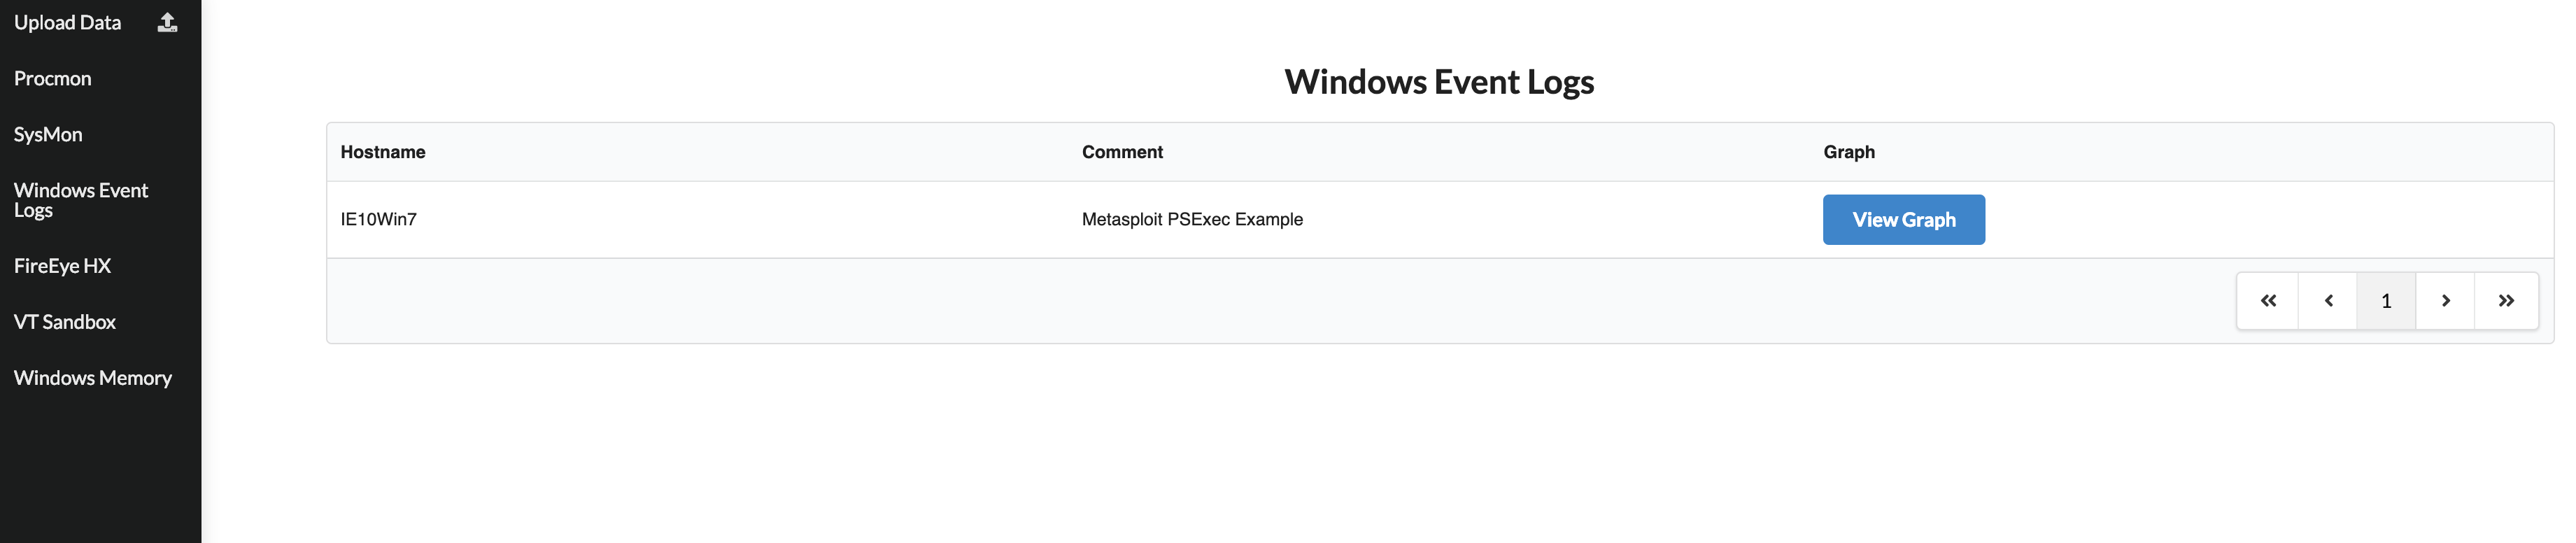
Clicking on a datasource on the sidebar renders a table of all parsed graphs for that datasource.
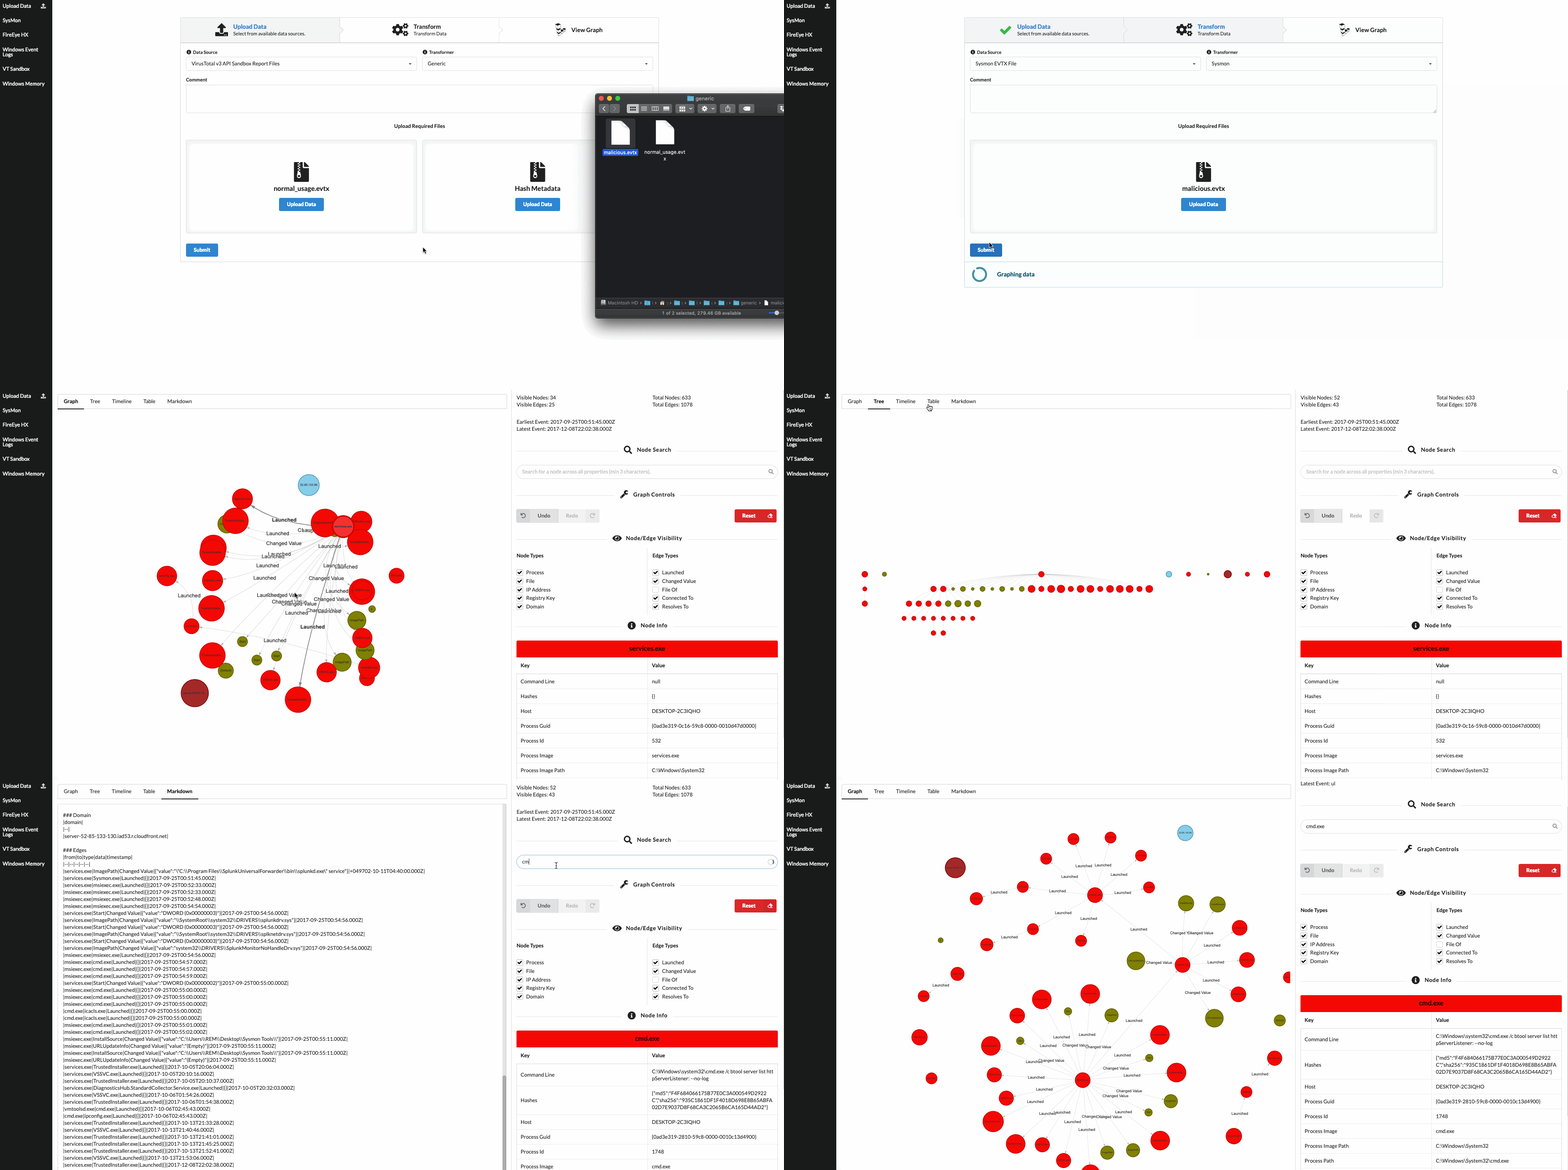
Viewing a graph in Beagle provides a web interface that allows analysts to quickly pivot around an incident.
The interface is split into two main parts, the left part which contains various perspectives of the graph (Graph, Tree, Table, etc), and the right part which allows you to filter nodes and edges by type, search for nodes, and expand a node's properties. It also allows you to undo and redo operations you perform on the graph.
Any element in the graph that has a divider above it is collapsible: