Skip to content
KitploitKITPLOIT
ToolsBlog
Submit
ToolsBlog
Submit

Hacking, PenTest, and Cybersecurity Tools for Your Security Arsenal!

Kitploit is a directory of hacking, cybersecurity, and pentesting tools. Discover the latest project updates to find vulnerabilities, analyze systems, automate testing, and strengthen your security.

··Feeds·Contact·Privacy·© 2026 Kitploit

Tool Directory

Categories

View all categories
Loading categories
babyshark — Flows-first PCAP TUI (case files, gorgeous UX). Do do do do. | Kitploit
Tools/GitHubGitHub/vignesh07/babyshark
Packet Sniffing & AnalysisNetwork ForensicsForensicsNetwork SecurityUtilities & FrameworksDNS AnalysisAnomaly DetectionLog Analysis
GitHubvignesh07/babyshark

babyshark

Flows-first PCAP TUI (case files, gorgeous UX). Do do do do.

View Repository
5651466 months agoReviewed by Kitploit

Most Popular

View all →

Discover the most used tools by our community.

Explore all tools

Browse our collection of tools

View all tools →
Share

babyshark

Wireshark made easy (in your terminal).

Babyshark is a PCAP TUI that helps you answer:

  • What’s using the network?
  • What looks broken/weird?
  • What should I select next?

Status: v0.3.0 (alpha).

  • Offline .pcap / .pcapng viewing works without Wireshark
  • Live capture requires tshark (Wireshark CLI)

Overview

DB99A3F0-4AB7-461C-A40F-496F9C950AFC

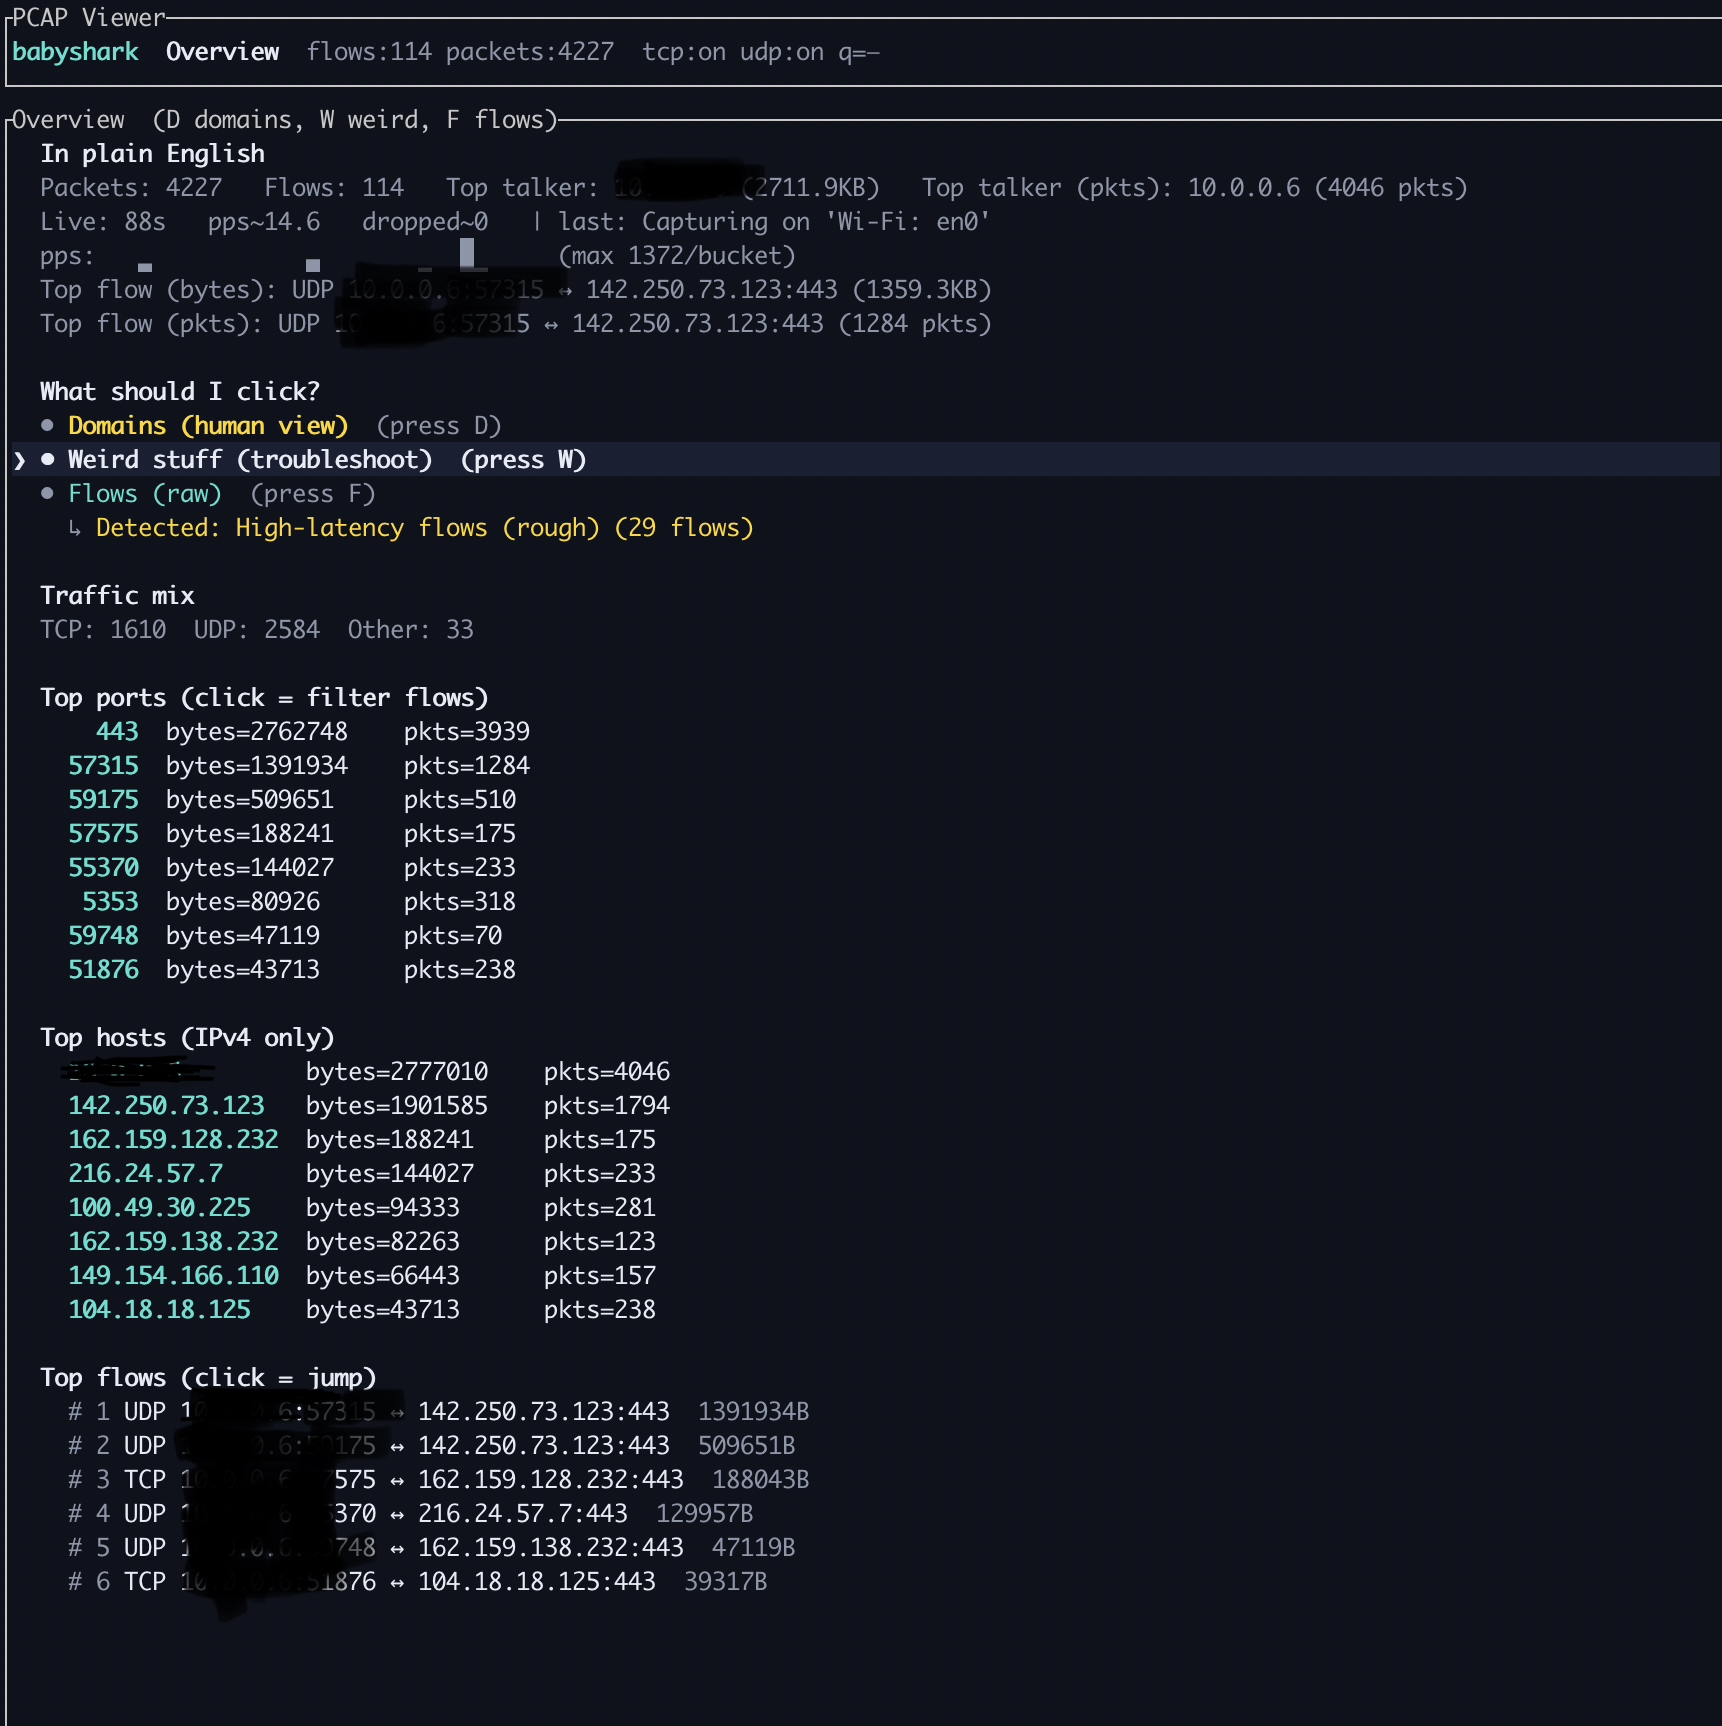
Overview is the “start here” dashboard. It summarizes the capture and suggests what to do next.

  • Shows quick totals (packets/flows), a traffic mix, and “top” tables (ports/hosts/flows).
  • In live mode it shows capture status (pps + a last status/error line from tshark).

How to use it:

  • Press D to jump to Domains (hostnames-first).
  • Press W to jump to (curated detectors).
Download Tool
What’s weird?
  • Press F (or f) to jump to Flows (raw).
  • Many rows are drill-down entry points: select a row and press Enter.
  • Domains

    5E1633E3-0E53-4085-AE98-6656121EAF8B

    Domains groups traffic by hostname so you can start from names instead of 5‑tuples.

    • Shows per-domain rollups (connections/bytes + query/response/failure-style counters).
    • The details pane shows “IP hints”. When DNS answers aren’t visible (DoH/DoT/caching), it can still show Observed IPs (from flows) using TLS SNI / HTTP Host hints.

    How to use it:

    • Select a domain and press Enter to drill into the relevant Flows.
    • Press s to change the sort mode.
    • Press c to clear an active subset filter.

    What's weird?

    B401B8AA-4EE7-42BE-A53A-DC4F6DFC562A

    What’s weird? is a curated set of detectors meant to answer “what looks broken/slow?” without needing deep Wireshark knowledge.

    • Each detector includes a short “why it matters”.
    • Pressing Enter on a detector filters down to the affected flows so you can drill into packets/streams.

    How to use it:

    • Select a detector (you can also press 1–9 to jump-select) and press Enter.
    • Press c to clear an active subset filter.

    Expand

    Screenshot 2026-02-23 at 12 09 07 PM

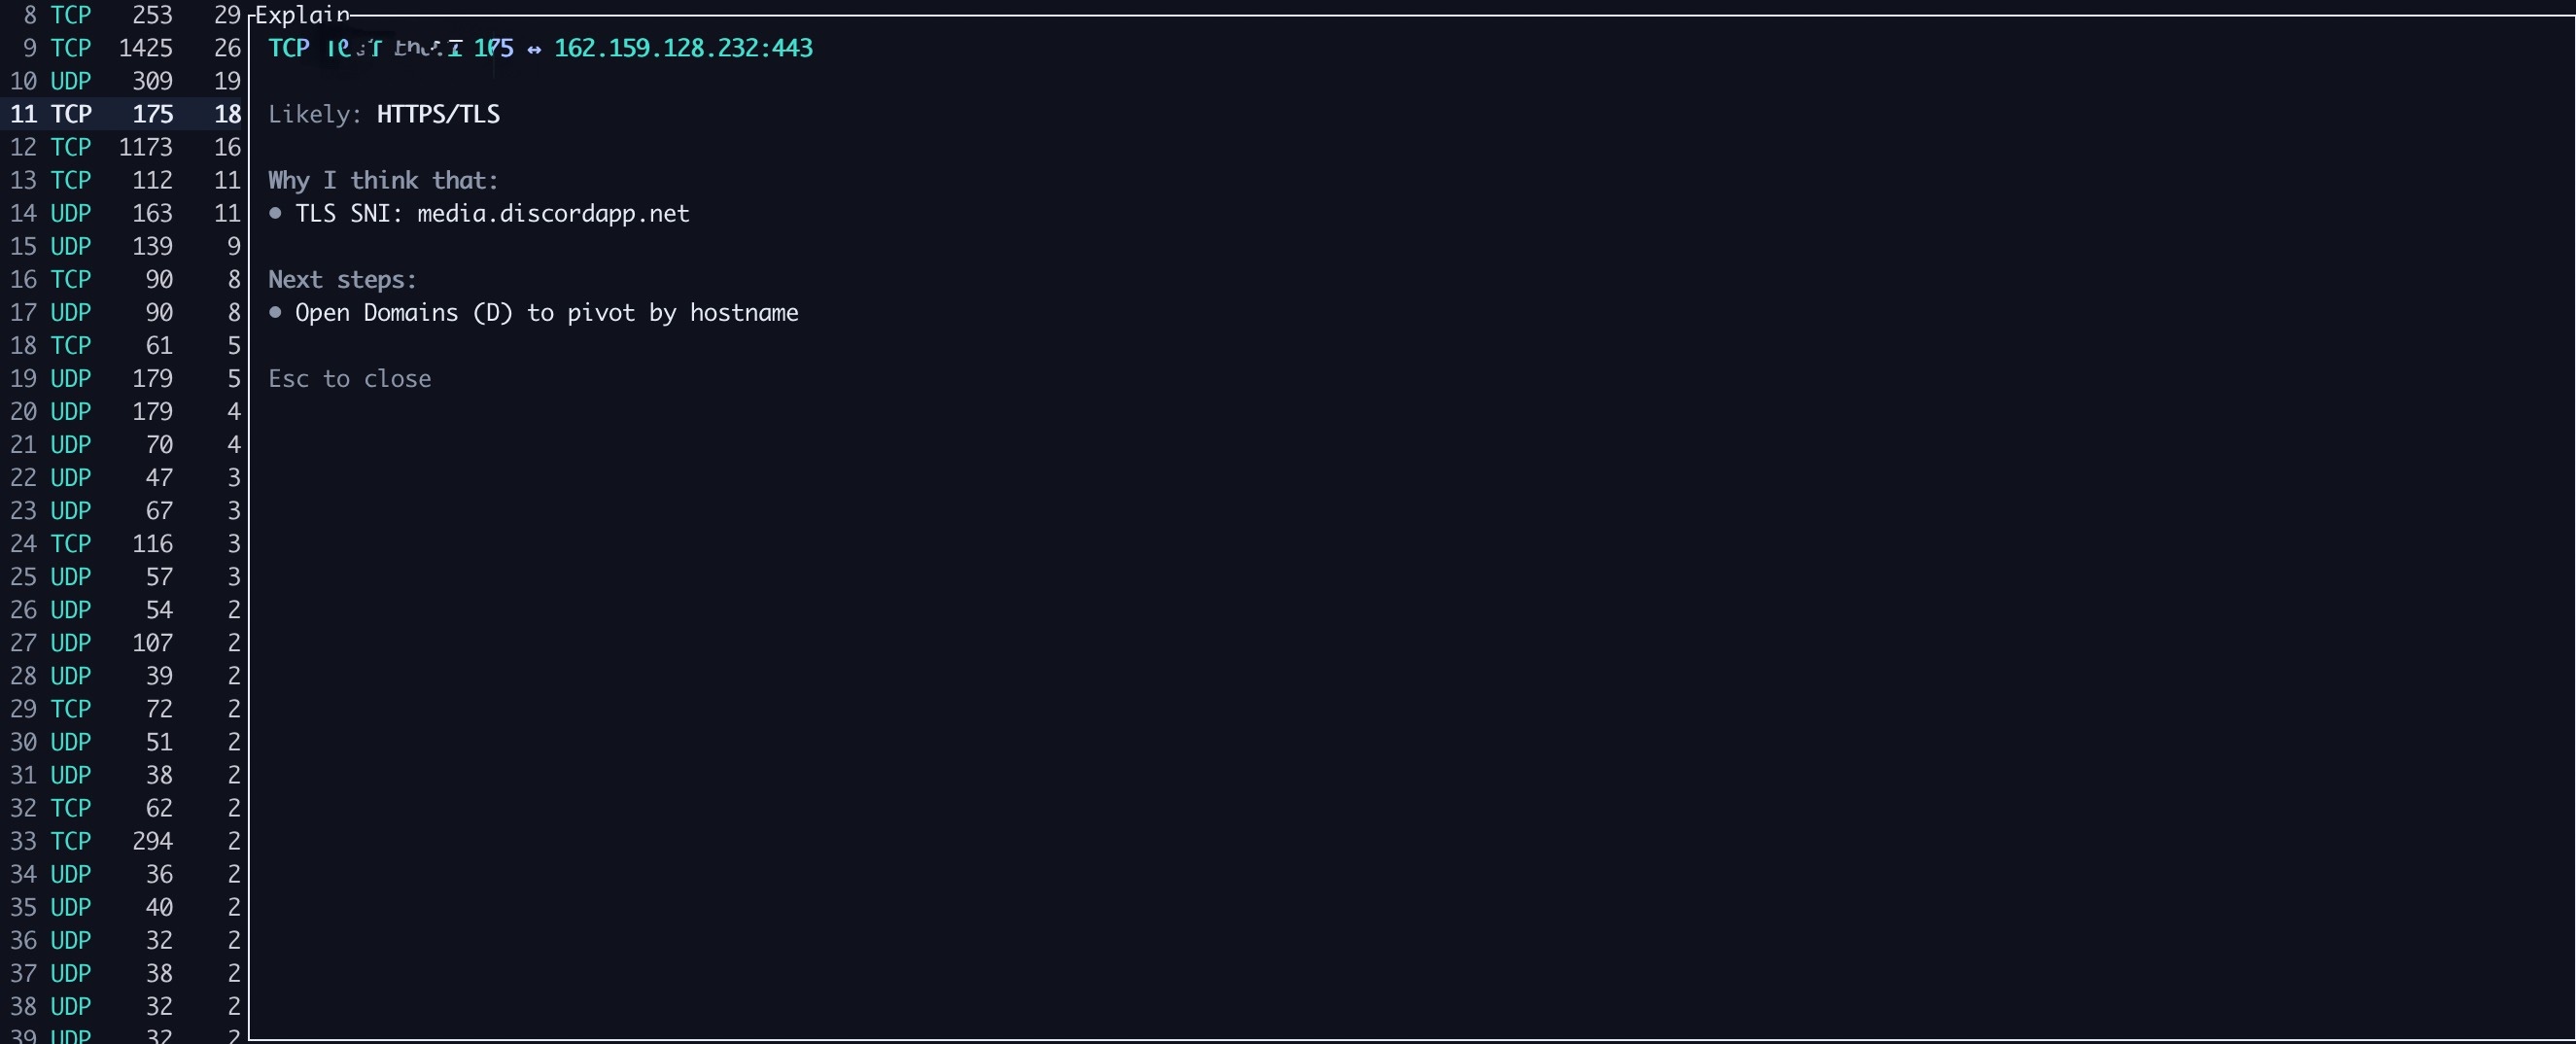
    Expand / Explain (?) gives plain-English context for what you’re looking at.

    • From Flows, press Enter to open Packets, then press ? to open Explain.
    • Explain is best-effort: it tries to classify the flow and show “why I think that” + “next steps”.

    Tip: press h for help and g for glossary.


    Quickstart

    Download a release (recommended)

    Grab a binary from GitHub Releases:

    • https://github.com/vignesh07/babyshark/releases

    Or build from source

    root@kitploit:~
    git clone https://github.com/vignesh07/babyshark
    cd babyshark/rust
    cargo install --path . --force
    babyshark --help
    

    Features

    • Offline: open .pcap / .pcapng and browse:
      • flows list → packets list → follow stream
      • stream search with highlighting + n / N navigation
    • Live: capture and inspect traffic in the TUI:
      • list capture interfaces
      • live capture with optional display filter
      • optional write-to-file while capturing
    • Per-flow analysis:
      • Health badges — colored dot (green/yellow/red) on each flow based on RST, incomplete handshakes, retransmissions
      • Asymmetry labels — DL/UL suffix in flow list + download-heavy/upload-heavy/balanced in details (falls back to A>B/B>A when local side is ambiguous)
      • TCP timing — handshake RTT, server think time, data transfer duration in the details pane
      • TLS version display — shows negotiated version from ServerHello when visible, flags deprecated versions (<= TLS 1.1)
    • Weird detectors:
      • TCP resets, handshake-not-completed, DNS failures, retransmit/OOO hints, high-latency flows
      • Deprecated TLS — flags flows using TLS 1.0 or 1.1
      • Chatty hosts — flags ≥10 flows to the same destination within 60 seconds
    • Timeline view (T):
      • Gantt — phase-colored horizontal bars (handshake / TLS / data / close) with hostname labels
      • Scatter — per-packet direction/retransmit dot plot
      • Color legends, pattern callouts, and plain-English narrative in details
    • Notes/export:
      • bookmark flows
      • export markdown report (latest + timestamped copies)

    Install

    Option A: GitHub Release (recommended)

    Download a prebuilt binary:

    • https://github.com/vignesh07/babyshark/releases

    Option B: build from source

    Prereqs:

    • Rust toolchain (stable)
    • (Live mode only) tshark
    root@kitploit:~
    git clone https://github.com/vignesh07/babyshark
    cd babyshark/rust
    cargo install --path . --force
    babyshark --help
    

    Option C: cargo install (dev-friendly)

    root@kitploit:~
    cargo install --git https://github.com/vignesh07/babyshark --bin babyshark
    

    Install tshark (required for --live)

    tshark is the official Wireshark CLI.

    macOS

    root@kitploit:~
    # macOS (Homebrew)
    brew install wireshark
    

    Linux

    Debian/Ubuntu:

    root@kitploit:~
    sudo apt-get update
    sudo apt-get install -y tshark
    

    Fedora:

    root@kitploit:~
    sudo dnf install -y wireshark-cli
    

    Arch:

    root@kitploit:~
    sudo pacman -S wireshark-cli
    

    Verify:

    root@kitploit:~
    tshark --version
    tshark -D
    

    Permissions note: live capture may require elevated permissions (sudo, dumpcap caps, or being in the wireshark group). If babyshark prints a permission error, follow the guidance it outputs.


    Troubleshooting

    babyshark updated in git but my command still runs old behavior

    If you installed with cargo install, you need to reinstall after pulling:

    root@kitploit:~
    cd babyshark/rust
    cargo install --path . --force
    

    Live capture fails (permissions)

    Try running with sudo:

    root@kitploit:~
    sudo babyshark --live en0
    

    If that works, you likely need to configure capture permissions (dumpcap, wireshark group, etc.) on your OS.

    Domains shows ips=0 for everything

    This often happens when DNS answers aren’t visible (DoH/DoT or cached). Babyshark will still show Observed IPs (from flows) using TLS SNI / HTTP Host hints when available.


    Usage

    Offline PCAP

    root@kitploit:~
    babyshark --pcap ./capture.pcap
    

    List live interfaces

    root@kitploit:~
    babyshark --list-ifaces
    

    Live capture

    root@kitploit:~
    babyshark --live en0
    

    Live capture with Wireshark display filter

    root@kitploit:~
    babyshark --live en0 --dfilter "tcp.port==443"
    

    Live capture and write to file

    root@kitploit:~
    babyshark --live en0 --write-pcap /tmp/live.pcapng
    

    Example screens (sanitized)

    These are text-only examples of what you’ll see in the TUI. IPs/domains are anonymized.

    Overview (live)

    root@kitploit:~
    PCAP Viewer
    babyshark   Overview  flows:114 packets:4227  tcp:on udp:on q=—
    
    Overview  (D domains, W weird, F flows)
    In plain English
    Packets: 4227   Flows: 114   Top talker: 10.0.0.6 (2711.9KB)   Top talker (pkts): 10.0.0.6 (4046 pkts)
    Live: 88s   pps~14.6   dropped~0   | last: Capturing on 'Wi‑Fi: en0'
    
    pps: ▁▁▂▂▃▄▅▆▆▇▆▅▄▃▂▂▁  (max 1372/bucket)
    
    Top flow (bytes): UDP 10.0.0.6:57315 ↔ 203.0.113.123:443 (1359.3KB)
    Top flow (pkts):  UDP 10.0.0.6:57315 ↔ 203.0.113.123:443 (1284 pkts)
    
    What should I click?
    • Domains (human view)  (press D)
    • Weird stuff (troubleshoot)  (press W)
    • Flows (raw)  (press F)
    • Timeline (Gantt + Scatter)  (press T)
      ↳ Detected: High-latency flows (rough) (29 flows)
    

    Domains

    root@kitploit:~
    Domains  (Enter show flows, s sort (conn/bytes/fail), c clear, Esc back)
    
      1 wikipedia.com                      conn=9  bytes=21.0KB  q=9  r=6  fail=0  ips=2
    ❯ 2 chat.openai.com                    conn=5  bytes=28.2KB  q=5  r=3  fail=0  ips=2
    
    Domain details
    chat.openai.com
    
    queries=5 responses=3 failures=0
    
    Observed IPs (from flows):
    10.0.0.6
    198.51.100.42
    
    Tip: Enter applies a subset filter (prefers observed IPs; DNS IPs if available).
    

    Weird stuff

    root@kitploit:~
    Weird stuff  (Enter show flows, c clear, Esc back)
    
    ❯ 1 High-latency flows (rough)                          flows=42
      2 Chatty hosts (burst connections)                    flows=28
      3 TCP reliability hints (retransmits / out-of-order)  flows=16
      4 TCP resets (RST)                                    flows=11
      5 Deprecated TLS versions (≤ 1.1)                     flows=3
      6 Handshake not completed                             flows=0
      7 DNS failures (NXDOMAIN/SERVFAIL)                    flows=0
    
    Why it matters
    High-latency flows (rough)
    
    If a flow takes a long time and has lots of packets, it can indicate latency,
    congestion, or retries. This is a rough heuristic and depends on correct timestamps.
    

    Timeline

    root@kitploit:~
    Timeline: Gantt  (Tab switch, ↑/↓ move, Enter packets, Esc back)
    █ handshake  █ TLS  █ data  █ close  █ UDP
    09:31:02        09:31:10        09:31:18        09:31:26
    
      google.com (HTTPS)   ● ██████████████████████████████████
      chat.openai.com (HT… ● ████████████████
      wikipedia.org (HTTPS) ●  ██████████████████████████
      DNS 10.0.0.1:53      ● ██
    Pattern: 3 connections opened simultaneously — likely a page load
    Pattern: 2 DNS lookups preceded 3 encrypted connections to matching hosts
    
    Details
    TCP 10.0.0.6:57608 ↔ 198.51.100.42:443
    
    What happened
    
    1. Connected to google.com (TCP handshake took 12.5ms)
    2. Negotiated encryption (TLS 1.3)
    3. Transferred 28.2KB in 89ms (40 packets)
    4. Mostly downloading (server sent more data)
    5. Connection closed cleanly (FIN)
    

    Timeline is the visual story of your capture. It shows when each connection started, what phases it went through (handshake, TLS, data transfer, close), and how they overlap.

    • Gantt — horizontal bars colored by TCP phase, with hostname labels
    • Scatter — per-packet dots colored by direction (you→server, server→you, retransmit)
    • Patterns — automatic callouts for simultaneous opens, DNS→TLS hostname/time correlations, retransmission warnings
    • Narrative — plain-English "What happened" in the details panel (uses upload/download wording only when local side is inferable)

    Flows

    root@kitploit:~
    Flows [LIVE en0] (63.8 pps)  (Enter packets, / filter, t/u toggles, b bookmark, E export, o overview)  subset=domain:chat.openai.com
    
    ● 1 UDP  510   10.0.0.6:59175 ↔ 203.0.113.123:443 DL
    ❯● 2 TCP   32   10.0.0.6:57608 ↔ 198.51.100.42:443 DL
    
    Details
    TCP 10.0.0.6:57608 ↔ 198.51.100.42:443
    
    A→B: 14 pkts / 1386 bytes
    B→A: 26 pkts / 26307 bytes
    Direction: download-heavy
    
    Handshake RTT: 12.450ms
    Server think:  3.200ms
    Data transfer: 89.100ms
    
    TLS version: TLS 1.2
    
    bookmarks: 1
    

    Keybindings (TUI)

    Top-level:

    • o overview
    • D domains
    • W weird stuff
    • F flows
    • T timeline (Gantt + Scatter)
    • h help
    • g glossary
    • q quit

    In views:

    • Enter drill down (domains/weird → flows, flows → packets)
    • Esc back
    • c clear active subset filter
    • ? explain selected flow
    • x dismiss onboarding hint (Overview)

    Flows view:

    • ↑/↓ or j/k move
    • / filter
    • t / u toggle TCP / UDP
    • b bookmark flow
    • E export report

    Timeline view:

    • Tab / Shift-Tab switch Gantt / Scatter
    • ↑/↓ or j/k move
    • PgUp/PgDn page
    • Enter drill into Packets

    Packets view:

    • f follow stream

    Stream view:

    • / search
    • n / N next / prev match
    • Tab / Shift-Tab cycle stream direction
    • ↑/↓ scroll

    Output files

    When you bookmark/export, babyshark writes next to the PCAP in a hidden directory:

    • .babyshark/case.json — bookmarks
    • .babyshark/report.md — latest report (overwritten)
    • .babyshark/report-YYYYMMDD-HHMMSS.md — versioned reports

    Roadmap

    • Prettier onboarding + docs (screenshots/gifs)
    • --bpf capture filter pass-through for live mode
    • Even better protocol hints + flow classification
    • Improved TCP reassembly (gap/retransmit markers)
    • Packaging improvements (TBD)

    License

    MIT © 2026 Vignesh Natarajan