OpenClaw Agent Dashboard



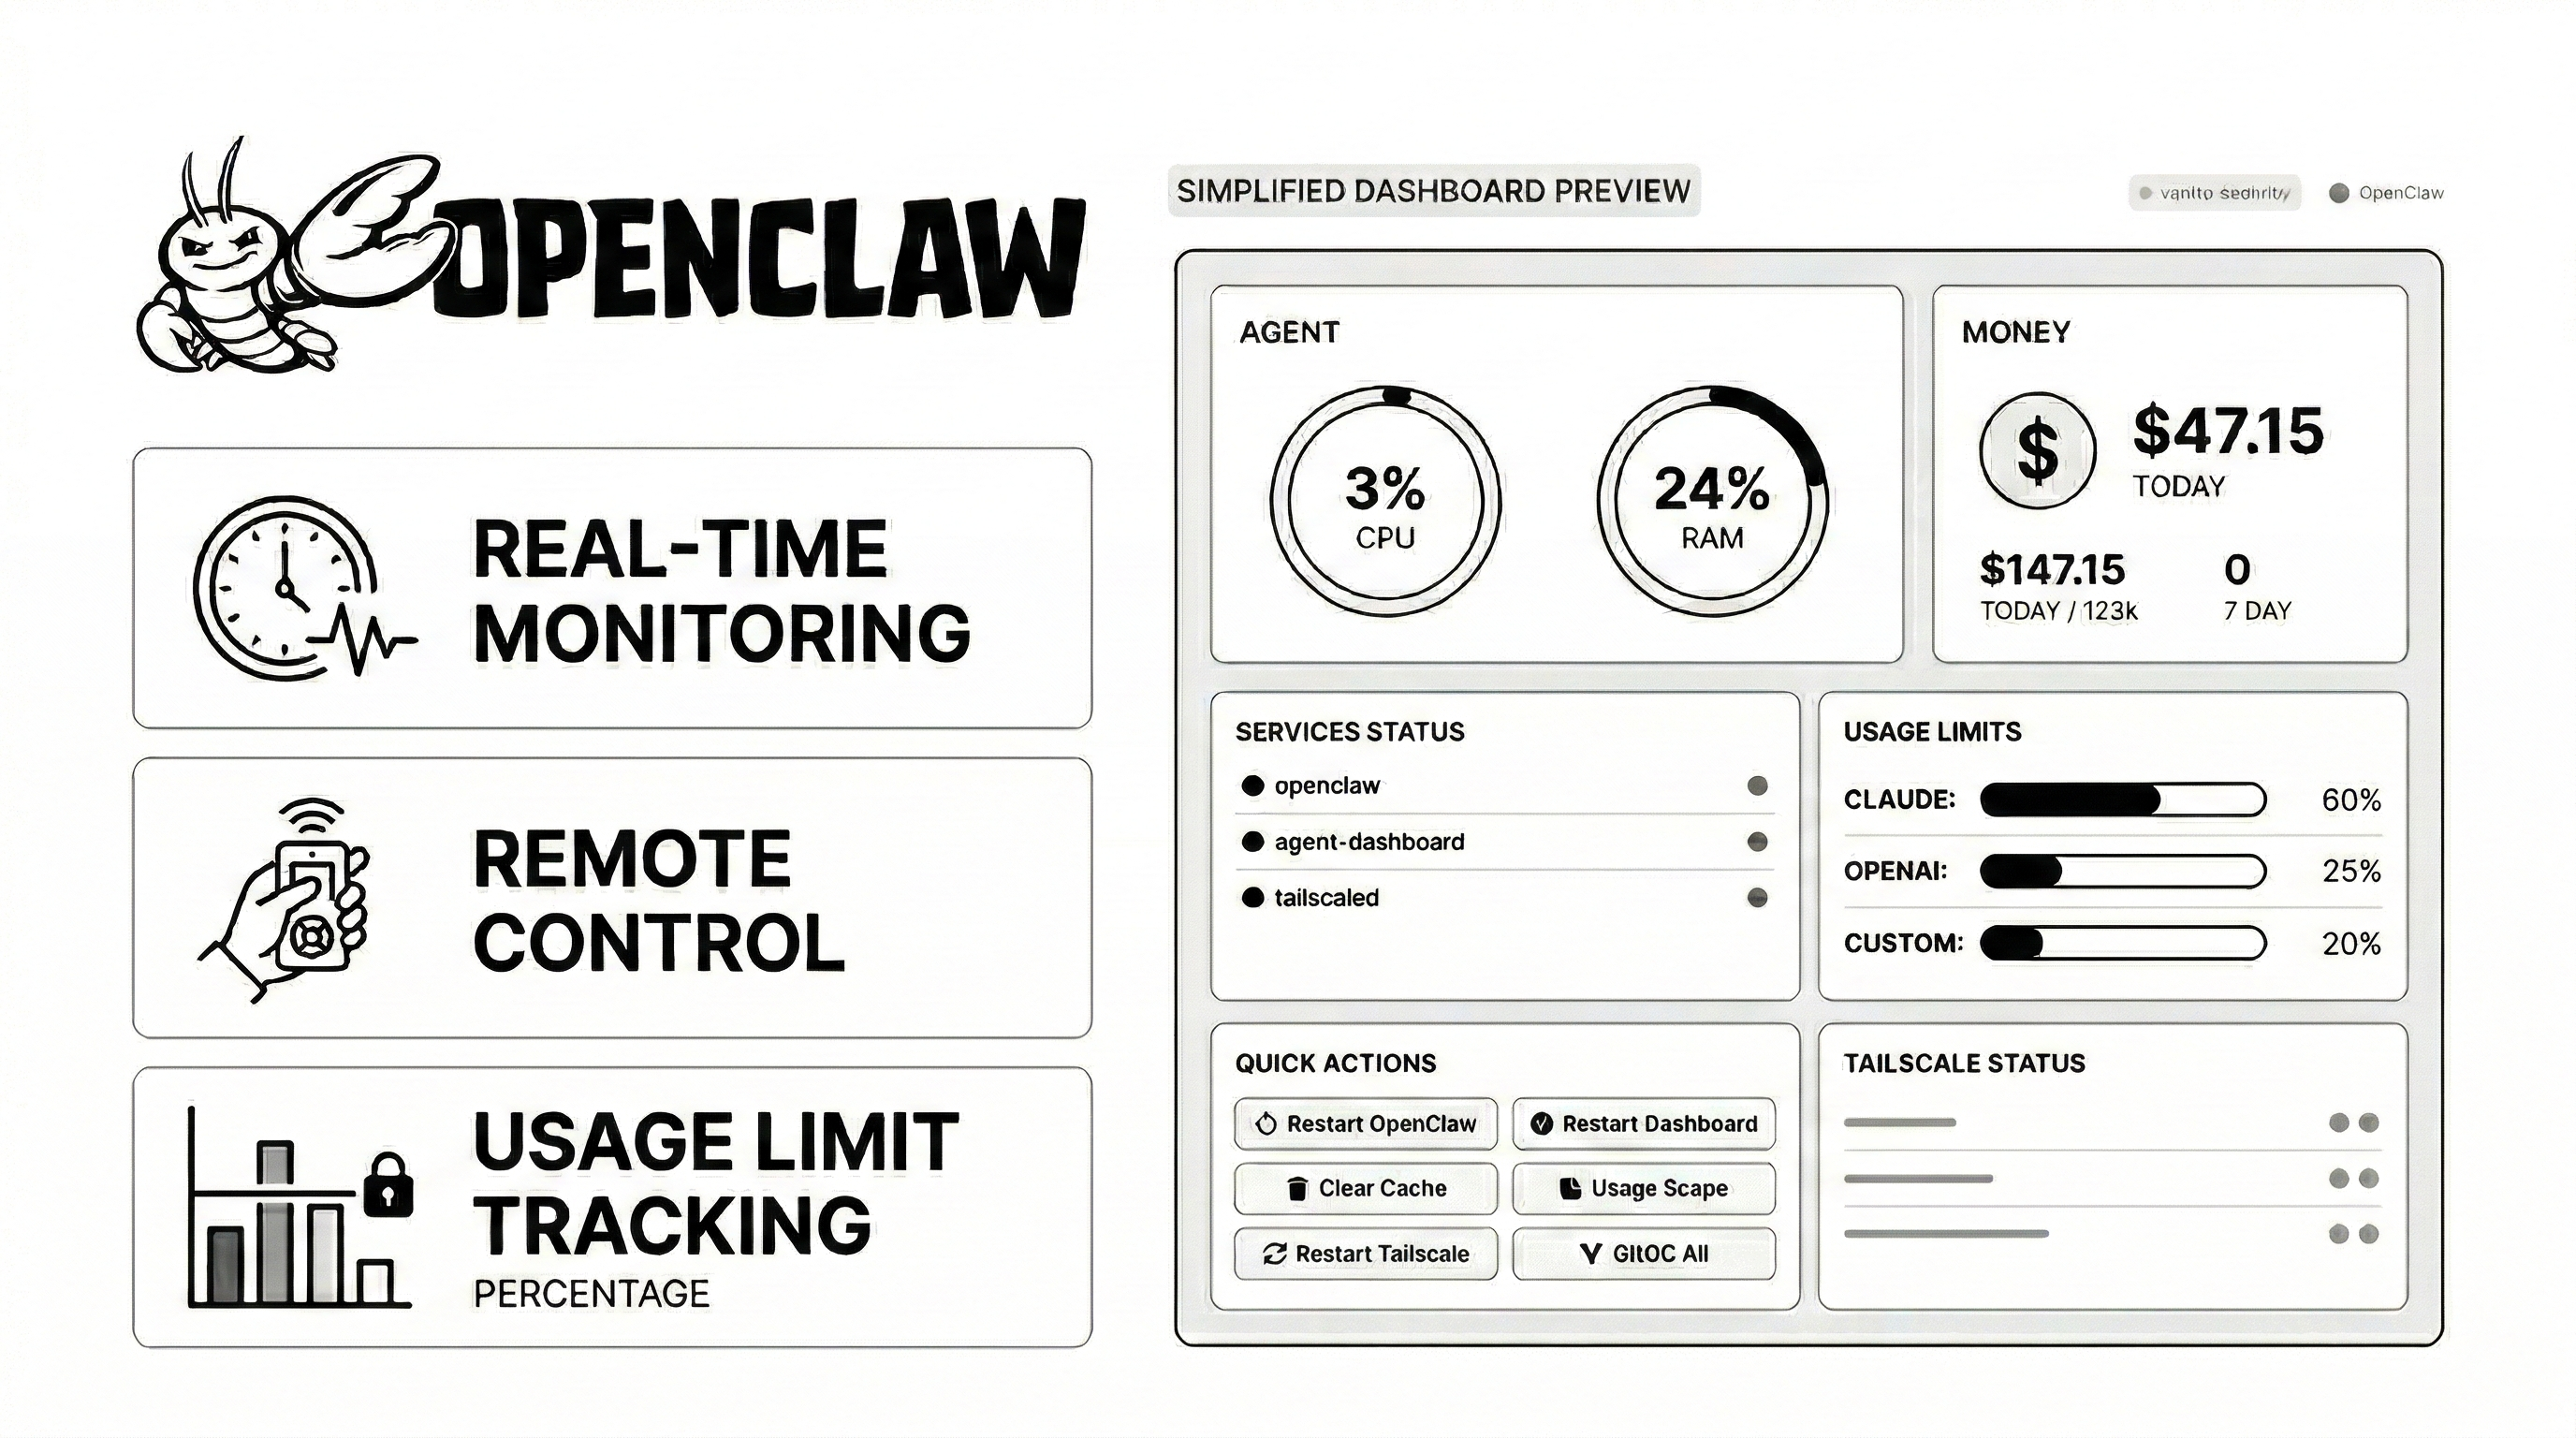
A beautiful, secure, real-time monitoring dashboard for OpenClaw agents. Track sessions, monitor API usage, view costs, manage memory files, and keep tabs on system health — all in one place.
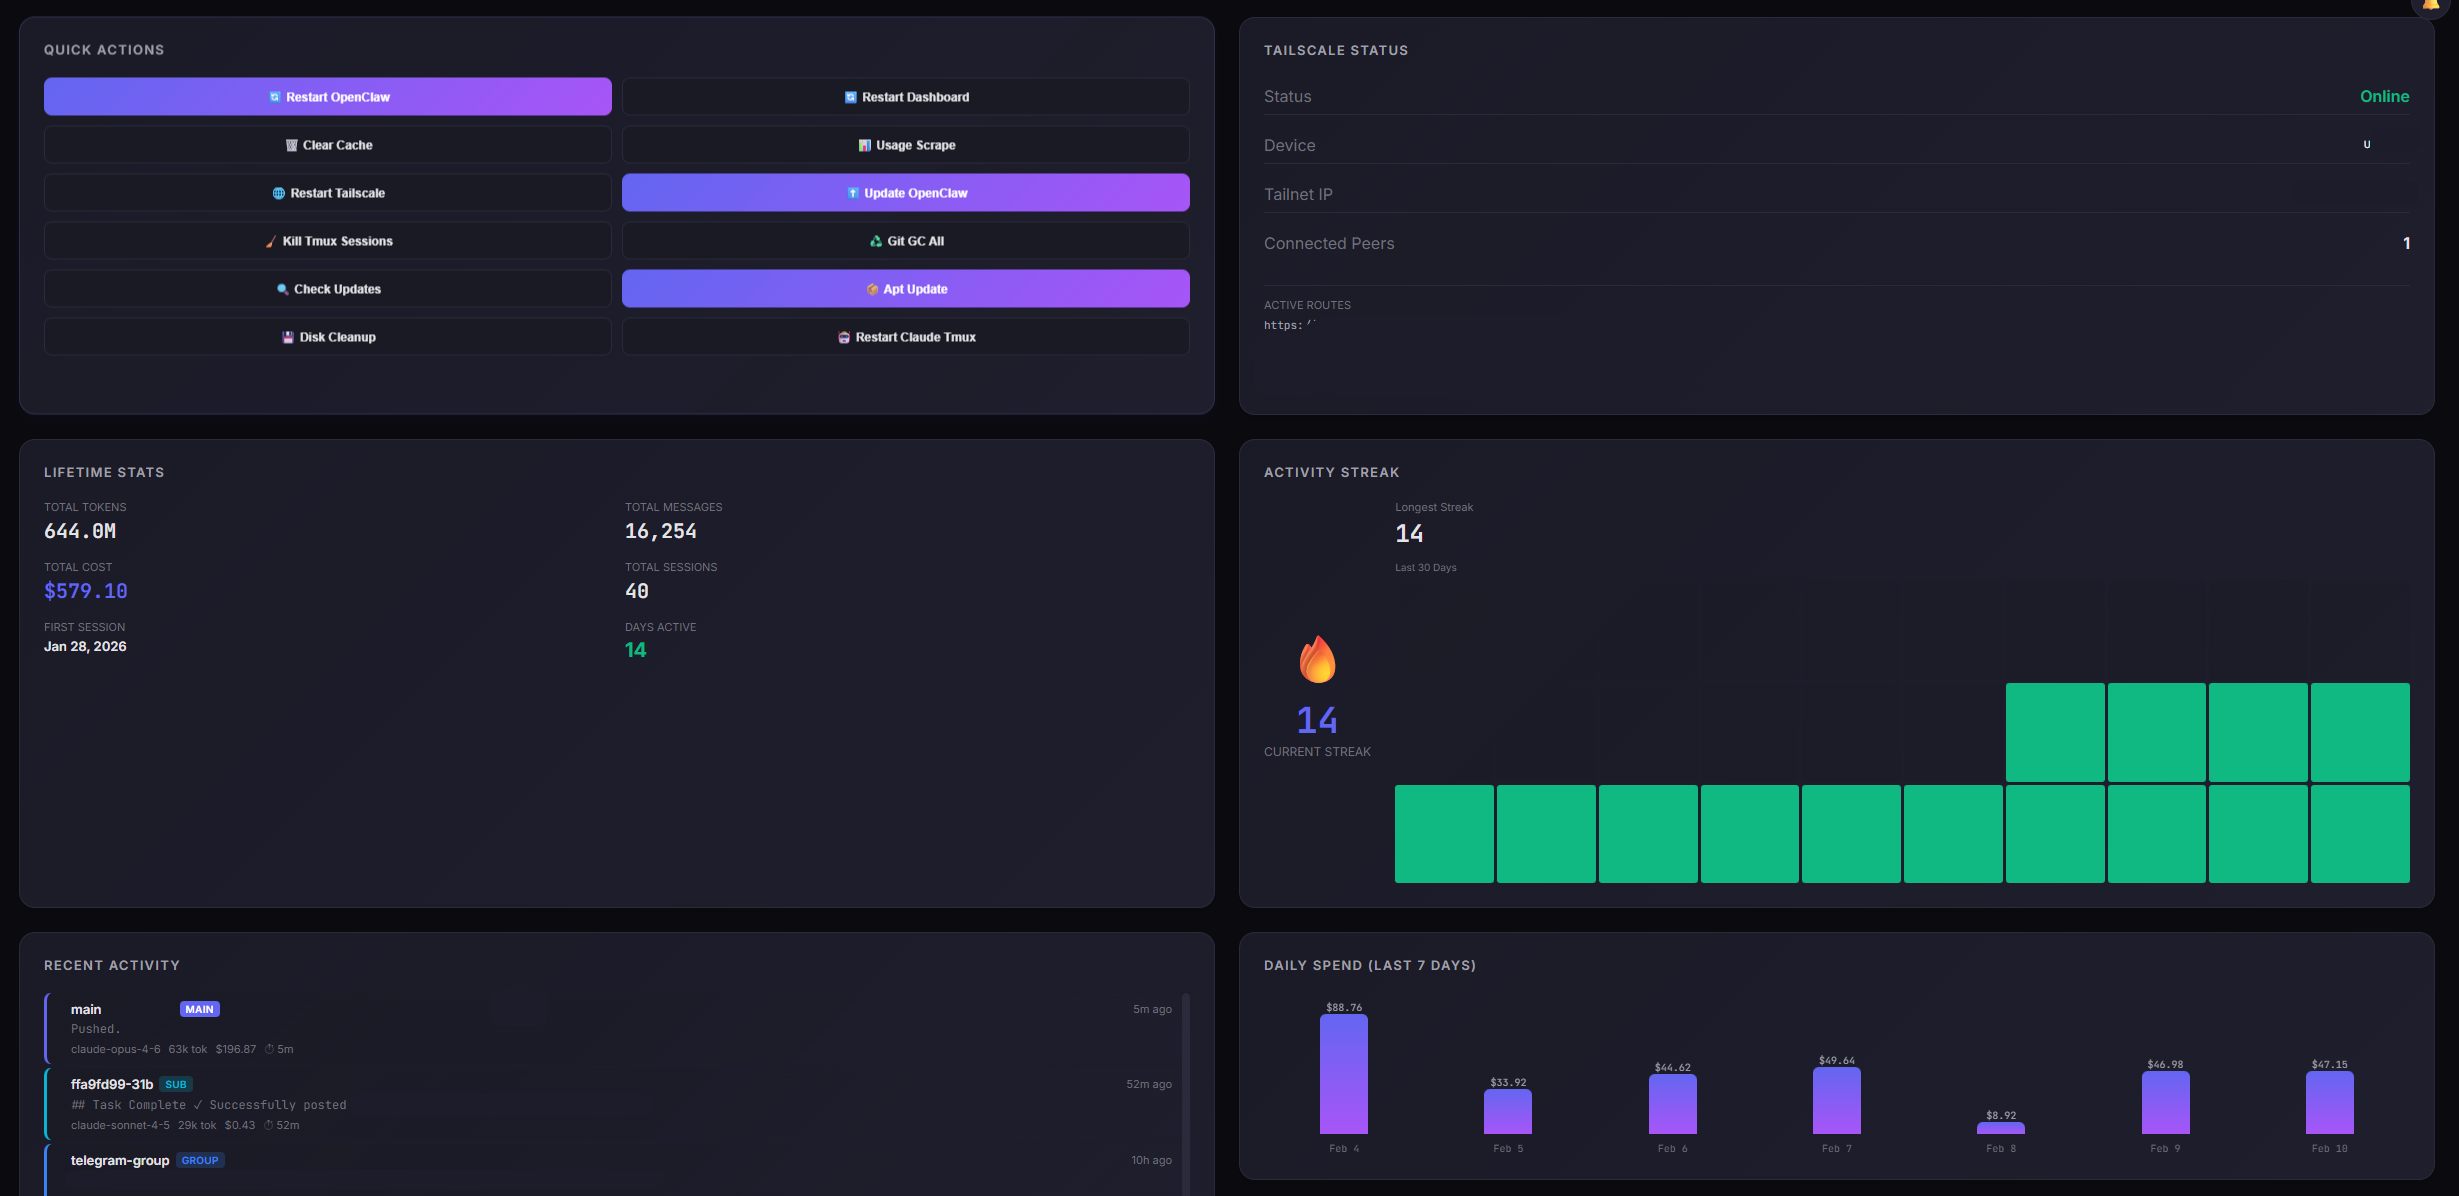
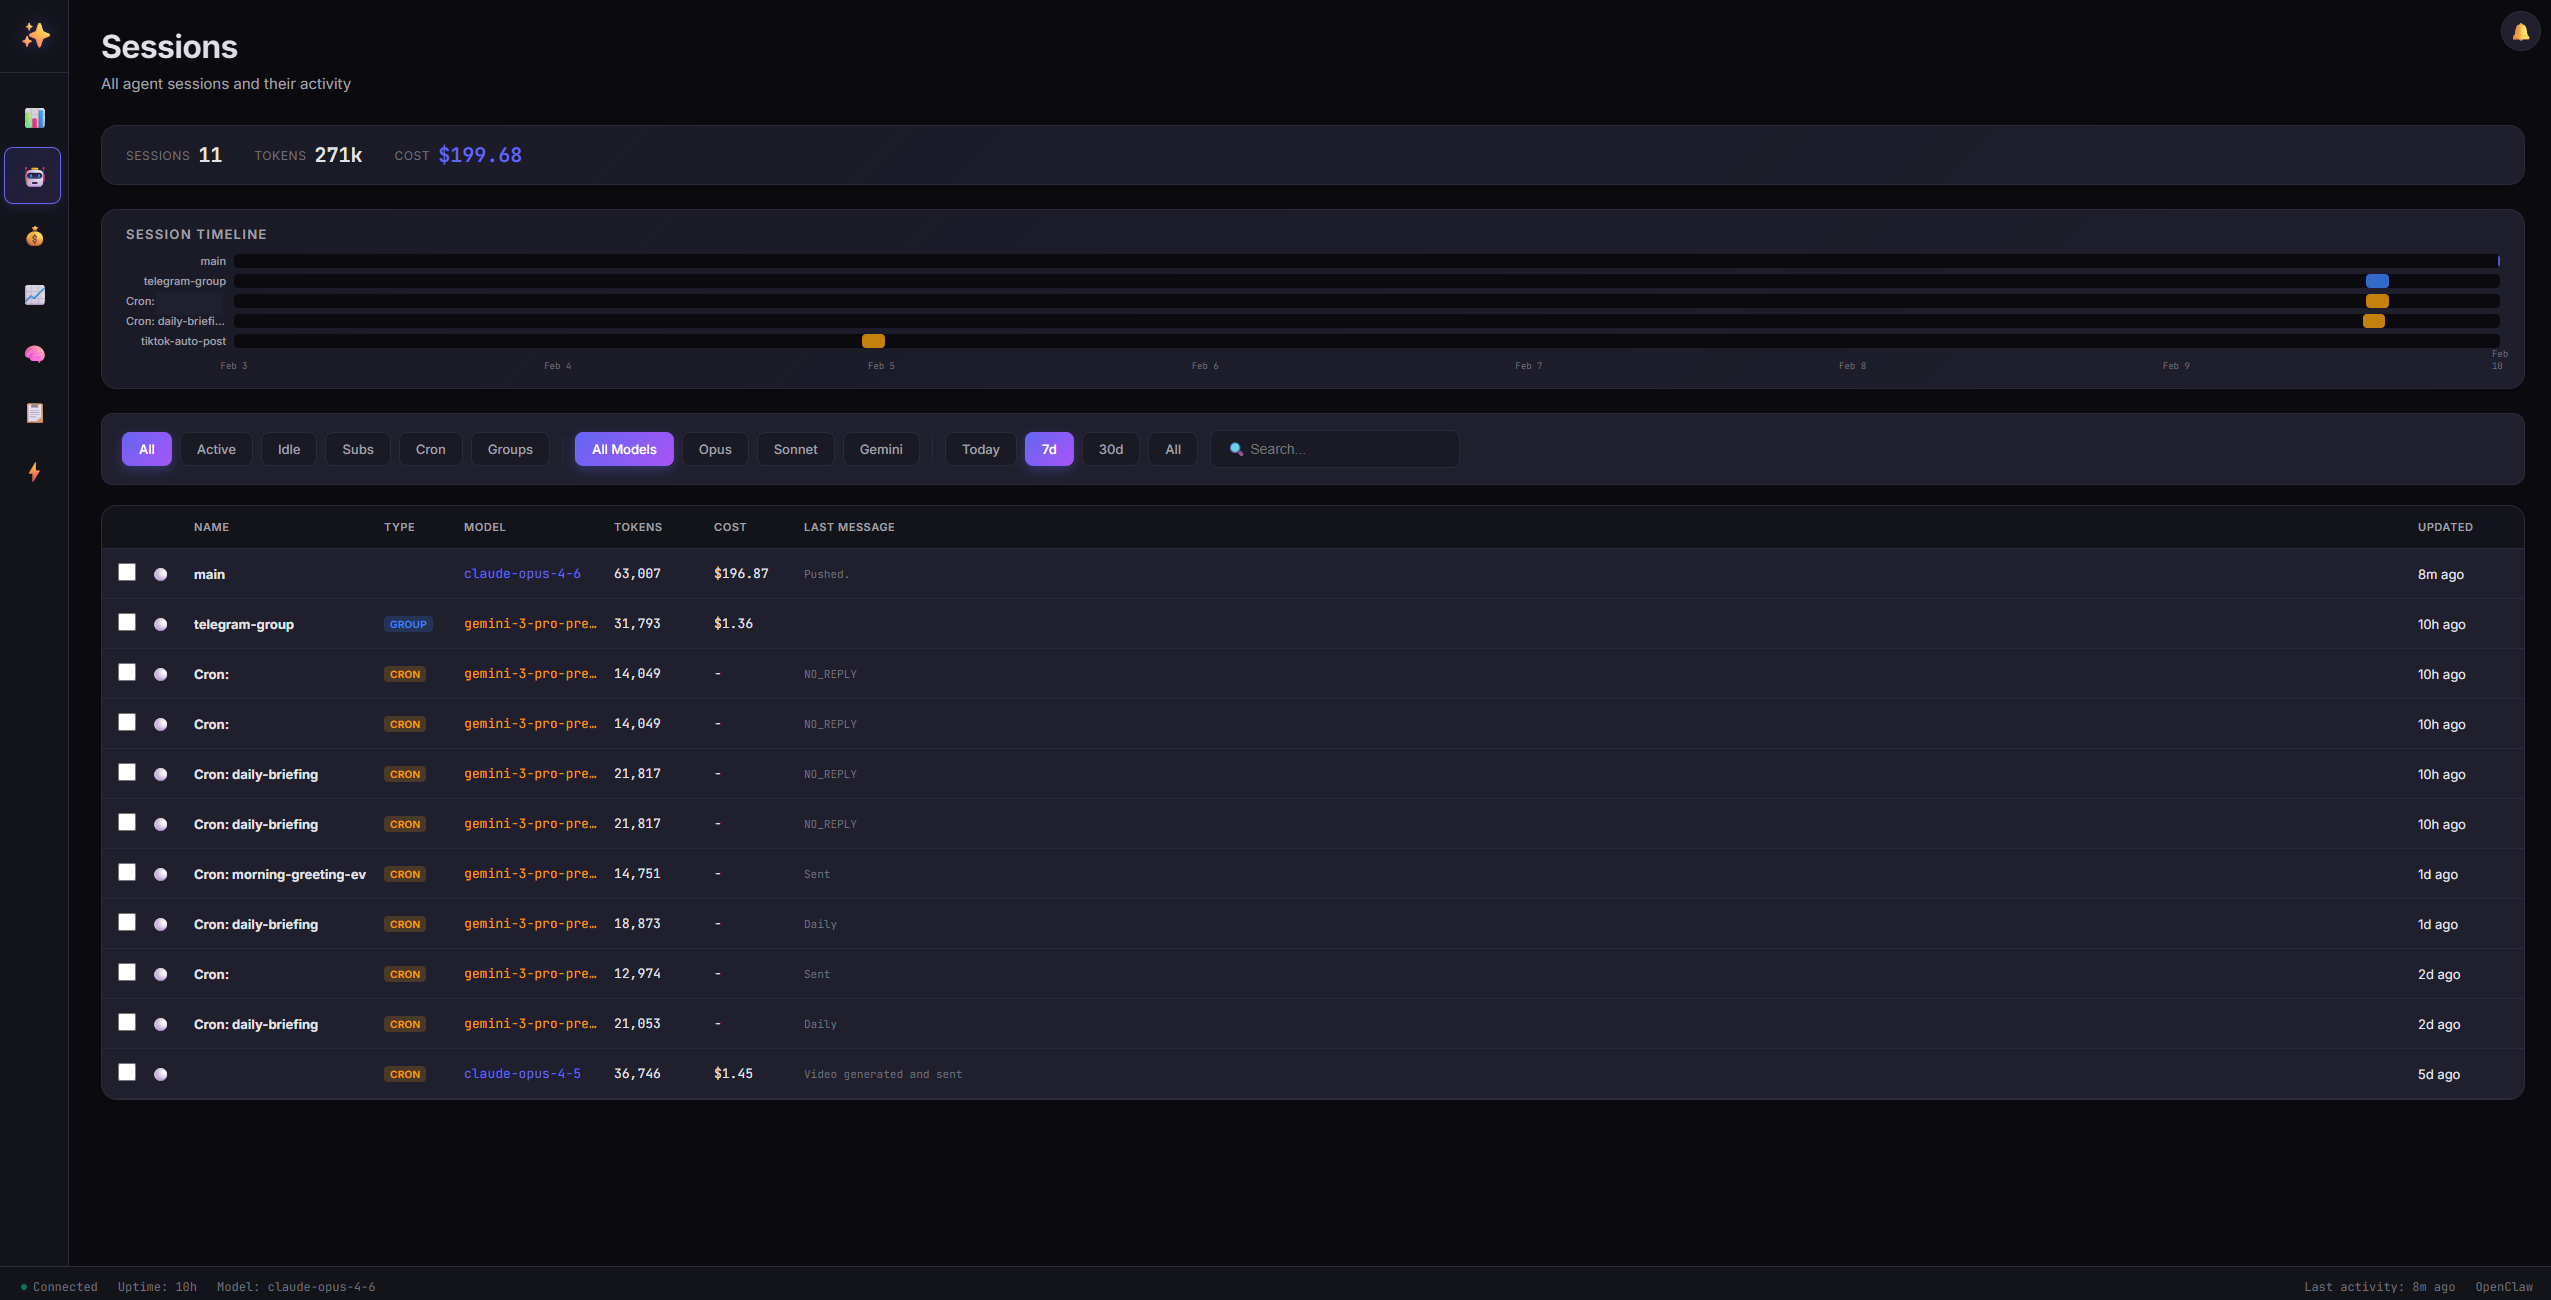
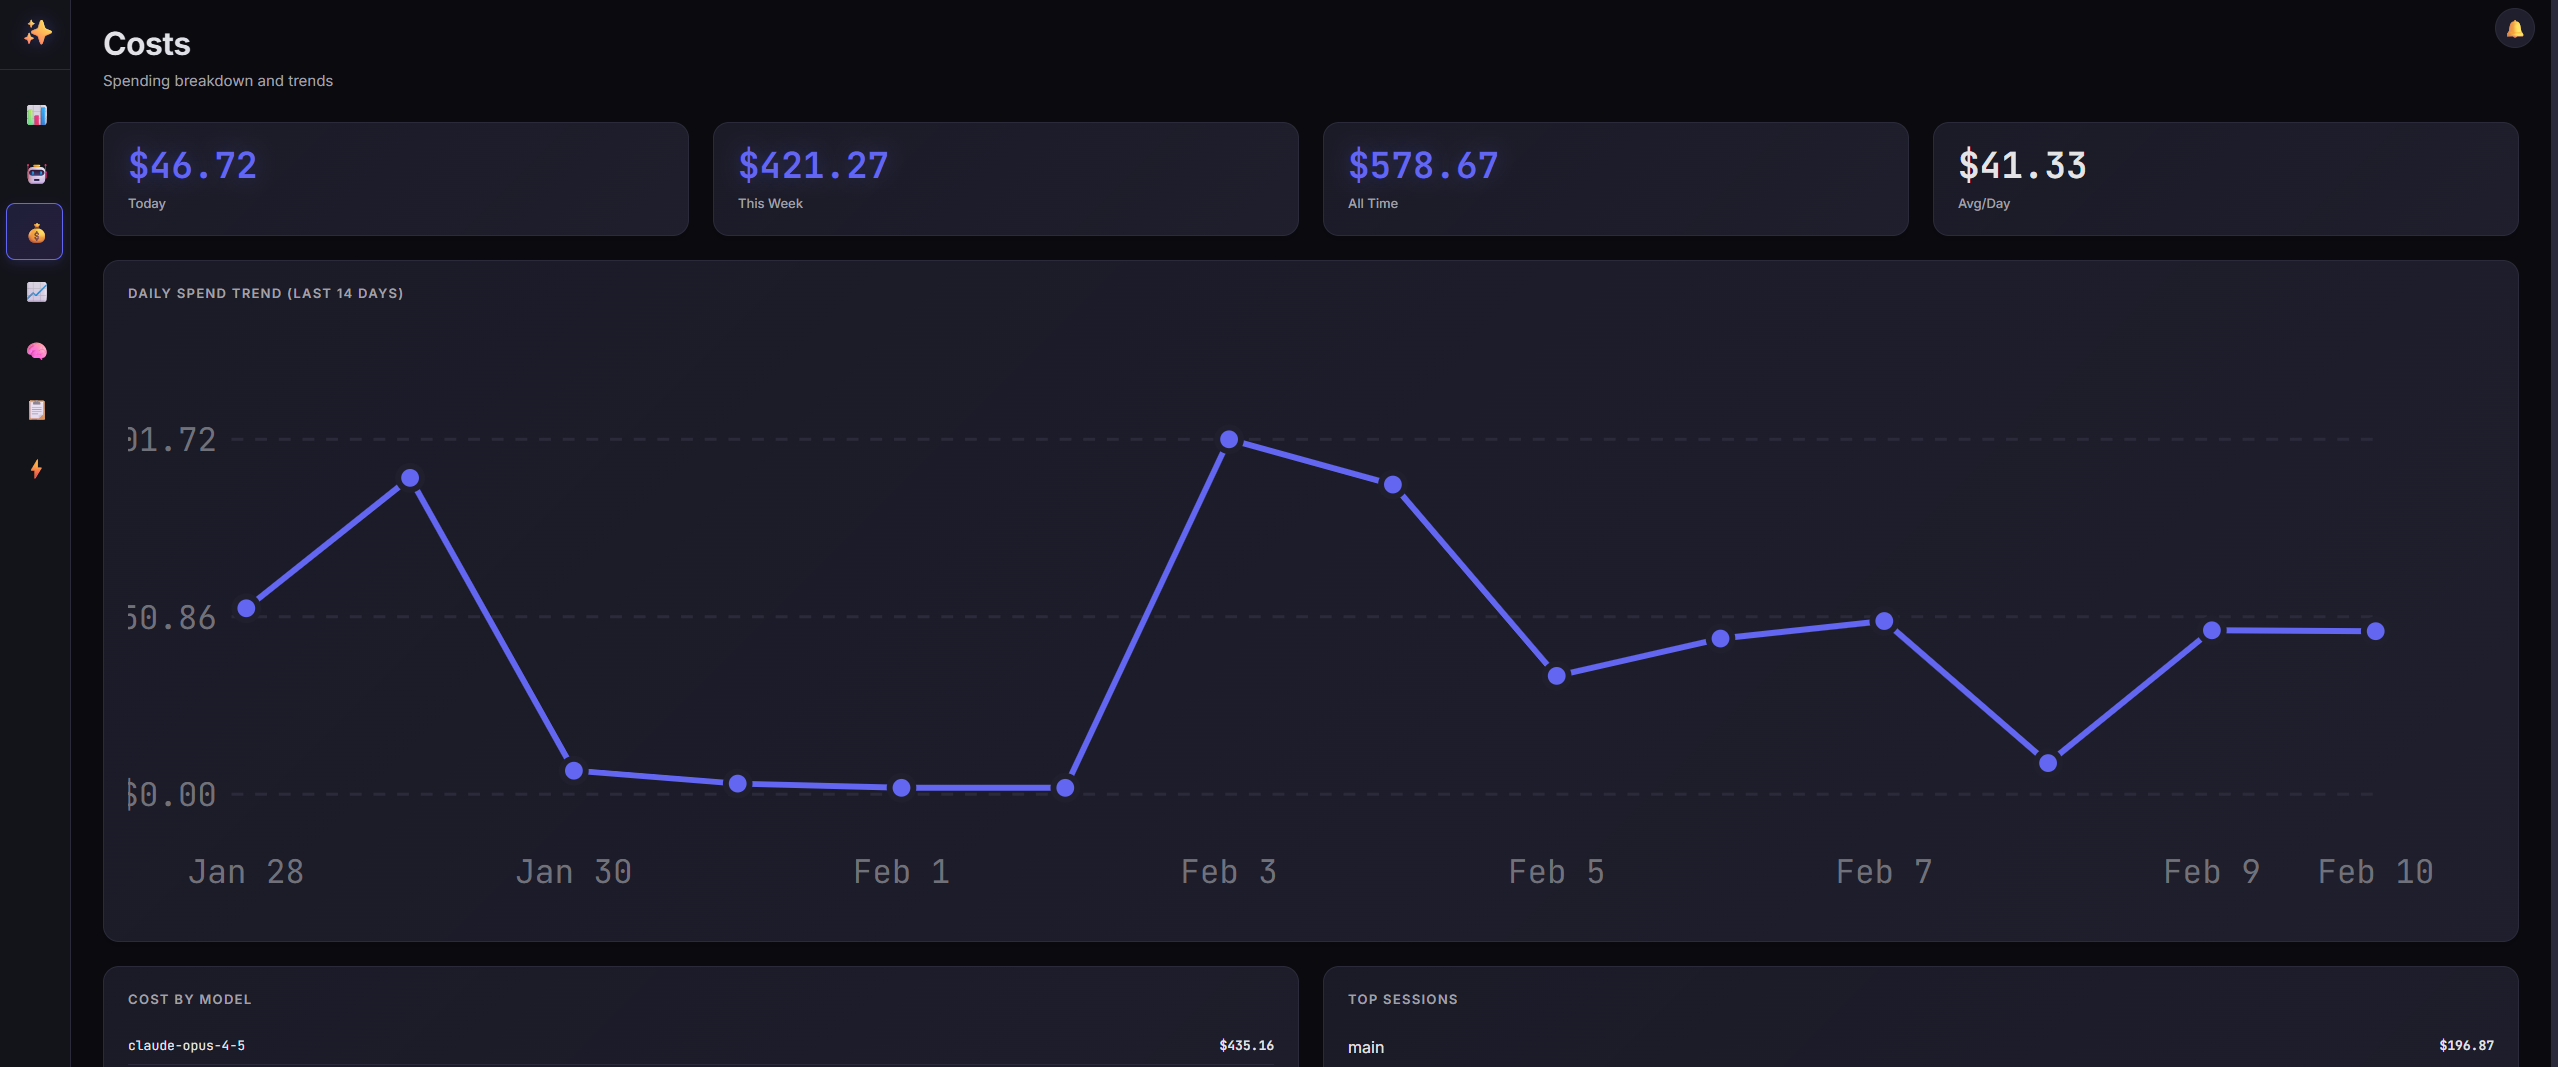
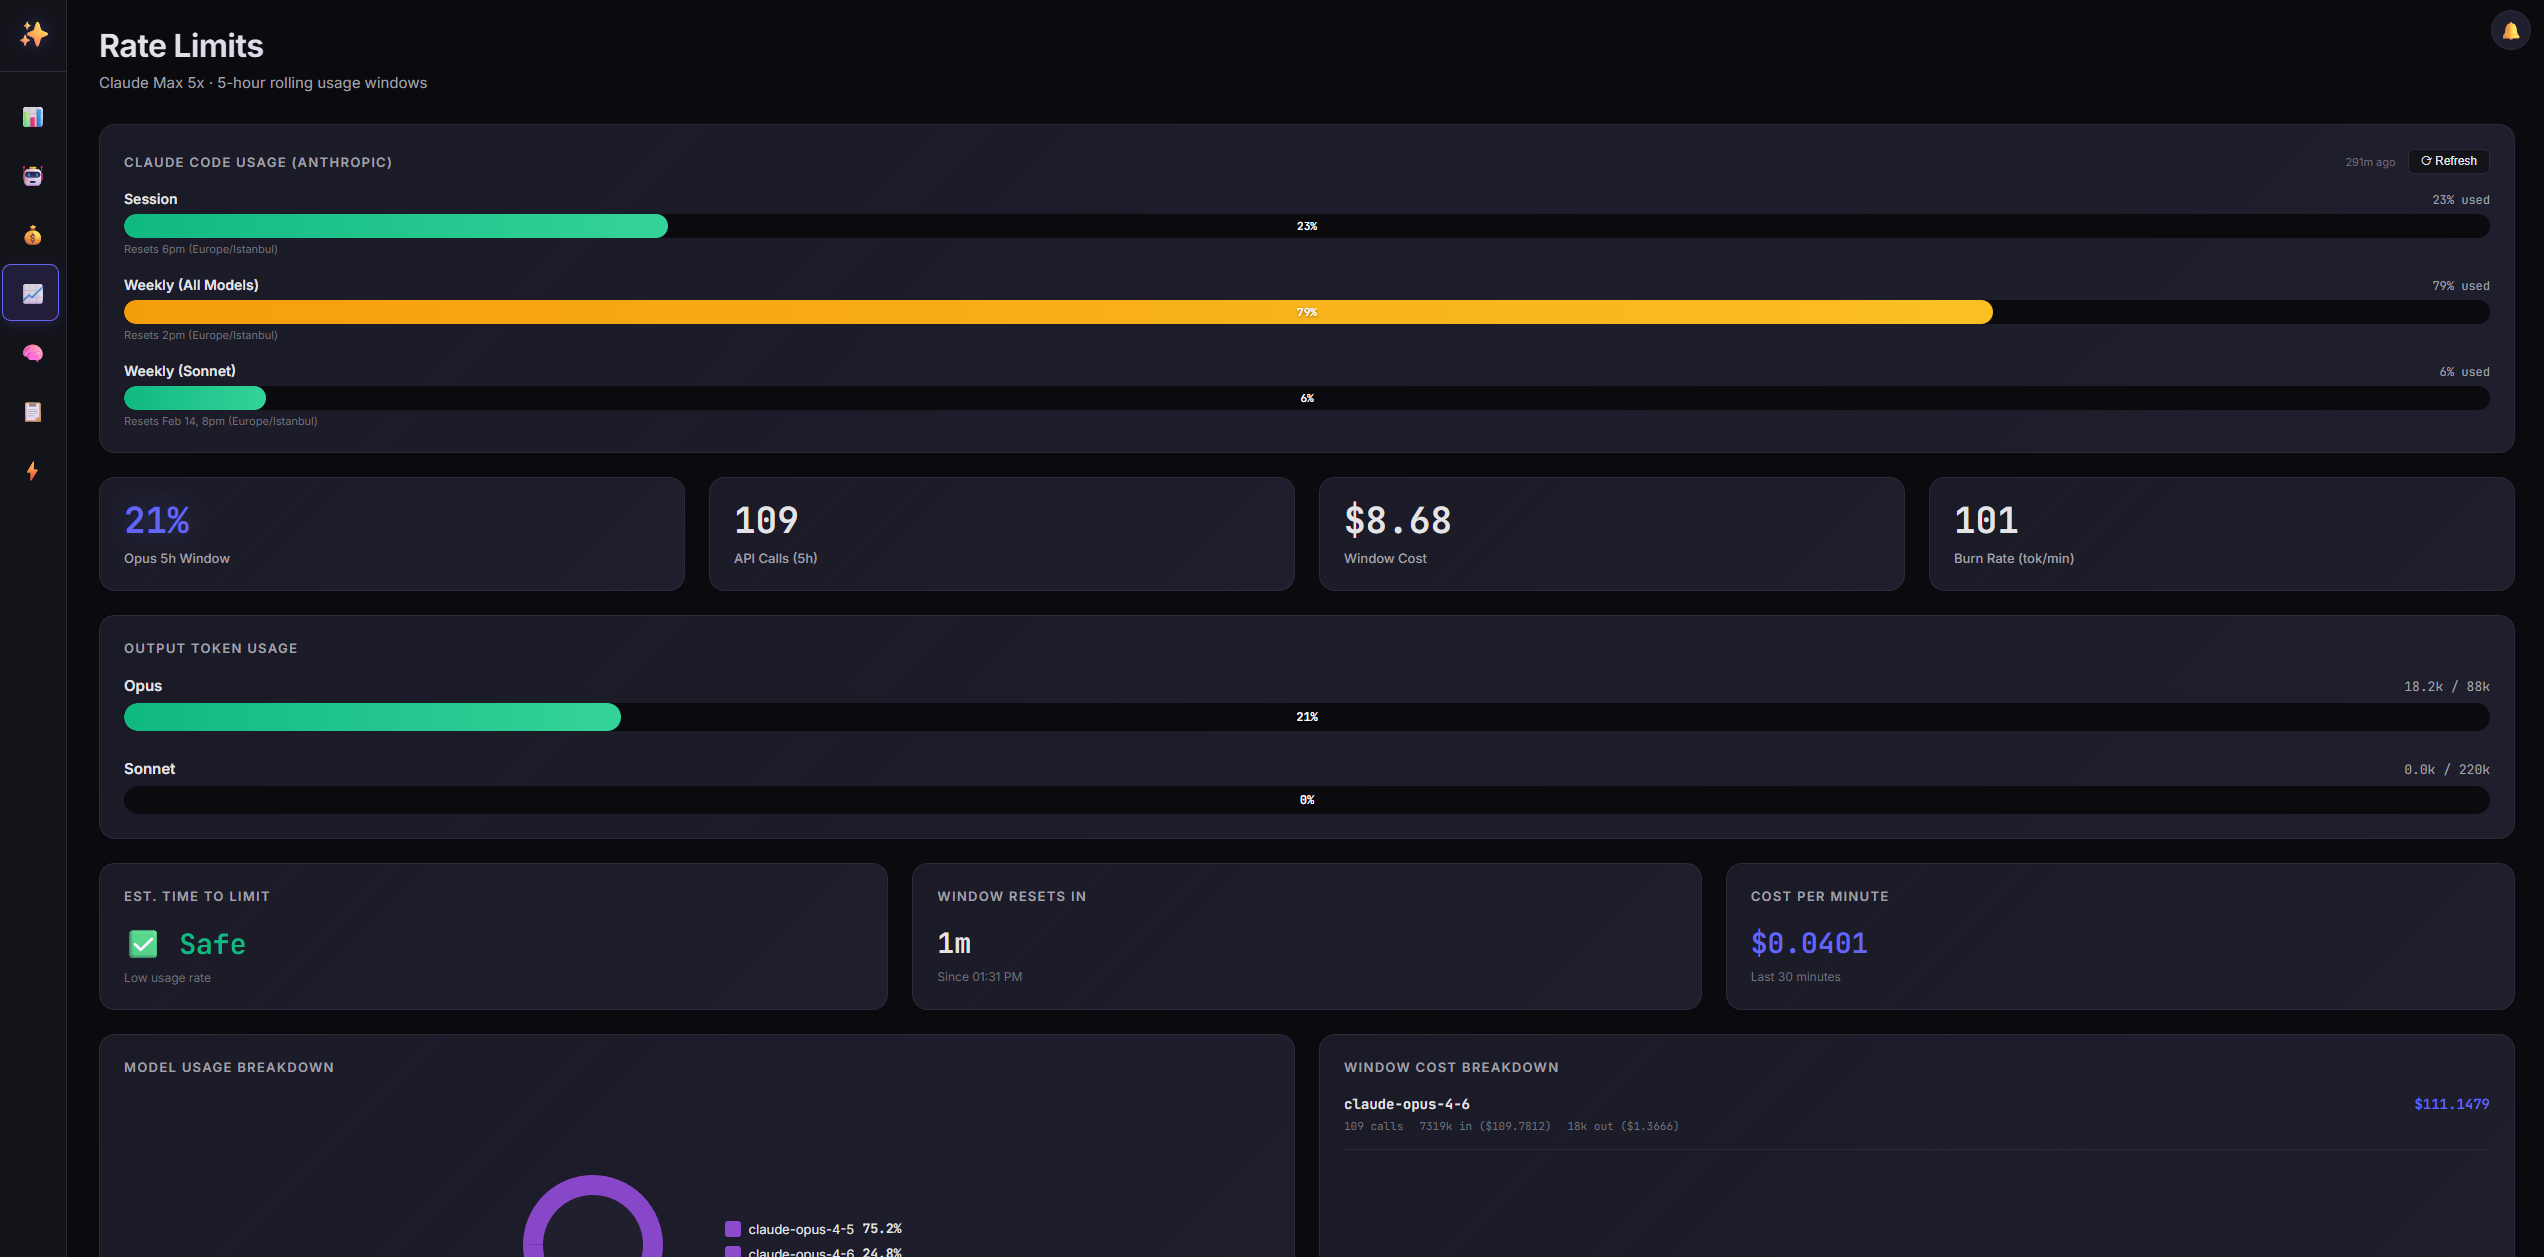
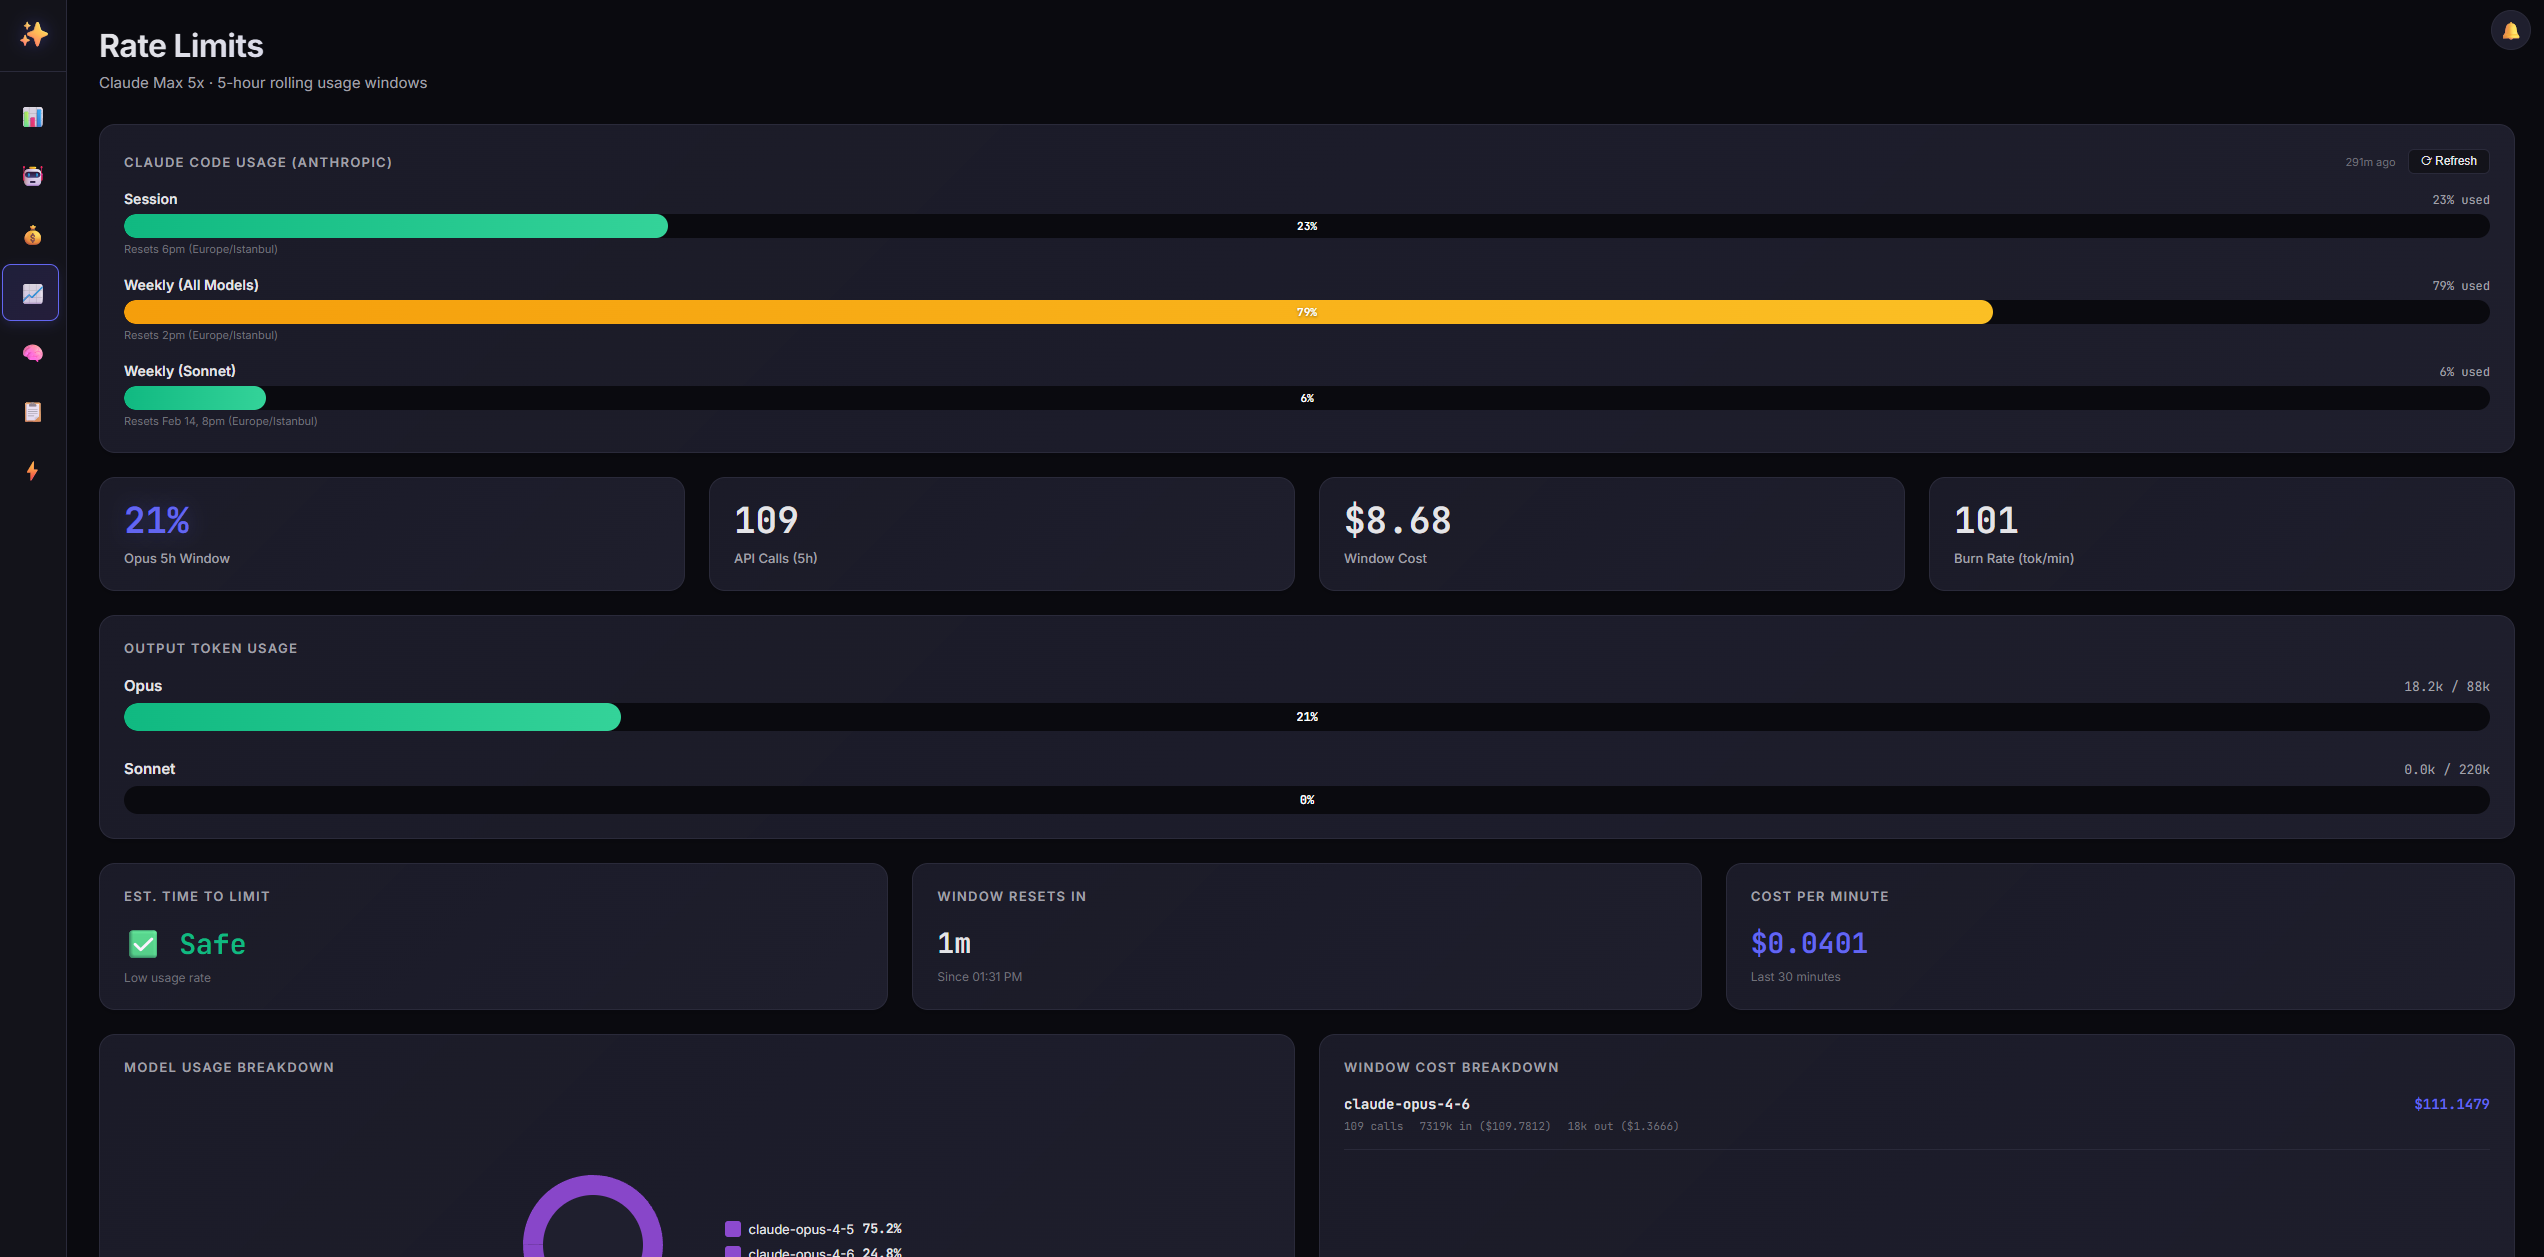
📸 Screenshots
✨ Features
- 🤖 Session Management - View all agent sessions with real-time activity status
- 📊 Rate Limit Monitoring - Track Claude and Gemini API usage against rolling windows
- 💰 Cost Analysis - Detailed spending breakdowns by model, session, and time period
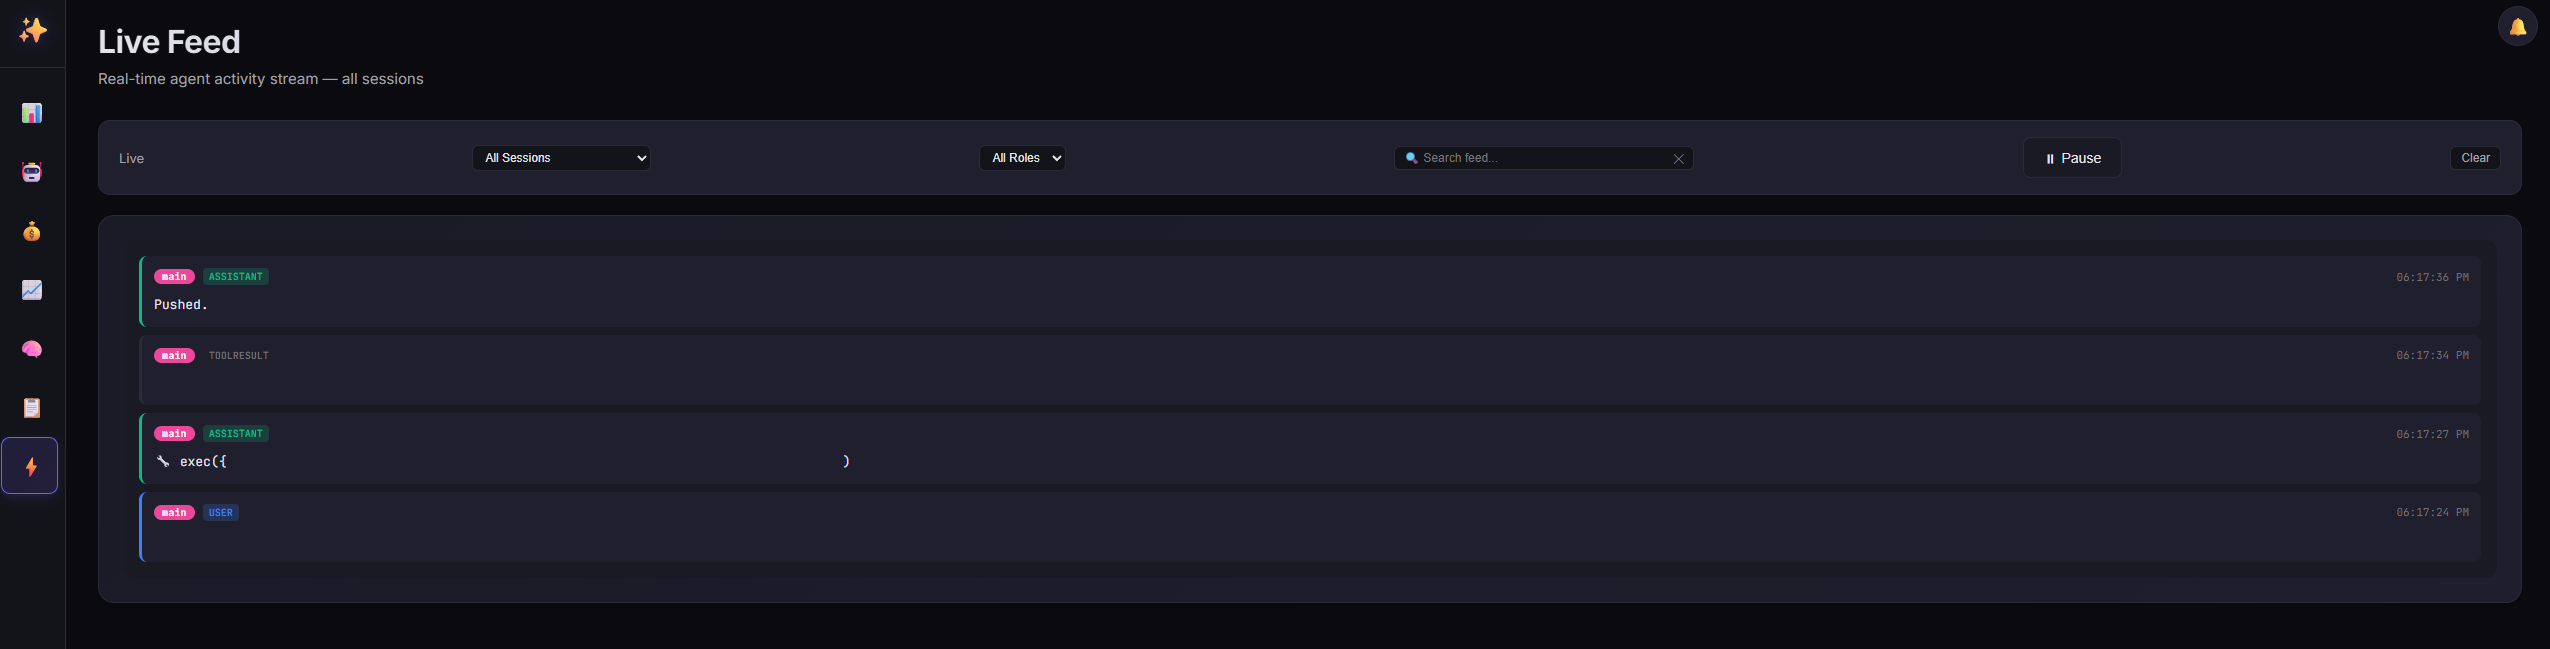
- ⚡ Live Feed - Real-time stream of agent messages across all sessions
- 🧠 Memory Viewer - Browse and read agent memory files (MEMORY.md, HEARTBEAT.md, daily notes)
- 📁 Files Manager - View and edit workspace files, skills, and configs with security hardening
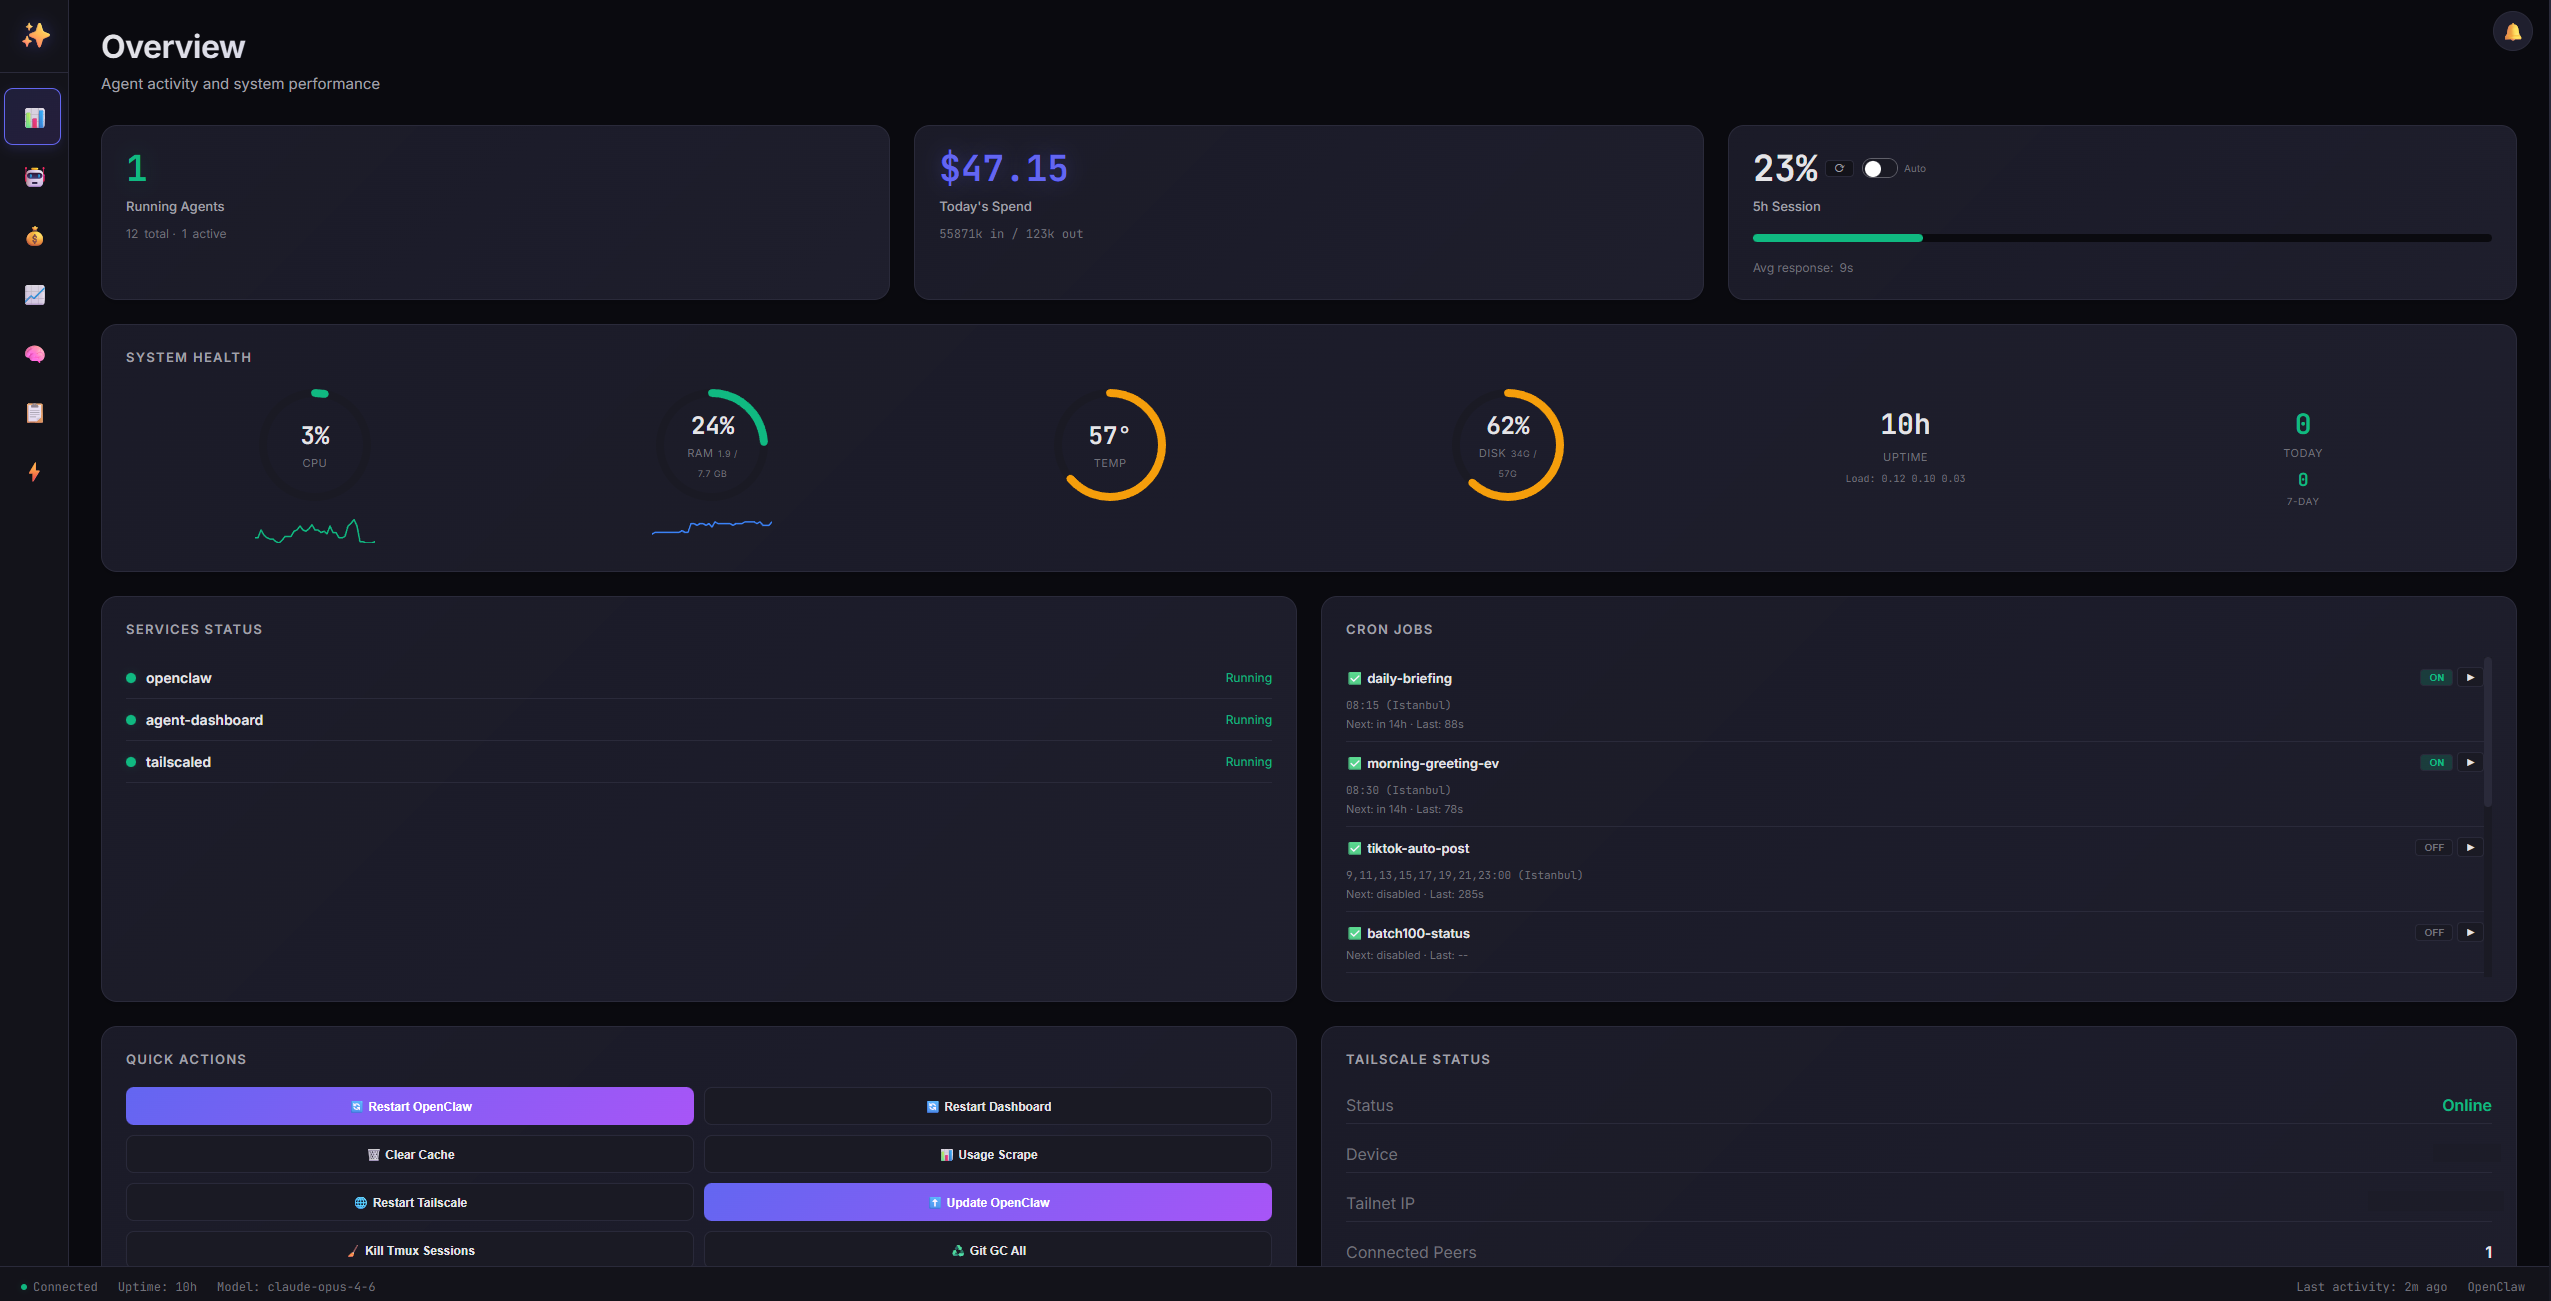
- 📈 System Health - CPU, RAM, disk, temperature monitoring with sparklines
- 🔄 Service Control - Quick actions to restart OpenClaw, dashboard, or other services
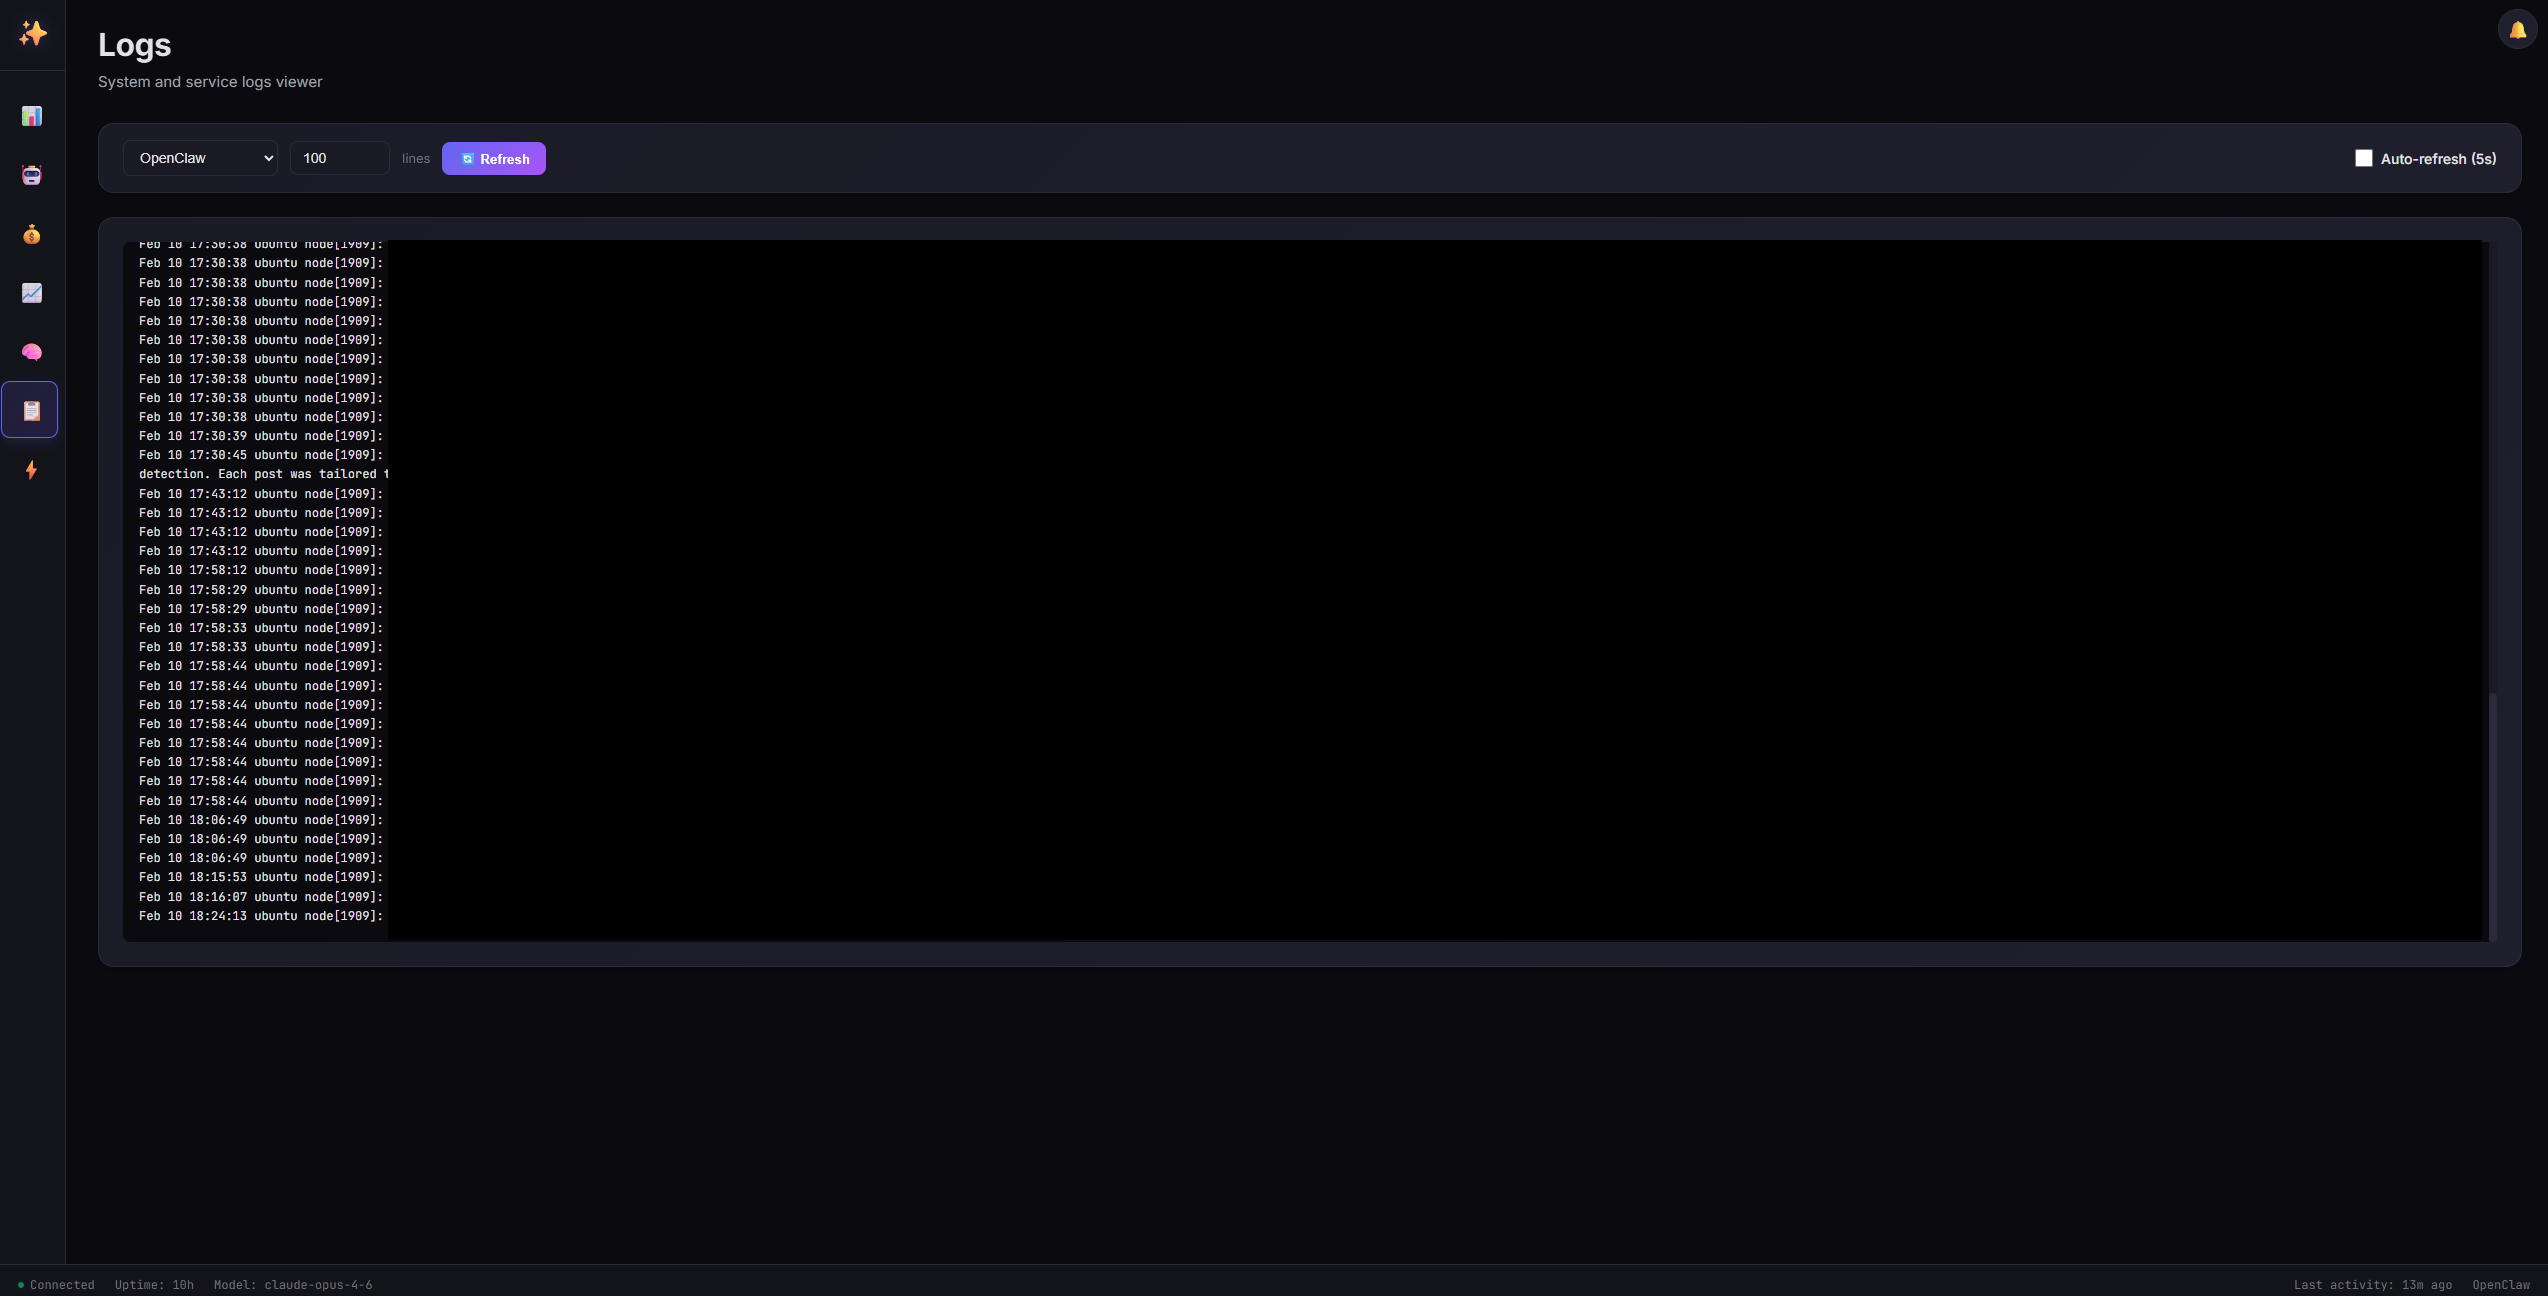
- 📋 Log Viewer - Real-time system logs with auto-refresh
- ⏰ Cron Management - View, enable/disable, and manually trigger cron jobs
- 🌐 Tailscale Integration - View Tailscale status, IP, and connected peers
- 🎯 Activity Heatmap - Visualize peak usage hours over the last 30 days
- 🔥 Streak Tracking - Monitor daily activity streaks
- 🔍 Session Search & Filtering - Filter by status, model, date range with live search
- 🎨 Dark/Light Theme - Toggle between dark and light modes with persistent preference
- ⌨️ Keyboard Shortcuts - Navigate quickly with hotkeys (1-7, Space, /, Esc, ?)
- 📱 Mobile Responsive - Works on phones and tablets
- 🔔 Browser Notifications - Get alerted when usage limits are approaching
- 📊 Timeline View - Visual timeline of session activity
- 💾 Git Activity - Track recent commits across your repos
- 🎛️ Claude Usage Scraper - Fetch real usage data from Claude Code CLI
- 🔷 Gemini Usage Tracking - Monitor Google Gemini model usage with per-model breakdowns
- 🔀 Provider Switching - Toggle between Claude and Gemini usage on the overview card
- 📊 Per-Model Selector - Choose which model/window to display (Opus, Sonnet, Pro, Flash, etc.)
- 🔄 Auto-Refresh - Live data updates every 5 seconds
- 🌟 Lifetime Stats - Total tokens, messages, cost since first session
- 📈 Health History - 24-hour CPU, RAM, temperature, and disk usage sparklines
- 🎯 Quick Actions - One-click system maintenance (updates, cleanup, restarts)
- 🍎 macOS Compatible - Full support for macOS system stats, services, and memory reporting
- 🛡️ System Security Dashboard - UFW rules, open ports, fail2ban, SSH logs, security audit (requires re-authentication)
- ⚙️ Config Editor - Edit OpenClaw configuration with JSON validation, auto-backup, and gateway restart (requires re-authentication)
- 🐳 Docker Management - View containers, images, system usage; start/stop/restart containers; prune unused resources
- 🔔 Notification Center - Audit log event feed with unread badge counter (login, config changes, security events)
- 🔐 Username/Password Auth - Secure registration with PBKDF2 password hashing
- 🔑 TOTP MFA - Optional two-factor authentication (Google Authenticator compatible)
- 💾 Remember Me - Session-only or 3-hour persistent login
- 🛡️ Security Hardened - HSTS, CSP, rate limiting, timing-safe comparisons, audit logging
- 📦 Minimal Dependencies - Pure Node.js, no database or npm packages required. Optional:
jq (Docker page), tmux + python3 (Claude CLI usage scraper), docker (Docker management)
🚀 Quick Start
# Clone the repository
git clone https://github.com/tugcantopaloglu/openclaw-dashboard.git
cd openclaw-dashboard

# Set your OpenClaw workspace path (optional, auto-detects if not set)
export WORKSPACE_DIR=/path/to/your/openclaw/workspace

# Start the dashboard
node server.js
Visit http://localhost:7000 in your browser. On first visit, you'll see a registration screen where you create your username and password. After registration, log in with your credentials.
📦 Installation
Prerequisites
- Node.js v18 or higher (check with
node --version)
- OpenClaw installed and running
- Systemd (optional, for service installation on Linux)
Optional dependencies
| Tool | Required for | Install |
|---|
jq | Docker management page | sudo apt install jq |
tmux | Claude CLI usage scraper | sudo apt install tmux |
python3 | Claude CLI usage parser | Usually pre-installed |
docker | Docker management page | docs.docker.com |
Manual Install
-
Clone the repository
git clone https://github.com/tugcantopaloglu/openclaw-dashboard.git
cd openclaw-dashboard
-
Configure environment (optional)
export DASHBOARD_PORT=7000
export WORKSPACE_DIR=/path/to/your/workspace
export OPENCLAW_DIR=$HOME/.openclaw
export OPENCLAW_AGENT=main
-
Start the server
node server.js
The server will print:
🚀 Dashboard running on http://localhost:7000
🔑 Recovery token: abc123def456...
Save the recovery token — you'll need it if you forget your password.
-
Access the dashboard
Open http://localhost:7000 and register your account.
Systemd Service (install.sh)
To run the dashboard as a system service with auto-start and crash recovery:
sudo ./install.sh
This will:
- Create
/etc/systemd/system/agent-dashboard.service
- Create override config at
/etc/systemd/system/agent-dashboard.service.d/override.conf
- Enable and start the service
- Set your workspace path and generate a recovery token
View logs:
journalctl -u agent-dashboard -f
Docker
# Build
docker build -t openclaw-dashboard .

# Run
docker run -d \
  --name openclaw-dashboard \
  -p 3001:3001 \
  -e WORKSPACE_DIR=/app/workspace \
  -e DASHBOARD_ALLOW_HTTP=true \
  -v ~/.openclaw:/home/node/.openclaw:ro \
  -v ~/.openclaw/workspace:/app/workspace \
  openclaw-dashboard
For Docker management page access, pass the Docker socket:
 tugcantopaloglu/openclaw-dashboard