 tg12/dns-honeypot
dns-honeypot

As an engineer who spends most of my days knee-deep in observability tooling, I get the occasional idea that I just have to run with. This was one of those experiments: spin up a DNS resolver on a clean IP that nobody advertises, then let the internet talk to it anyway. The only job of the resolver was to stay quiet, log everything, and feed Grafana with the resulting queries. One docker compose up -d later, I had Unbound, Loki, Prometheus, Grafana, and Traefik tracking live traffic and printing histograms of curiosity, misconfiguration, and the occasional scanner. This README is the report from that first day,what the stack captures, why it matters to me, and what it highlights about the current security landscape.
I intentionally introduced zero signal on my end,no packet drops, no tailored replies, no mitigation. Just Unbound with logging enabled, Loki tailing the log file, Prometheus scraping exporter metrics, Traefik fronting Grafana, and Docker Compose wiring them together. The resolver sat on 94.130.27.226, a refreshingly “clean” IPv4 I had found (check its status at https://www.abuseipdb.com/check/94.130.27.226 if you want a pre-noise baseline), and I let the world do its thing. A single laptop could watch every panel, fire up tools/dns_query_storm.sh when I wanted to stir the pot, and then let the noise settle back into whatever patterns the global internet chose to send.
You can peek at those dashboards live at https://dns.cybersafeintl.co.uk/public-dashboards/eb554b5b74e14f4d95e376c0033ee83d, although they sit on the lowest-end server in the stack, so expect slow refreshes during heavy queries.
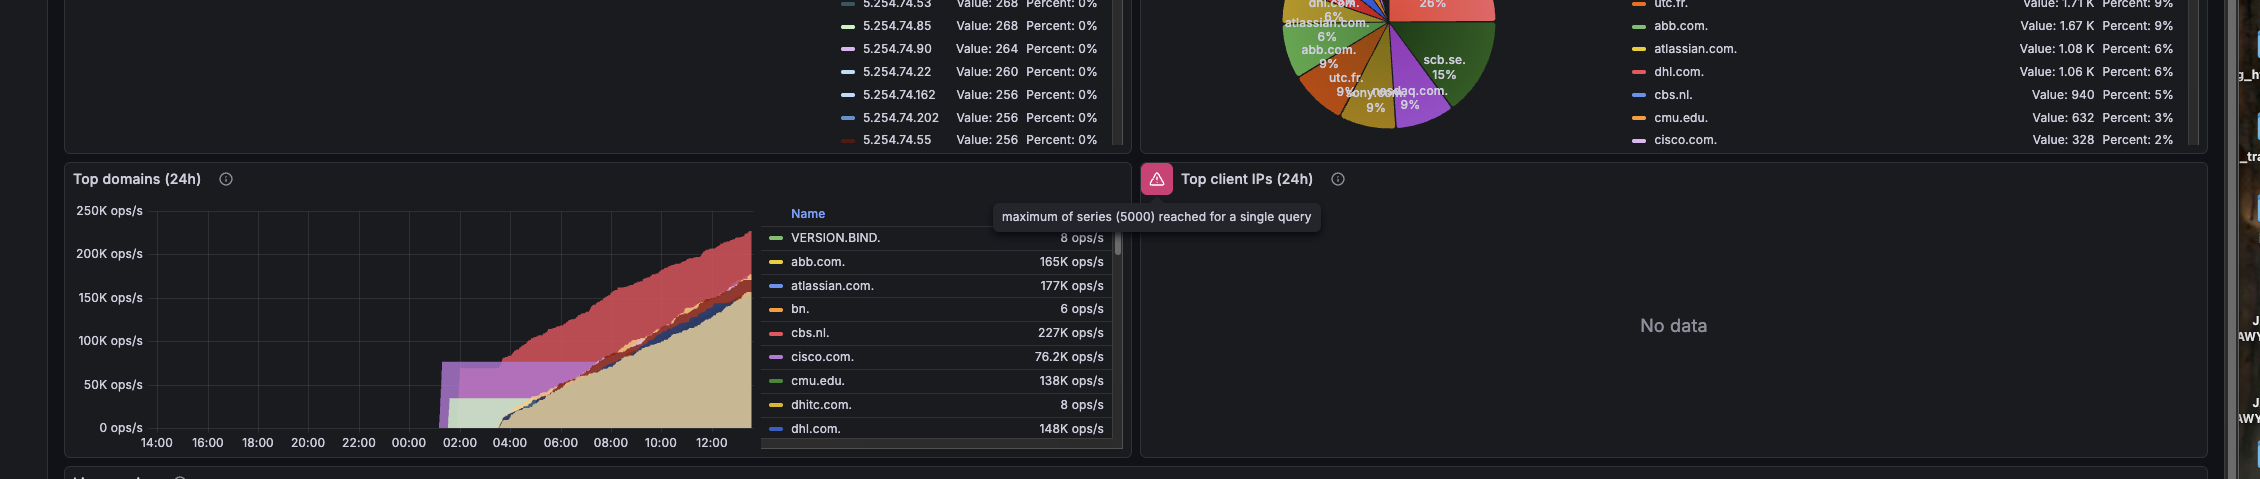
unbound_total_num_queries metric, so the “Throughput (QPS, 5m rate)” panel shows queries per second and breaks it down by source. That view answers the “who is hammering the resolver?” question,sudden spikes point directly to Bangladesh- or Poland-based ASNs, and the logs make it easy to see if SERVFAIL/NXDOMAIN storms accompany the bursts.client_ip, and dashboards already wrap everything in topk(sort_desc(...)). That keeps the panels clean while the exporter script lets me dump the same queries into CSVs for offline analysis, reporting, or reproducible stories. The first capture showed five IP addresses in the 45.179.* and 45.6.* ranges each firing 5k+ queries in five minutes,either a scanner farm or an aggressive client.qname popularity over 5m and 24h windows. The 5-minute snapshot featured scb.se, dhl.com, and cmu.edu, while the 24-hour export included cbs.nl, scb.se, atlassian.com, abb.com, and up.pt. Why these domains? That is the interesting part,are these legitimate services, misconfigured resolvers, or opportunistic scanners chasing stale records? Drop me a note if you have a theory.Every panel you see has a corresponding CSV in exports/; bundle them up (zip -r exports.zip exports/) when you want to attach the raw story to a blog post or incident report.
docker-compose.yml brings up Unbound, the Unbound exporter, Loki + Promtail, Prometheus, Grafana, and Traefik with a single command.unbound/ stores resolver configs and logs. TTL controls, serve-expired, and cache settings maintain fidelity so we capture what the clients actually ask for.prometheus/, loki/, and grafana/ directories hold data and provisioning files so metrics and dashboards survive restarts.grafana/dashboards/unbound-traffic-insights.json is pre-provisioned with the view you see; all PromQL/Loki queries already aggregate and sort to keep the panels readable.tools/dns_query_storm.sh lets you simulate query storms when you need to test reaction times.redeploy.sh automates taking the whole stack down, pulling updates, and rebuilding with a single script.export_dashboard_data.py now walks the dashboard JSON, hits each Prometheus/Loki query, and writes sanitized CSV files to an exports/ directory for sharing.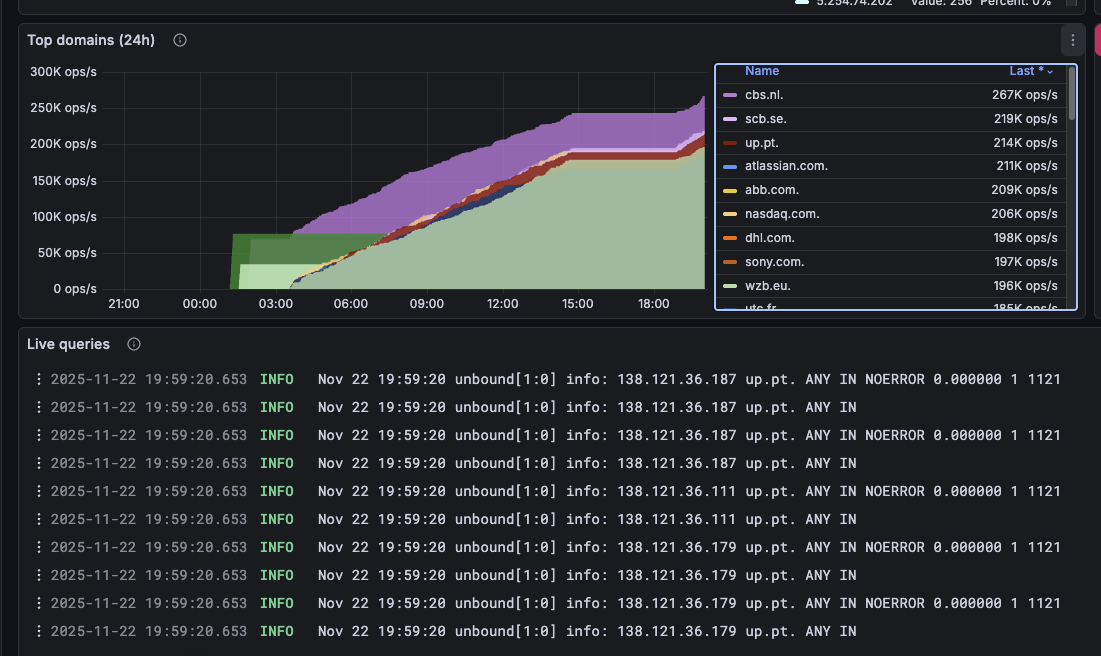
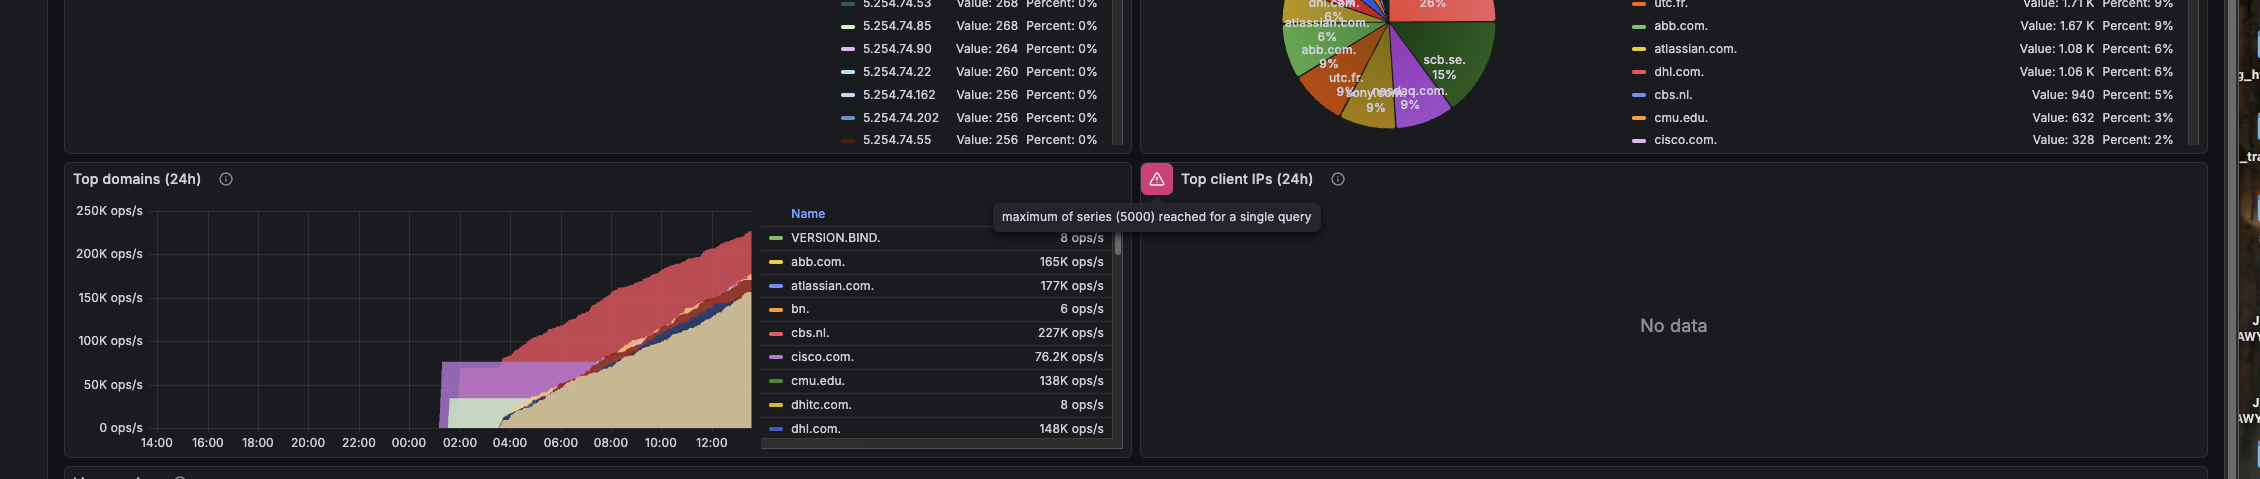
cd hetzner_deploy/unbound-dnscp .env.example .env and configure GRAFANA_DOMAIN, Grafana admin creds, LETSENCRYPT_EMAIL, and any TLS overrides you need.sudo chown -R 472:472 grafana-data && sudo mkdir -p prometheus/data && sudo chown -R 65534:65534 prometheus/datadocker compose build && docker compose up -dpip install requests (the exporter is pure Python).python export_dashboard_data.py --duration 24h --outdir exports/24h --timeout 90 to pull every dashboard query, convert it to CSV, and place the results under exports/24h.zip -r exports.zip exports/ to bundle the raw tables before you publish them, attach them to a blog post, or send them to collaborators.--duration 6h or --end timestamps for targeted slices, or use --filter domains if you only want the domain panels.scb.se, dhl.com, cmu.edu, up.pt, and utc.fr each generated hundreds of thousands of lookups. Why these targets? The constellation of European corporate domains makes me suspect a CDN, restore service, or scanner trying to rehydrate stale caches.cbs.nl, scb.se, atlassian.com, abb.com, and up.pt collectively generated more than 250 million queries. That level of volume isn’t random noise,either large-scale clients or a persistent appliance that never stops resolving.45.179.* and 45.6.* IPv4 addresses, each firing north of 5k queries in the observed five minutes. They might be part of an ISP or scanning farm, but whatever they are, the dashboards make tracking them trivial.What does this highlight? It illustrates how exposed DNS infrastructure can become a passive feed of interesting traffic even when it isn’t advertised. The internet keeps asking questions, and this setup simply listens carefully. If you’re curious how this experiment fits into my broader work, check the other repos,sometimes I run an idea like this and have to see where it leads.
exports/ folder or attach the CSVs directly wherever you tell the story.