
 stamparm/maltrail
Real-time malicious traffic detection system using public blacklists, static malware trails, and heuristic analysis to identify threats across DNS, HTTP, and IP traffic.
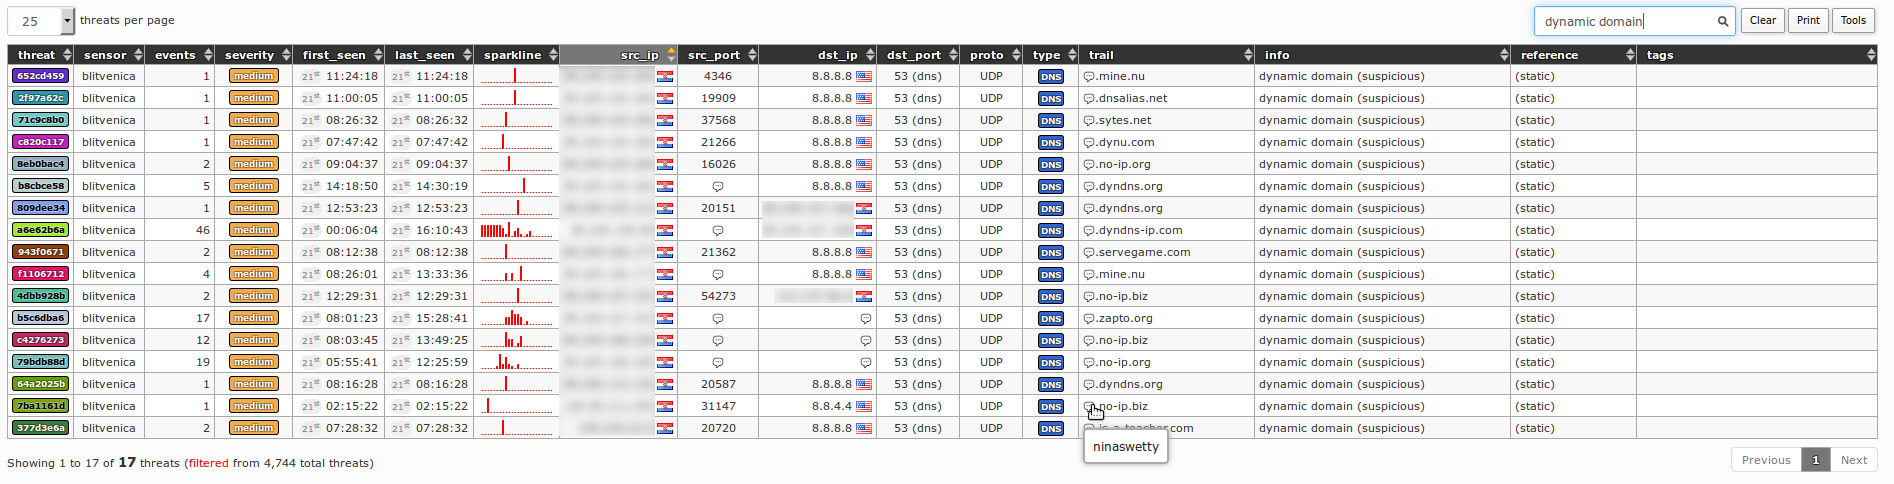
 [](#license) [](sensor/) [](server.py) [](#trails) [](https://x.com/maltrail) # Maltrail Maltrail is a network traffic detection system that identifies communication with known malicious infrastructure and reports selected traffic anomalies. It matches domains, URLs, IP addresses, `IP:port` pairs, and User-Agent values observed on the network against a set of indicators called _trails_. A detection is recorded as a single event containing the source, destination, protocol, matched trail, classification, and trail source: ```text "2026-08-07 09:14:22.117034" gw 10.13.13.2 57809 1.1.1.1 53 UDP DNS malware.bakewithdavid.com "asyncrat (malware)" (static) ``` Maltrail is designed for indicator-based network monitoring. Its heuristic detections supplement trail matching, but it is not a replacement for endpoint telemetry or a general-purpose intrusion prevention system. ## Features - A full trail build combining more than 3,000 bundled static files, 42 public-feed integrations, and optional operator-supplied trails. - A multithreaded Rust sensor using libpcap, with optional Linux `PACKET_FANOUT` capture workers. - A Python server providing the reporting interface, event intake, and HTTP API. - Plain-text custom trails and whitelists that can be reviewed and version-controlled. - Heuristics for scanning, DNS exhaustion, DGA-like lookups, suspicious downloads, proxy probes, suspicious User-Agent values, and related network activity. - Local event logging, remote Maltrail logging, CEF over syslog, and Logstash JSON output. - Deployment validation with `maltrail-sensor -T` and optional Prometheus metrics. ## Contents - [Architecture](#architecture) - [Reporting interface](#reporting-interface) - [Performance](#performance) - [Installation](#installation) - [Installer](#installer) - [Building from source](#building-from-source) - [Systemd](#systemd) - [Docker](#docker) - [Configuration](#configuration) - [Trails](#trails) - [Events and API](#events-and-api) - [Operations](#operations) - [Monitoring](#monitoring) - [Event retention](#event-retention) - [Documentation](#documentation) - [Contributing](#contributing) - [Project](#project) - [License](#license) - [Maintainers](#maintainers) - [Sponsors](#sponsors) - [Presentations and publications](#presentations-and-publications) - [Derived blacklist](#derived-blacklist) - [Third-party integrations](#third-party-integrations) - [Acknowledgements](#acknowledgements) ## Architecture Maltrail consists of two independent processes that may run on the same host or on separate hosts: ```text ┌──────────┐ events (UDP or file) ┌──────────┐ │ sensor │ ───────────────────────► │ server │ ◄── browser └──────────┘ └──────────┘ Rust Python libpcap + PACKET_FANOUT reporting UI + API trail matching + heuristics ``` The sensor captures traffic, performs trail matching and heuristic analysis, and produces events. It can write events locally (`LOG_DIR`), send them to a remote Maltrail server (`LOG_SERVER`), or do both. It can also emit CEF over syslog (`SYSLOG_SERVER`) and JSON to Logstash (`LOGSTASH_SERVER`). The server receives and stores remote events, serves locally available event logs, and provides the web interface and API. ## Reporting interface Maltrail includes a browser-based reporting interface for exploring detected traffic, with live updates, field-aware search, retro hunting, geographic views, triage, saved views and export.  The interface is served by `server.py` at `HTTP_ADDRESS:HTTP_PORT`. It is plain JavaScript with a single third-party runtime dependency (PapaParse, for CSV parsing) and no build step. One day is viewed at a time, selected with a date picker that doubles as an event-density grid over the available daily logs. Events are streamed from `/events` and aggregated in the browser into *threats* — one row per distinct `(source, trail)` — shown in a sortable grid with a detail panel. | Feature | Notes | | --- | --- | | Live mode | Appended events are pushed over Server-Sent Events (`/live`) and merged into the current view. Falls back to polling byte ranges of the daily log when SSE is unavailable, or for sessions the stream cannot serve. New high-severity threats can raise a desktop notification and an audible alert; both can be muted | | Search | Field-scoped tokens (`src:` `dst:` `port:` `proto:` `type:` `trail:` `info:` `family:` `tag:` `uid:` `sev:` `dir:` `status:`; `family:interlock` pulls in `interlock-1`/`-2`, the shards one feed dump arrives split into) combined with space as AND, `-` to exclude, `*` wildcards, CIDR (`src:10.0.0.0/8`), and numeric ranges and comparisons (`port:>1024`, `count:>=100`). Active filters appear as removable chips | | Retro hunt | Searches *all* retained daily logs for one indicator (`/hunt`), not just the day in view. Bounded by a day limit, a wall-clock budget and a sample cap; a day the budget cut short is reported separately from the completed days rather than counted as a finished total. A per-day sidecar index (`LOG_DIR/index/`, `USE_EVENT_INDEX`) lets the sweep skip every non-matching line and makes `/counts` exact | | World map | Per-country event density for the selected day (`/geo`), placing the external endpoint of each event. Events that cannot be attributed to an external address are reported as unmapped rather than guessed. Set `HOME_LAT` / `HOME_LON` to draw origin arcs | | Triage | Per-threat status (new / investigating / resolved / false positive), free-text notes, tags, and hiding. Whitelist rules and OSINT pivots are available from the row context menu | | Saved views | Named filter presets | | Export | The current filtered view as CSV, JSON, or defanged indicators | | Appearance | Dark and light themes, and discrete text-size steps | Triage state, saved views, tags and appearance settings are stored in the **browser** (`localStorage`), not on the server: they are per-browser and per-origin, and are not shared between analysts. Sessions restricted with a network filter see only events from their own networks, and that restriction applies to the counts, map and blacklist endpoints as well as to the event list. Country and ASN enrichment for individual addresses is looked up at `stat.ripe.net` by the **server**, which caches the results and serves them to the interface from its own `/ripe` endpoint; the browser talks to nothing but Maltrail. Set `DISABLE_RIPE_LOOKUPS` to switch the outbound lookups off entirely. Without them — or on a host with no internet access — flags come from the local RIR table instead and everything else in the interface works offline. ## Performance Performance depends on processor, traffic composition, trail-set size, capture driver, and network interface. The figures below measure the sensor's packet-processing path in isolation; they are not end-to-end live-capture measurements. Representative measurements on an AMD Ryzen 7 PRO 4750U with heuristics enabled and a 1.5 million-row trail set: | Traffic | Time per packet | | --- | ---: | | ICMP echo, 58 bytes | 101 ns | | TCP SYN, 70 bytes | 302 ns | | Bulk TLS, 1,473 bytes | 402 ns | | DNS query with a warm cache, 93 bytes | 452 ns | | Mixed traffic, 866-byte average | 552 ns | | HTTP request, 169 bytes | 602 ns | | DNS query with a unique name, 93 bytes | 1,102 ns | Offline comparison runs using the same generated capture, configuration, and trail set measured a 14–37× lower steady-state per-packet cost than the retired Python sensor across the tested systems. Those figures separate whole-process time from steady state, because trail loading dominates a short replay. Detection itself is asserted separately, by the 42-case corpus in `sensor/tests/replay.rs`. Measure it on the target system with: ```bash cargo bench --manifest-path sensor/Cargo.toml --bench hotpath ``` One capture worker is used by default. Additional workers can increase capture capacity, but Linux flow hashing divides per-source state between workers and therefore reduces the sensitivity of some scan heuristics. In the documented test, 91% of single-worker heuristic alerts remained with two workers, 86% with four, and 65% with eight. Exact trail matching was unchanged. Increase `CAPTURE_FANOUT` only when capture-drop metrics show that it is necessary. Benchmark methodology, hardware results, profiler output, memory measurements, and live fanout checks are documented in [`sensor/docs/REPORT.md`](https://github.com/stamparm/maltrail/blob/master/sensor/docs/REPORT.md). ## Installation ### Installer The installer is verified on twelve Linux distributions — Debian, Ubuntu, Fedora, Rocky, AlmaLinux, Arch, openSUSE Leap and Tumbleweed, and Alpine — plus FreeBSD and macOS, on every release, with the full result recorded in [`docs/compat`](https://github.com/stamparm/maltrail/blob/master/docs/compat). Raspberry Pi OS and other 64-bit ARM systems use the `aarch64` build; 32-bit ARM has no prebuilt sensor and must build it from source. ```bash curl -fsSL https://raw.githubusercontent.com/stamparm/maltrail/master/install.sh | sudo sh ``` It installs dependencies, creates a managed checkout under `/opt/maltrail`, verifies the checksum of the prebuilt sensor, creates an unprivileged `maltrail` account, installs systemd units, prepares the log and state directories, and starts the sensor and server. Re-running the installer upgrades the managed checkout. Review the script before running it with elevated privileges. From an existing checkout, the dry run shows the commands without changing the system: ```bash sh install.sh --dry-run ``` Common installer options: ```bash sh install.sh --role sensor # Install only the sensor sh install.sh --ref 3.1.2 # Install a release tag instead of master sh install.sh --no-service # Install without changing systemd sh install.sh --dry-run # Print commands without applying them sh install.sh --uninstall # Remove the managed installation; keep logs and state ``` The dashboard is available at <http://127.0.0.1:8338> after installation. Note that the shipped `HTTP_ADDRESS` is `0.0.0.0`, so it is reachable on **every** interface, not only loopback — and the default credentials are `admin` / `changeme!`. Change `USERS`, and set `HTTP_ADDRESS` to `127.0.0.1` (or put the server behind a reverse proxy with TLS), before the host is on an untrusted network. The initial trail build can take several minutes. The sensor does not detect trail matches until a valid trail set is available. The systemd unit runs the sensor's `-T` validation before startup so that missing privileges, an unwritable log directory, or an invalid trail set causes startup to fail visibly. The installer test harness covers twelve distributions, and "it installed" is not the assertion: in each one the server is started and asked for `/ping`, the sensor is asked to validate itself with `-T`, the units are checked for paths that resolve, the installer is re-run to prove an upgrade keeps operator configuration, and `--uninstall` is run. Every result is recorded per platform in [`docs/compat`](https://github.com/stamparm/maltrail/blob/master/docs/compat), and the page there is generated from those rows rather than written by hand. Alpine and other musl systems get a `-musl` sensor build. They used to be told the prebuilt binary was glibc-linked and to compile their own; the sensor builds and runs on musl natively, so that was a missing artefact rather than a platform limit. ### Building from source The sensor requires Rust 1.74 or newer, libpcap development headers, and the system's capability tools. The server and trail updater require Python 3.6 or newer. Install the distribution packages: ```bash # Debian / Ubuntu / Raspberry Pi OS sudo apt-get install cargo libpcap-dev libcap2-bin python3 # RHEL / Fedora sudo dnf install cargo libpcap-devel libcap python3 # openSUSE / SLES sudo zypper install cargo rust libpcap-devel libcap-progs python311 ``` Then build and validate the sensor: ```bash git clone --depth 1 https://github.com/stamparm/maltrail.git cd maltrail cargo build --release --manifest-path sensor/Cargo.toml sudo setcap cap_net_raw,cap_net_admin=eip \ sensor/target/release/maltrail-sensor sudo install -d -o "$USER" -g "$(id -gn)" -m 750 /var/log/maltrail sensor/target/release/maltrail-sensor -T sensor/target/release/maltrail-sensor ``` Start the server in another terminal or on another host: ```bash python3 server.py ``` Prebuilt sensor binaries are attached to current releases with SHA-256 checksums: Linux `x86_64` and `aarch64` against both glibc and musl, macOS on Apple silicon and Intel, FreeBSD `amd64`, and Windows `x86_64`. The glibc builds link libpcap statically and target glibc 2.28, so the C library is the only thing they need — nothing to install, on RHEL 8+, Debian 10+, Ubuntu 18.04+ and Leap 15.x alike. The musl builds are fully static, so Alpine needs nothing at all. The Windows build is 64-bit and needs Windows 10 or later plus [Npcap](https://npcap.com) installed before it will start — `wpcap.dll` is a load-time dependency, so without it the loader refuses the executable rather than failing at capture. The archive says so too. Binaries from **3.1.1 and earlier** did not: they linked libpcap dynamically, and asked for it by the name their AlmaLinux build host uses. Debian and Ubuntu ship the identical library under the older name `libpcap.so.0.8`, so those binaries stop before they start — ``` ./maltrail-sensor: error while loading shared libraries: libpcap.so.1: cannot open shared object file ``` — on a machine that has libpcap installed. `install.sh` links the missing name for you. By hand: ```bash # adjust the directory for your architecture: aarch64-linux-gnu, or /usr/lib64 on RPM distributions sudo ln -sf /usr/lib/x86_64-linux-gnu/libpcap.so.0.8 /usr/lib/x86_64-linux-gnu/libpcap.so.1 sudo ldconfig ``` ### Systemd The supplied `packaging/systemd/` units run both processes as the unprivileged `maltrail` user. Systemd creates `/var/log/maltrail` and `/var/lib/maltrail`, restricts filesystem access, and grants the sensor `CAP_NET_RAW` and `CAP_NET_ADMIN`. The installer configures these units automatically. For an existing source installation, follow the manual service procedure in [`sensor/docs/INSTALL.md`](https://github.com/stamparm/maltrail/blob/master/sensor/docs/INSTALL.md). Check service state and logs with: ```bash systemctl status maltrail-sensor maltrail-server journalctl -u maltrail-sensor -f ``` ### Docker Start the supplied Compose deployment with: ```bash docker compose -f docker/docker-compose.yml up -d ``` Container configuration, storage, privileges, and health checks are documented in [`docker/README.md`](https://github.com/stamparm/maltrail/blob/master/docker/README.md). ## Configuration Maltrail reads `maltrail.conf`, which contains separate `[Sensor]` and `[Server]` settings. The installer places the managed configuration at `/etc/maltrail.conf`. Frequently used sensor options include: | Option | Purpose | | --- | --- | | `MONITOR_INTERFACE` | Capture interface or interfaces; `any` selects all supported interfaces | | `CAPTURE_FILTER` | BPF capture filter | | `CAPTURE_FANOUT` | Number of Linux capture sockets; defaults to one | | `CAPTURE_WORKERS` | Capture workers, one socket each; defaults to `CAPTURE_FANOUT`, so one unless either is set | | `LOG_DIR` | Local event-log directory | | `TRAILS_FILE` | Generated trail database | | `LOG_SERVER` | Remote Maltrail event server | | `SYSLOG_SERVER` | CEF syslog destination or destinations | | `LOGSTASH_SERVER` | Logstash JSON destination or destinations | | `STATS_ADDRESS` | Prometheus metrics listener; disabled unless configured | | `UPDATE_PERIOD` | Trail refresh interval | | `STATIC_TRAILS_URL` | Where the assembled static trail set is fetched from; pin it to a dated release to control when new content lands | | `USER_WHITELIST` | Operator-managed indicators that should not alert | | `CUSTOM_TRAILS_DIR` | Operator-managed trail directory | | `STATIC_TRAILS_DIR` | Optional checkout of the trails repository; only used to show a trail's source citation in the UI | `PROCESS_COUNT` applies to the retired Python sensor and to the legacy event-log throttle; it does **not** set the Rust sensor's worker count. Configure capture workers with `CAPTURE_FANOUT` or `CAPTURE_WORKERS` instead. Run the deployment check after changing configuration: ```bash sensor/target/release/maltrail-sensor -T ``` The check validates configuration, trails, whitelist entries, capture filter, privileges, log storage, update support, and worker settings. A successful check includes positive trail and whitelist counts rather than only confirming that files exist. ## Trails A trail is one indicator — a domain, URL, IP address, `IP:port` pair, User-Agent, JA3/JA4 fingerprint or certificate hash — together with what it means and where it came from. The updater merges four sources into `TRAILS_FILE`, in this order: | source | where it comes from | | --- | --- | | Feeds | `feeds/*.py`, fetched directly by your deployment from each publisher | | Custom | `CUSTOM_TRAILS_DIR` and `CUSTOM_TRAILS_URL`, your own indicators | | Static | the assembled set from [stamparm/trails](https://github.com/stamparm/trails), fetched from `STATIC_TRAILS_URL`; [separately licensed](https://github.com/stamparm/trails/blob/main/LICENSE.md) | | Engine lists | `data/mass_scanner*.txt`, shipped here because they change rarely | The static trails live in their own repository. Detection content changes tens of times a day; the engine does not, and keeping them together meant updating detection required pulling code and made this repository's history unusable. `STATIC_TRAILS_URL` points at the newest published set: ```text STATIC_TRAILS_URL https://github.com/stamparm/trails/releases/latest/download/trails.csv.gz ``` Point it at a specific `content-YYYYMMDD-HHMM` release instead to pin a version, so a bad publish is not immediately global. The set is cached next to `TRAILS_FILE`, which is what makes an offline or air-gapped rebuild work; the published `sha256` is checked before downloading, so a deployment that updates more often than the content changes transfers 65 bytes rather than 11 MB, and a payload that does not match its digest is refused in favour of the cache. `update_trails()` publishes a new `TRAILS_FILE` atomically and only after a successful build. Feeds that return nothing are reported by name, so a deployment does not silently depend on a source that has quietly retired. Add your own indicators under `CUSTOM_TRAILS_DIR`, and anything that must never raise an event to `USER_WHITELIST`. Keep both outside the installation directory so an upgrade cannot overwrite them. Static trail contributions go to [stamparm/trails](https://github.com/stamparm/trails); new feeds go here. Either way an indicator needs a classification and a source somebody can check — see [Contributing](#contributing). ## Events and API Maltrail records one whitespace-separated event per detection, using CSV quoting where a value contains spaces: ```text "<time>" <sensor> <src_ip> <src_port> <dst_ip> <dst_port> <proto> <type> <trail> "<info>" <reference> ``` The `type` field identifies what matched, including `DNS`, `IP`, `IPORT`, `URL`, `PATH`, `HTTP`, `UA`, `PORT`, `CERT`, `JA3`, and `JA4`. The `info` field contains the trail classification, and `reference` identifies the static list, feed, custom source, or heuristic that produced it. The `JA3`/`JA4` types fire on TLS *client* fingerprints: an implant's TLS stack survives every address and domain rotation, so its hello hash keeps matching after everything else has burned (published by the abuse.ch SSLBL JA3 feed). ### Indicator lookup Use `/check` to query one domain, IP address, or URL: ```bash curl 'http://127.0.0.1:8338/check?q=www.sub.evil.example' ``` ```json { "query": "www.sub.evil.example", "found": true, "trail": "evil.example", "info": "asyncrat (malware)", "reference": "(static)", "confidence": 100 } ``` The `confidence` field (0-100, or `null` when unavailable) says how strongly the sources back the listing: 40 for a single feed, +15 per additional feed agreeing independently up to 100, and full marks for the operator's own custom and static entries. It is computed at trail-update time from feed agreement into a `trails.confidence` sidecar next to `trails.csv`; a server pulling trails from an `UPDATE_SERVER` has no provenance to score and reports `null`. Use it to prioritize triage - a single-feed listing at 40 deserves a second look before it earns a firewall rule. A subdomain lookup can match its listed parent. URL lookups check `host/path` before checking the host alone. The server reads the memory-mapped trail database and observes trail updates without a restart. Public static and feed trails are available without authentication, consistent with the `/trails` endpoint used by remote sensors. Custom trails require an authorized session; an unauthorized custom-only lookup is reported as a miss. Event data remains authenticated. ## Operations ### Monitoring Use `maltrail-sensor -T` as a deployment and configuration gate. The supplied systemd unit runs it as `ExecStartPre`. To confirm that detection itself works — not just that the processes start — run: ```bash python3 server.py --detect-test ``` It replays a crafted pcap of emulated malicious traffic (trail hits on a DNS query, an IP, an `IP:port`, a URL path and a `Host` header, plus the SQL-injection, traversal, RCE, XSS, proxy-probe, sinkhole, missing-`Host` and port/web/infection-scanning heuristics) through the installed sensor and asserts that every expected detection fires. It needs no root, no interface and no trail set of its own. A healthy install prints `20/20 detection(s) fired`. When `STATS_ADDRESS` is configured, monitor at least these Prometheus metrics: | Metric | Operational meaning | | --- | --- | | `maltrail_up == 0` | No capture worker is running | | Increasing `maltrail_capture_dropped_total` | The capture ring is dropping packets | | Increasing `maltrail_local_log_errors_total` | Events were produced but could not be written locally | | Increasing `maltrail_remote_log_errors_total` | Events could not be delivered to a remote sink; with `DISABLE_LOCAL_LOG_STORAGE` they are lost | | `maltrail_trail_generation` not advancing | The active trail set is not being refreshed | | `maltrail_log_dir_free_bytes` | Remaining capacity for local event storage | | Increasing `maltrail_state_saturations_total` | A heuristic state limit was reached | | Increasing `maltrail_throttle_evictions_total` | The event-throttle table is at its cap, so events are aggregated earlier than configured | State saturation affects the corresponding heuristic; exact trail matching remains active. Send `SIGHUP` or use `systemctl reload maltrail-sensor` to request a trail reload. Trail files updated by another process are detected automatically and published to workers without restarting the sensor. The condensed observable store (`USE_CONDENSED_STORAGE`, `meta.sqlite`) supports the server's novelty and retro-hunt views. The per-day event-log sidecar index (`USE_EVENT_INDEX`, `LOG_DIR/index/*.sqlite`, roughly twice the log size on disk) is what makes `/counts` exact and `/hunt` fast; it is maintained incrementally from the logs themselves and can be rebuilt with `server.py --rebuild-index`. Compatibility with the retired sensor is documented in [`sensor/docs/COMPATIBILITY.md`](https://github.com/stamparm/maltrail/blob/master/sensor/docs/COMPATIBILITY.md). ### Event retention Maltrail does not rotate or delete event logs. Operators are responsible for defining retention, archival, and deletion according to storage requirements and organizational policy. Recommended practices: - Send the durable event copy to a remote Maltrail server or SIEM with `LOG_SERVER`, `SYSLOG_SERVER`, or `LOGSTASH_SERVER`. - Alert on `maltrail_log_dir_free_bytes` with enough headroom for the expected event rate. - Rotate, archive, or remove local daily logs using external tooling. - Keep files needed by the reporting interface uncompressed in `LOG_DIR`; archive compressed files elsewhere. When the log filesystem is full, the sensor cannot append events. Event logs may also contain IP addresses and domains that are regulated as personal data in some jurisdictions; retention policy should account for the applicable requirements. ### Synthetic traffic To check that detection and the dashboard both still work, without waiting for real traffic: ```bash python3 server.py --detect-test # assert every detection fires, then exit python3 server.py --detect-test --keep DIR --serve # ...and keep the events, serving them on :8338 ``` `--keep` also replays `sensor/tests/corpus/` into the same log and prints which of the shapes the dashboard renders differently have an event behind them, so a missing icon, colour or glyph is visible rather than assumed. Timestamps are shifted so the newest day is today. A sensor binary is required (`cargo build --release --manifest-path sensor/Cargo.toml`). The public demo's data is regenerated from such a run: ```bash python3 sensor/tools/gen_demo_js.py --from DIR/logs # tops up html/js/demo.js ``` ## Documentation | Document | Contents | | --- | --- | | [`sensor/docs/INSTALL.md`](https://github.com/stamparm/maltrail/blob/master/sensor/docs/INSTALL.md) | Installation, privileges, configuration, and troubleshooting | | [`sensor/docs/ARCHITECTURE.md`](https://github.com/stamparm/maltrail/blob/master/sensor/docs/ARCHITECTURE.md) | Sensor internals and data flow | | [`sensor/docs/COMPATIBILITY.md`](https://github.com/stamparm/maltrail/blob/master/sensor/docs/COMPATIBILITY.md) | Deliberate differences from the retired Python sensor | | [`sensor/docs/REPORT.md`](https://github.com/stamparm/maltrail/blob/master/sensor/docs/REPORT.md) | Measurements, profiles, and test results | | [`sensor/docs/ROADMAP.md`](https://github.com/stamparm/maltrail/blob/master/sensor/docs/ROADMAP.md) | Open sensor work | | [`SekuriPy Labs`](https://www.sekuripy.hr/labs/maltrail/) | Engineering notes, benchmarks and write-ups | ## Contributing Trail additions, feed maintenance, bug reports, documentation, and sensor improvements are welcome. Trail submissions should include a reliable source and should use the narrowest appropriate classification. Run the relevant checks before submitting code. The complete sensor gate is: ```bash bash sensor/tools/check.sh ``` It runs formatting, Clippy with warnings denied, and the debug and release test suites. Run the Python server suite with: ```bash bash tests/run.sh python3 ``` The Windows build can be exercised from Linux, which is where its bugs have been found: ```bash sh sensor/tools/check_windows.sh ``` It cross-compiles the sensor with mingw-w64, extracts Npcap's userspace library from its installer (an NSIS archive, so nothing is installed), and runs the result under Wine — the whole unit suite, `-T` against the shipped configuration, the pcap corpus compared byte for byte against the native binary, and the server answering `/ping` under a Windows Python. Live capture is the one thing it cannot cover; that needs Npcap's kernel driver and a real Windows machine. Prerequisites are `gcc-mingw-w64-x86-64`, `wine`, and `p7zip-full`. ## Project ### License **TL;DR:** Maltrail is MIT-licensed, but the Maltrail Trails dataset has separate terms. Independent IOC lookup/reference is fine; systematic use of Trails as an intelligence source in a commercial product or service requires permission/licensing. Maltrail is distributed under the MIT License. See [`LICENSE`](https://github.com/stamparm/maltrail/blob/master/LICENSE). That is the engine. The static trail set is separate work under separate terms: free for internal defensive use, research and teaching, but a commercial product, service, MSSP or MDR offering, or a redistributed feed needs a licence. An MIT engine does not make the content free to sell — see [`LICENSE.md`](https://github.com/stamparm/trails/blob/main/LICENSE.md) in [stamparm/trails](https://github.com/stamparm/trails) before shipping it in something you charge for. ### Maintainers - Miroslav Stampar ([@stamparm](https://github.com/stamparm)) - Mikhail Kasimov ([@MikhailKasimov](https://github.com/MikhailKasimov)) ### Sponsors - [Sansec](https://sansec.io/) (2024–2025) - [Sansec](https://sansec.io/) (2020–2021) ### Presentations and publications - 47th TF-CSIRT Meeting, Prague, 2016 ([slides](https://web.archive.org/web/20161109135211/https://www.terena.org/activities/tf-csirt/meeting47/M.Stampar-Maltrail.pdf)) - _Detect attacks on your network with Maltrail_, Linux Magazine, 2022 ([article](https://www.linux-magazine.com/Issues/2022/258/Maltrail)) - _Best Cyber Threat Intelligence Feeds_, Silent Push, 2022 ([review](https://www.silentpush.com/blog/best-cyber-threat-intelligence-feeds)) - _Research on Network Malicious Traffic Detection System Based on Maltrail_, Nanotechnology Perceptions, 2024 ([paper](https://nano-ntp.com/index.php/nano/article/view/1915/1497)) ### Third-party integrations - [FreeBSD Port](https://www.freshports.org/security/maltrail) - [OPNsense Gateway Plugin](https://github.com/opnsense/plugins/pull/1257) - [D4 Project](https://www.d4-project.org/2019/09/25/maltrail-integration.html) - [BlackArch Linux](https://github.com/BlackArch/blackarch/blob/master/packages/maltrail/PKGBUILD) - [Validin](https://x.com/ValidinLLC/status/1719666086390517762) - [Maltrail Add-on for Splunk](https://splunkbase.splunk.com/app/7211) - [Maltrail decoder and rules for Wazuh](https://github.com/MikhailKasimov/maltrail-wazuh-decoder-and-rules) - [GScan](https://github.com/grayddq/GScan) (trails only) - [MalwareWorld](https://www.malwareworld.com/) (trails only) - [oisd domain blocklist](https://oisd.nl/?p=inc) (trails only) - [NextDNS](https://github.com/nextdns/metadata/blob/e0c9c7e908f5d10823b517ad230df214a7251b13/security/threat-intelligence-feeds.json) (trails only) - [NoTracking](https://github.com/notracking/hosts-blocklists/blob/master/SOURCES.md) (trails only) - [OWASP Mobile Audit](https://github.com/mpast/mobileAudit#environment-variables) (trails only) - [Mobile Security Framework MobSF](https://github.com/MobSF/Mobile-Security-Framework-MobSF/commit/12b07370674238fa4281fc7989b34decc2e08876) (trails only) - [pfBlockerNG-devel](https://github.com/pfsense/FreeBSD-ports/blob/devel/net/pfSense-pkg-pfBlockerNG-devel/files/usr/local/www/pfblockerng/pfblockerng_feeds.json) (trails only) - [Sansec eComscan](https://sansec.io/kb/about-ecomscan/ecomscan-license) (trails only) - [Palo Alto Networks Cortex XSOAR](https://xsoar.pan.dev/docs/reference/integrations/github-maltrail-feed) (trail connector) ### Acknowledgements - Thomas Kristner - Eduardo Arcusa Les - James Lay - Ladislav Baco (@laciKE) - John Kristoff (@jtkdpu) - Michael Münz (@mimugmail) - David Brush - @Godwottery - Chris Wild (@briskets) - Keith Irwin (@ki9us) - Simon Szustkowski (@simonszu)
