
 stamparm/maltrail
Real-time malicious traffic detection system using public blacklists, static malware trails, and heuristic analysis to identify threats across DNS, HTTP, and IP traffic.






Maltrail is a network traffic detection system that identifies communication with known malicious
infrastructure and reports selected traffic anomalies. It matches domains, URLs, IP addresses,
IP:port pairs, and User-Agent values observed on the network against a set of indicators called
trails.
A detection is recorded as a single event containing the source, destination, protocol, matched trail, classification, and trail source:
"2026-08-07 09:14:22.117034" gw 10.13.13.2 57809 1.1.1.1 53 UDP DNS malware.bakewithdavid.com "asyncrat (malware)" (static)
Maltrail is designed for indicator-based network monitoring. Its heuristic detections supplement trail matching, but it is not a replacement for endpoint telemetry or a general-purpose intrusion prevention system.
PACKET_FANOUT capture workers.maltrail-sensor -T and optional Prometheus metrics.Maltrail consists of two independent processes that may run on the same host or on separate hosts:
   ┌──────────┐   events (UDP or file)   ┌──────────┐
   │  sensor  │ ───────────────────────► │  server  │ ◄── browser
   └──────────┘                          └──────────┘
    Rust                                  Python
    libpcap + PACKET_FANOUT               reporting UI + API
    trail matching + heuristics
The sensor captures traffic, performs trail matching and heuristic analysis, and produces events.
It can write events locally (LOG_DIR), send them to a remote Maltrail server (LOG_SERVER), or do
both. It can also emit CEF over syslog (SYSLOG_SERVER) and JSON to Logstash
(LOGSTASH_SERVER).
The server receives and stores remote events, serves locally available event logs, and provides the web interface and API.
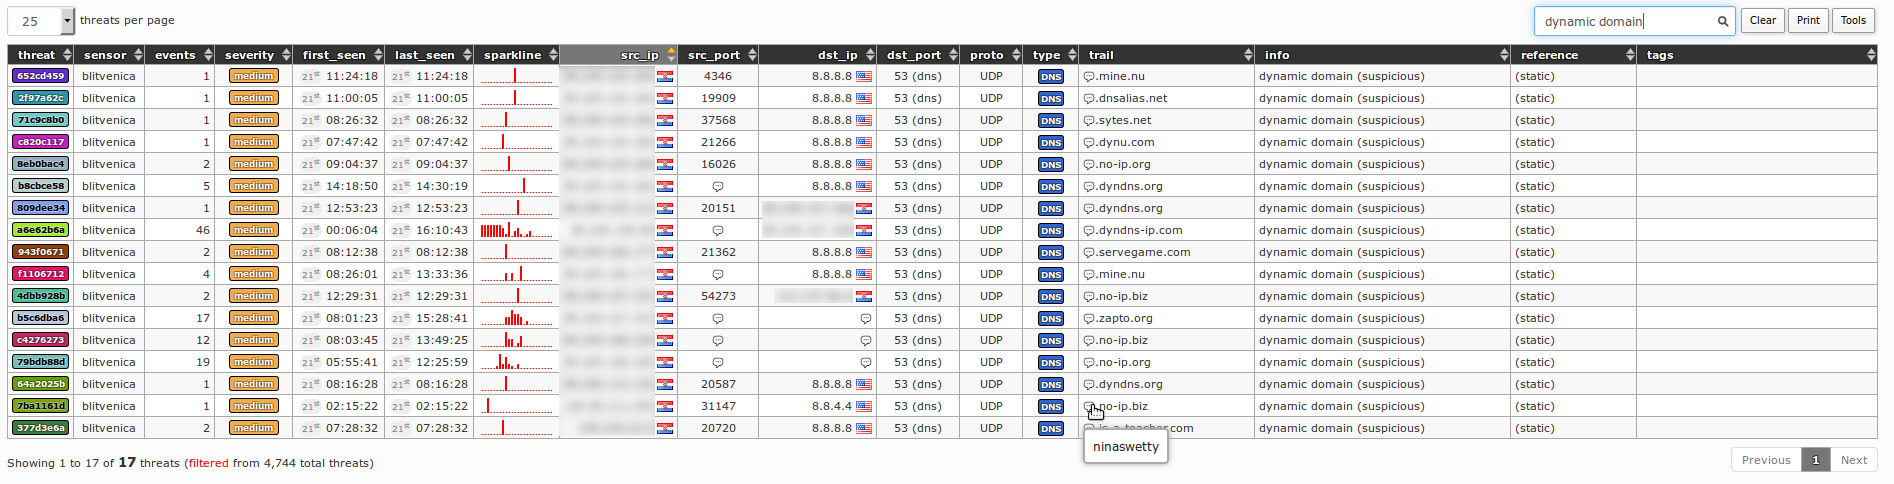
Maltrail includes a browser-based reporting interface for exploring detected traffic, with live updates, field-aware search, retro hunting, geographic views, triage, saved views and export.

The interface is served by server.py at HTTP_ADDRESS:HTTP_PORT. It is plain JavaScript with a
single third-party runtime dependency (PapaParse, for CSV parsing) and no build step. One day is
viewed at a time, selected with a date picker that doubles as an event-density grid over the
available daily logs. Events are streamed from /events and aggregated in the browser into
threats — one row per distinct (source, trail) — shown in a sortable grid with a detail panel.
| Feature | Notes |
|---|---|
| Live mode | Appended events are pushed over Server-Sent Events (/live) and merged into the current view. Falls back to polling byte ranges of the daily log when SSE is unavailable, or for sessions the stream cannot serve. New high-severity threats can raise a desktop notification and an audible alert; both can be muted |
| Search | Field-scoped tokens (src: dst: port: proto: type: trail: info: family: tag: uid: sev: dir: status:; family:interlock pulls in interlock-1/-2, the shards one feed dump arrives split into) combined with space as AND, - to exclude, * wildcards, CIDR (src:10.0.0.0/8), and numeric ranges and comparisons (port:>1024, count:>=100). Active filters appear as removable chips |
| Retro hunt | Searches all retained daily logs for one indicator (/hunt), not just the day in view. Bounded by a day limit, a wall-clock budget and a sample cap; a day the budget cut short is reported separately from the completed days rather than counted as a finished total. A per-day sidecar index (LOG_DIR/index/, USE_EVENT_INDEX) lets the sweep skip every non-matching line and makes /counts exact |
| World map | Per-country event density for the selected day (/geo), placing the external endpoint of each event. Events that cannot be attributed to an external address are reported as unmapped rather than guessed. Set HOME_LAT / HOME_LON to draw origin arcs |
| Triage | Per-threat status (new / investigating / resolved / false positive), free-text notes, tags, and hiding. Whitelist rules and OSINT pivots are available from the row context menu |
| Saved views | Named filter presets |
| Export | The current filtered view as CSV, JSON, or defanged indicators |
| Appearance | Dark and light themes, and discrete text-size steps |
Triage state, saved views, tags and appearance settings are stored in the browser
(localStorage), not on the server: they are per-browser and per-origin, and are not shared
between analysts.
Sessions restricted with a network filter see only events from their own networks, and that restriction applies to the counts, map and blacklist endpoints as well as to the event list.
Country and ASN enrichment for individual addresses is looked up at stat.ripe.net by the
server, which caches the results and serves them to the interface from its own /ripe
endpoint; the browser talks to nothing but Maltrail. Set DISABLE_RIPE_LOOKUPS to switch the
outbound lookups off entirely. Without them — or on a host with no internet access — flags come
from the local RIR table instead and everything else in the interface works offline.
Performance depends on processor, traffic composition, trail-set size, capture driver, and network interface. The figures below measure the sensor's packet-processing path in isolation; they are not end-to-end live-capture measurements.
Representative measurements on an AMD Ryzen 7 PRO 4750U with heuristics enabled and a 1.5 million-row trail set:
| Traffic | Time per packet |
|---|---|
| ICMP echo, 58 bytes | 101 ns |
| TCP SYN, 70 bytes | 302 ns |
| Bulk TLS, 1,473 bytes | 402 ns |
| DNS query with a warm cache, 93 bytes | 452 ns |
| Mixed traffic, 866-byte average | 552 ns |
| HTTP request, 169 bytes | 602 ns |
| DNS query with a unique name, 93 bytes | 1,102 ns |
