Skip to content
KitploitKITPLOIT
ToolsBlog
Submit
ToolsBlog
Submit

Hacking, PenTest, and Cybersecurity Tools for Your Security Arsenal!

Kitploit is a directory of hacking, cybersecurity, and pentesting tools. Discover the latest project updates to find vulnerabilities, analyze systems, automate testing, and strengthen your security.

··Feeds·Contact·Privacy·© 2026 Kitploit

Tool Directory

Categories

View all categories
Loading categories
PcapXray — ❄️ PcapXray - A Network Forensics Tool - To visualize a Packet Capture offline as a Network Diagram including device identification, highlight important communication and file extraction | Kitploit
Tools/GitHubGitHub/srixivas/pcapxray
OSINT (Open Source Intelligence)Packet Sniffing & AnalysisNetwork MappingNetwork ForensicsForensicsMalware AnalysisCTFThreat IntelligenceLearning & EducationDNS Analysis
GitHubsrixivas/pcapxray

PcapXray

1.9k2923 months agoReviewed by Kitploit

Most Popular

View all →

Discover the most used tools by our community.

Explore all tools

Browse our collection of tools

View all tools →
Share

❄️ PcapXray - A Network Forensics Tool - To visualize a Packet Capture offline as a Network Diagram including device identification, highlight important communication and file extraction

View Repository

PcapXray CI codecov defcon27

A network forensics tool — visualize PCAP files or live traffic as an annotated network diagram with device identification, protocol classification, Tor detection, and malicious traffic flagging.
PcapXray


Module Overview

root@kitploit:~
graph TD
    UI[user_interface.py\nGUI controller] --> PR[pcap_reader\nFile + Live capture]
    PR --> ENG[engines/\nauto · dpkt · scapy · pyshark]
    PR --> MEM[(memory.py\nShared state)]
    MEM --> CDF[communication_details_fetch\nDNS · whois]
    MEM --> DDF[device_details_fetch\nOUI vendor lookup]
    MEM --> TTH[tor_traffic_handle\nTor consensus]
    MEM --> MTI[malicious_traffic_identifier\nHeuristic flags]
    MEM --> SS[sqlite_store\nSession persistence]
    MEM --> PLN[plot_lan_network\nGraphviz PNG + pyvis HTML]
    UI --> IG[interactive_gui\nMatplotlib panel]
    IG --> MEM
    PLN --> OUT[Reports + Diagrams]

Design Specification

Goal

Given a PCAP file or a live network interface, plot a network diagram displaying hosts, traffic flows, important/Tor/malicious communication, and data involved in each session.

Problem

  • Investigation of a PCAP file takes a long time given the initial glitch to start the investigation
  • Faced by every forensics investigator and anyone analyzing network traffic

Solution: Speed up the investigation process

Make a network diagram with the following features:

Tool Highlights:

  • Network Diagram — summary network diagram of the full network
  • Web traffic with server details
  • Tor traffic detection
  • Possible malicious traffic flagging
  • Data obtained from packets in report — device/traffic/payloads
  • Device details — OUI vendor, hostname resolution, whois
  • Live traffic capture with real-time graph updates
  • Interactive graph — pyvis HTML for in-browser exploration
  • Session persistence — SQLite cache for reload without re-analysis

Screenshots

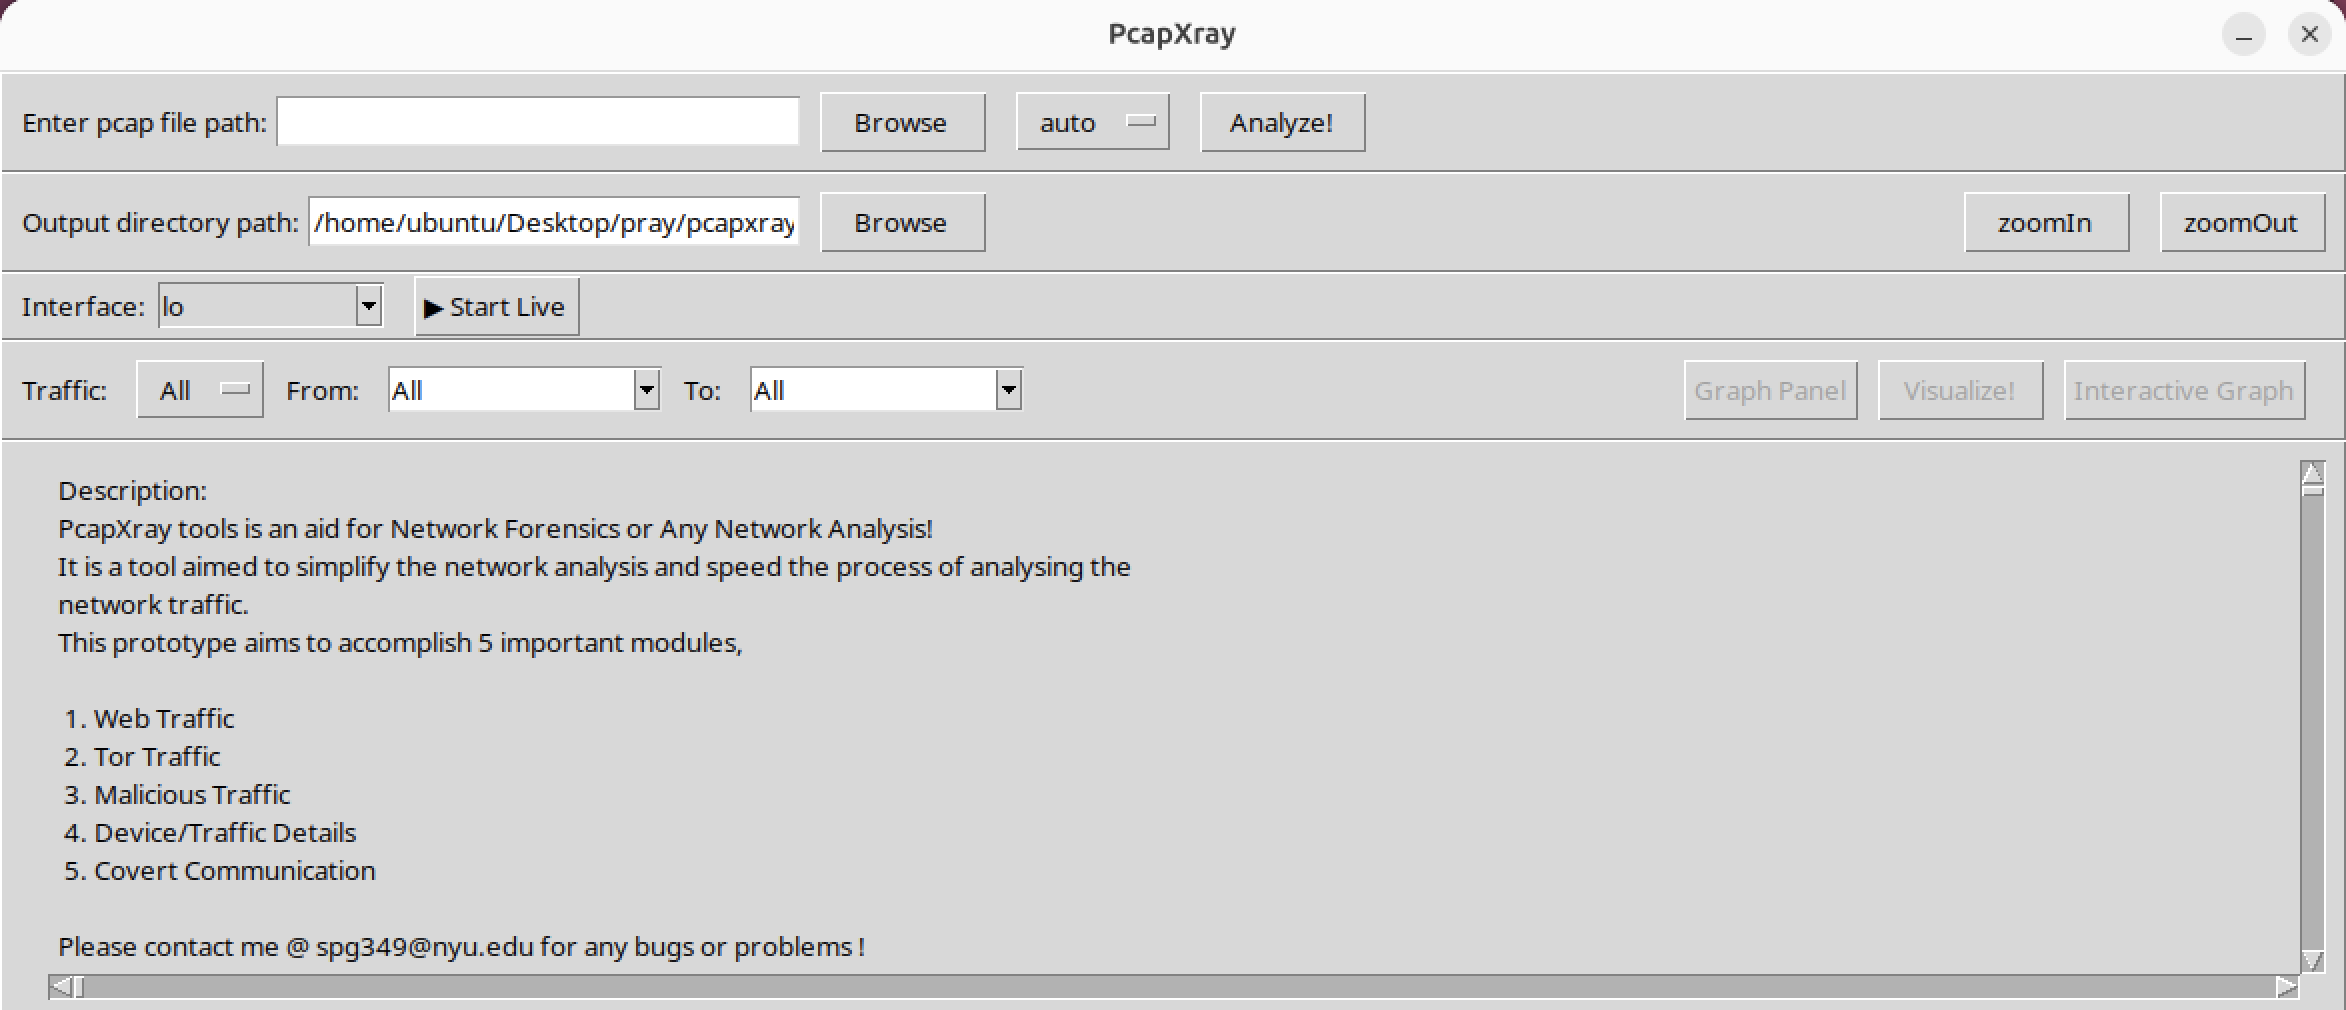
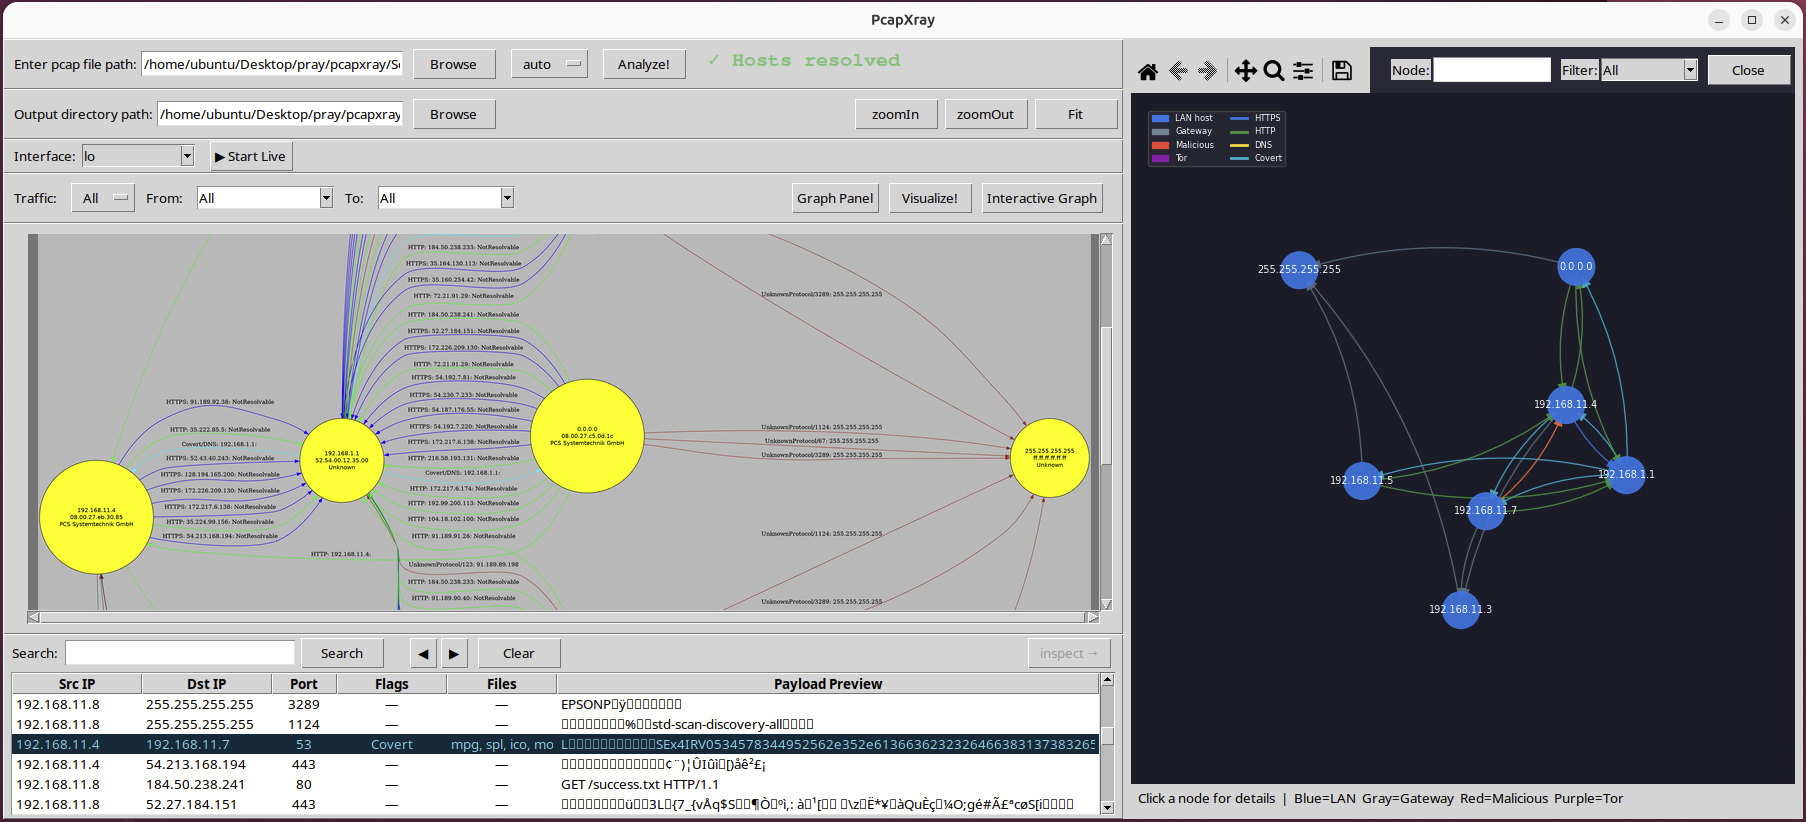
Main application panel Main window

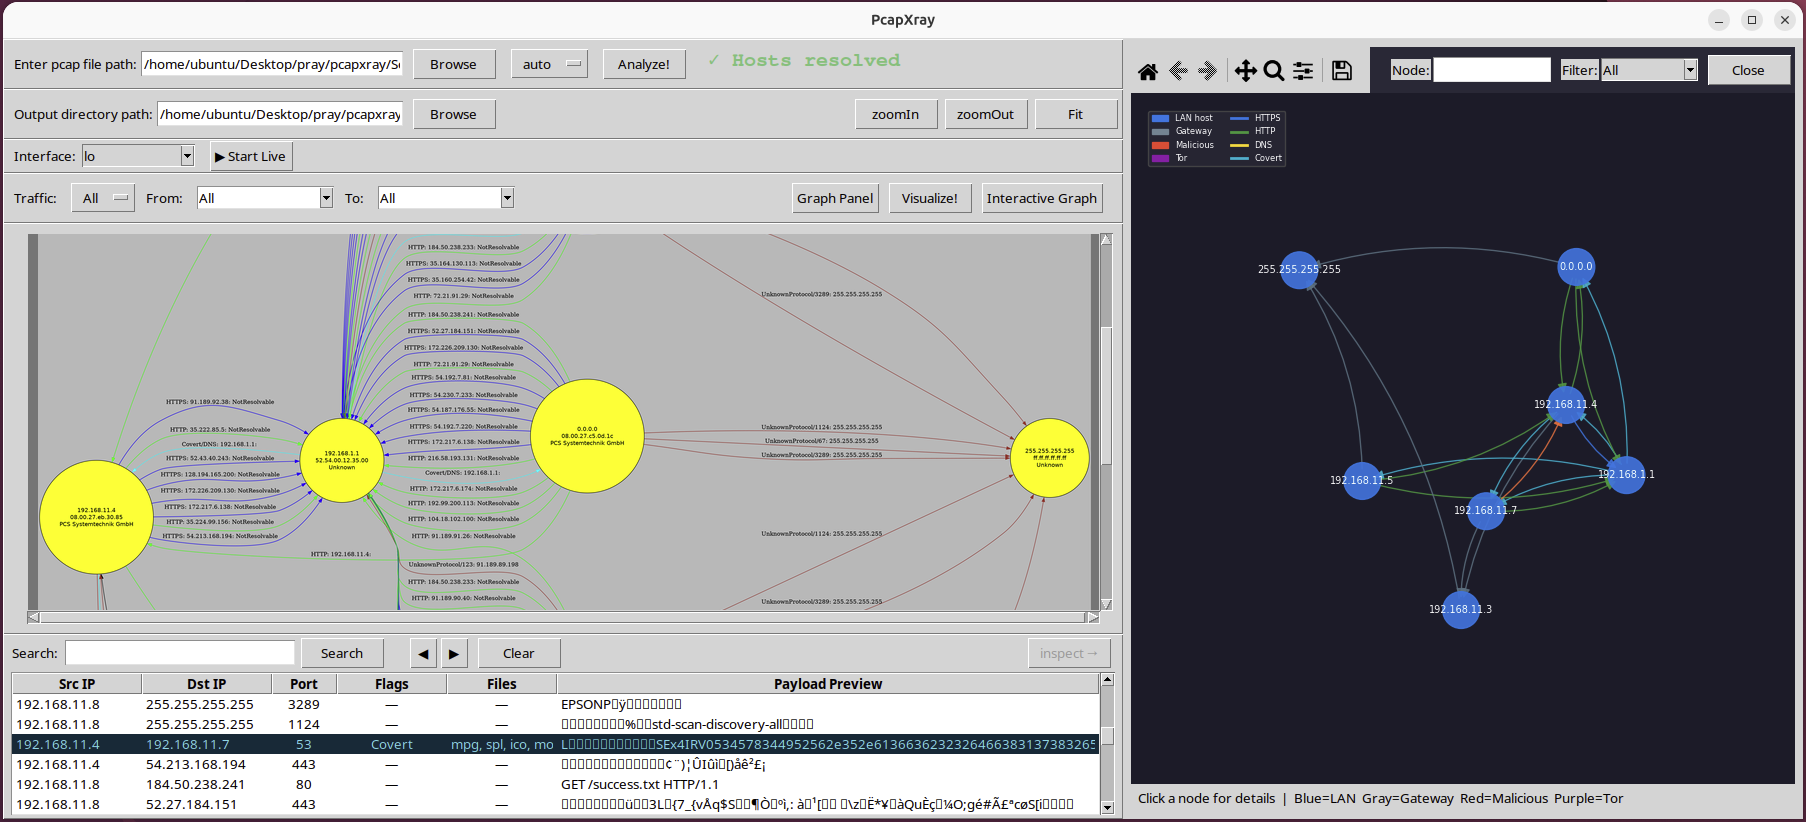
Static network graph — natural layout with auto-fit zoom Network graph v5.2

Demo

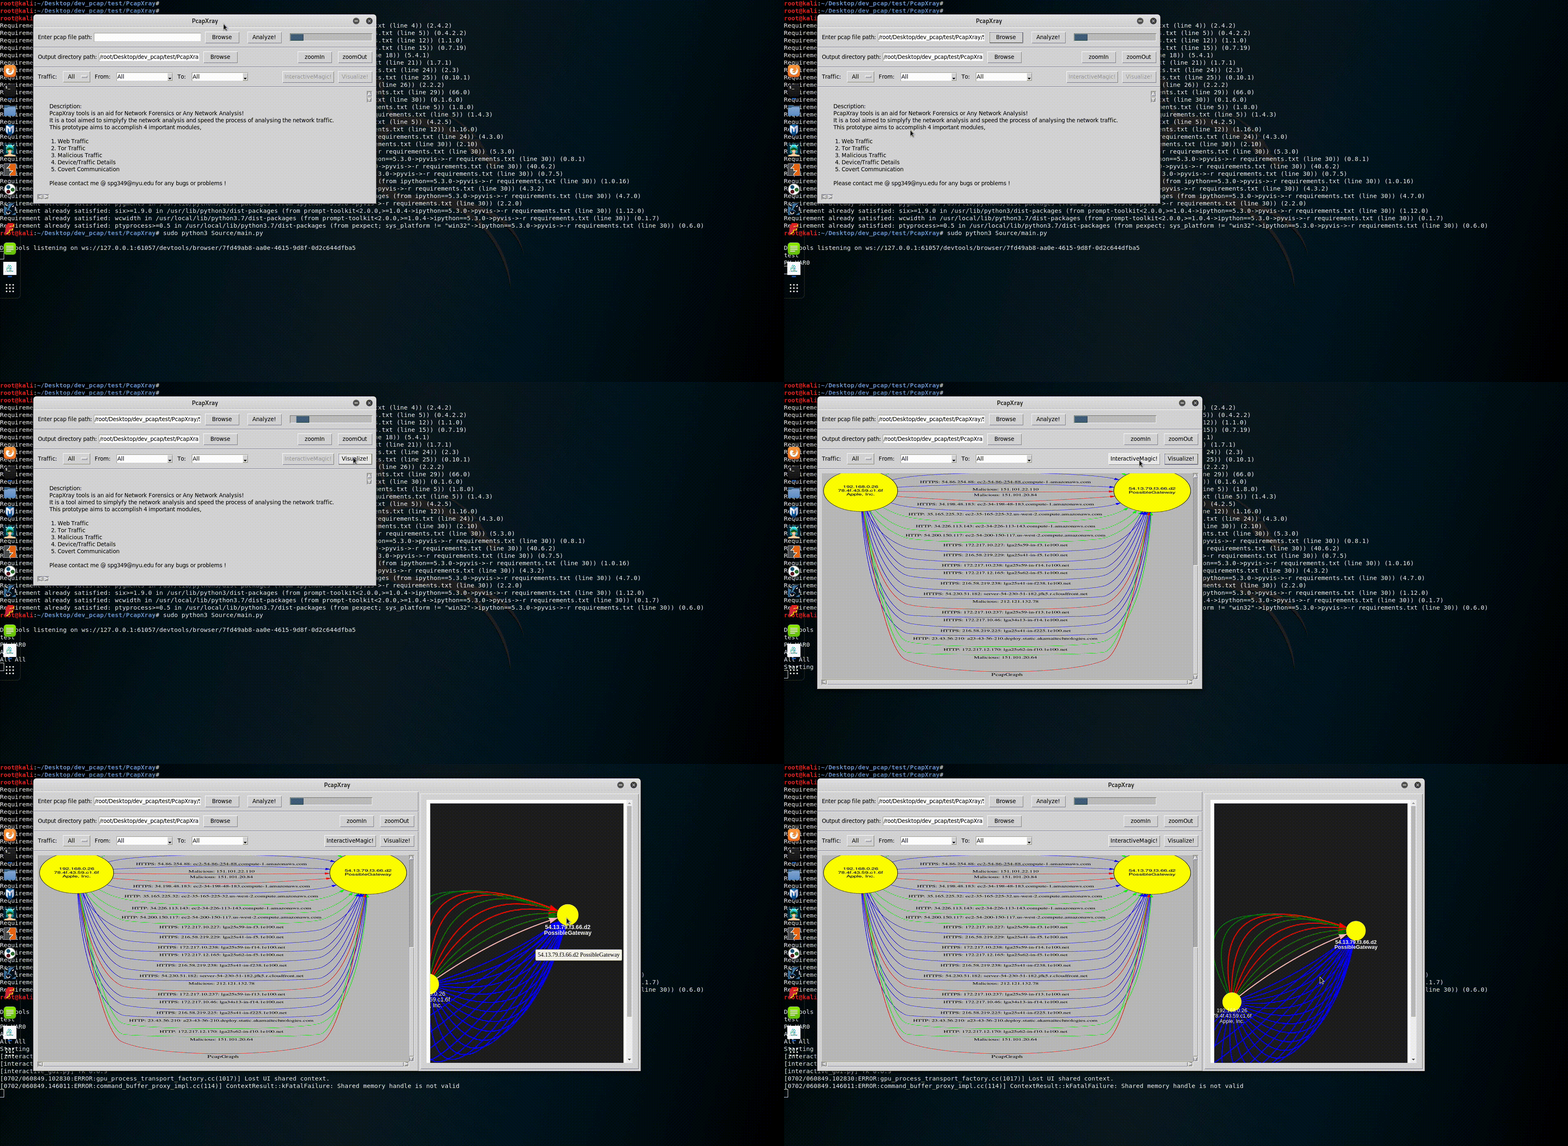
Demo


Setup

Requirements: Python 3.10+

Linux (Ubuntu/Debian)

root@kitploit:~
sudo apt-get update
sudo apt-get install -y python3-tk graphviz tshark
pip3 install -r requirements.txt
sudo python3 Source/main.py

If using a specific Python version (3.11, 3.12), replace python3-tk with python3.11-tk or python3.12-tk. Install Pillow via pip only — do not install python3-pil from apt as it conflicts.

macOS

root@kitploit:~
brew install graphviz
pip3 install -r requirements.txt
sudo python3 Source/main.py

sudo is required for live capture. File analysis runs without it.


Usage

File analysis

  1. Enter or browse to a .pcap / .pcapng file
  2. Choose output directory
  3. Select engine (default: auto)
  4. Click Analyze!
  5. Click Visualize! to generate the network diagram
  6. Click Interactive Graph to open the pyvis HTML in your browser
  7. Click Graph Panel to open the matplotlib interactive view

Live capture

  1. Select your network interface from the dropdown
  2. Click ▶ Start Live (requires sudo / root)
  3. The graph panel opens and updates every 4 seconds
  4. Click ⏹ Stop to end capture — runs covert channel detection post-capture
  5. Click Visualize! to generate a point-in-time static snapshot

PCAP Engines

PcapXray supports four interchangeable parsing backends selectable from the toolbar:


Components

  • Network Diagram — graphviz-rendered PNG of the full LAN topology
  • Device/Traffic Details and Analysis — per-session payloads, TLS records, DNS queries
  • Malicious Traffic Identification — port and domain heuristic-based flagging
  • Tor Traffic — consensus download + session matching
  • Live Capture — AsyncSniffer with real-time matplotlib graph, 4-second refresh
  • GUI — Tkinter interface with filter options, zoom, and session controls

Python Libraries

All dependencies are in requirements.txt — install with pip3 install -r requirements.txt. Tkinter is the only library not on PyPI — install via your system package manager (python3-tk on Linux, included with Python on macOS).


Development & Architecture

See DEV.md for full architecture documentation, call flow diagrams, module responsibilities, threading model, and how to add a new engine.


Security

See SECURITY.md for responsible disclosure, security posture, and known limitations.


Testing

root@kitploit:~
# Fast suite — no network calls
pytest -m "not network" Test/

# Full suite including real DNS + Tor
pytest Test/

# Isolated engine environments
tox
tox -e all-engines

96+ tests across Python 3.10, 3.11, 3.12.


Additional Information

  • Tested on macOS and Linux
  • Traffic filter options: All, HTTP, HTTPS, Tor, Malicious, ICMP, DNS
  • Presented at DEF CON 27 Demo Labs

Known Limitations

  • macOS minimize restore — clicking the dock icon after minimizing may not restore the window due to a known Tk/Cocoa bug. Use Cmd+Tab or right-click the dock icon → Show as a workaround.
  • Large captures — memory usage scales with session count; very large PCAPs (1GB+) may be slow. Use dpkt engine for best performance on large files.

  • Live capture privileges — requires root/sudo on all platforms for raw socket access.

Future

  • More protocol support (QUIC, HTTP/2, mDNS)
  • Web UI / eBPF engine
  • Go rewrite for PacketTotal-scale performance

Credits

  • Professor Marc Budofsky
  • Kevin Gallagher
  • All contributors and dependent library authors
  • Logo: logomakr.com + inkscape.org
  • Presented at DEF CON 27 Demo Labs

Just for Security Fun!

Download Tool
EngineBest forNotes
autoGeneral useTries dpkt first, falls back to scapy
dpktLarge files, low memoryFast offline parsing
scapyDeep protocol inspectionTLS-aware, slower on large files
pysharkMaximum protocol coverageRequires tshark installed
LibraryPurpose
scapyPacket reading and live capture
dpktFast PCAP parsing engine
pysharktshark-backed parsing engine
ipwhoisWhois / RDAP lookup
netaddrIP address classification
pillowImage processing for graph display
stemTor consensus data fetch
graphvizNetwork diagram rendering
networkxGraph construction and layout
matplotlibEmbedded interactive graph panel
pyvisInteractive HTML network graph
pydanticTyped data models for session state
cryptographyTLS cipher suite parsing