Semantic Observability for UNIX Systems - A lightweight C-based system prober with AI-powered analysis
Semantic Observability for UNIX Systems
A lightweight, portable system prober written in C that captures "system fingerprints" for AI-assisted analysis of non-obvious risks. Features auditd integration, explainable risk scoring, and a live web dashboard with enterprise-grade multi-user authentication.
Live Demo: sentinel.speytech.com


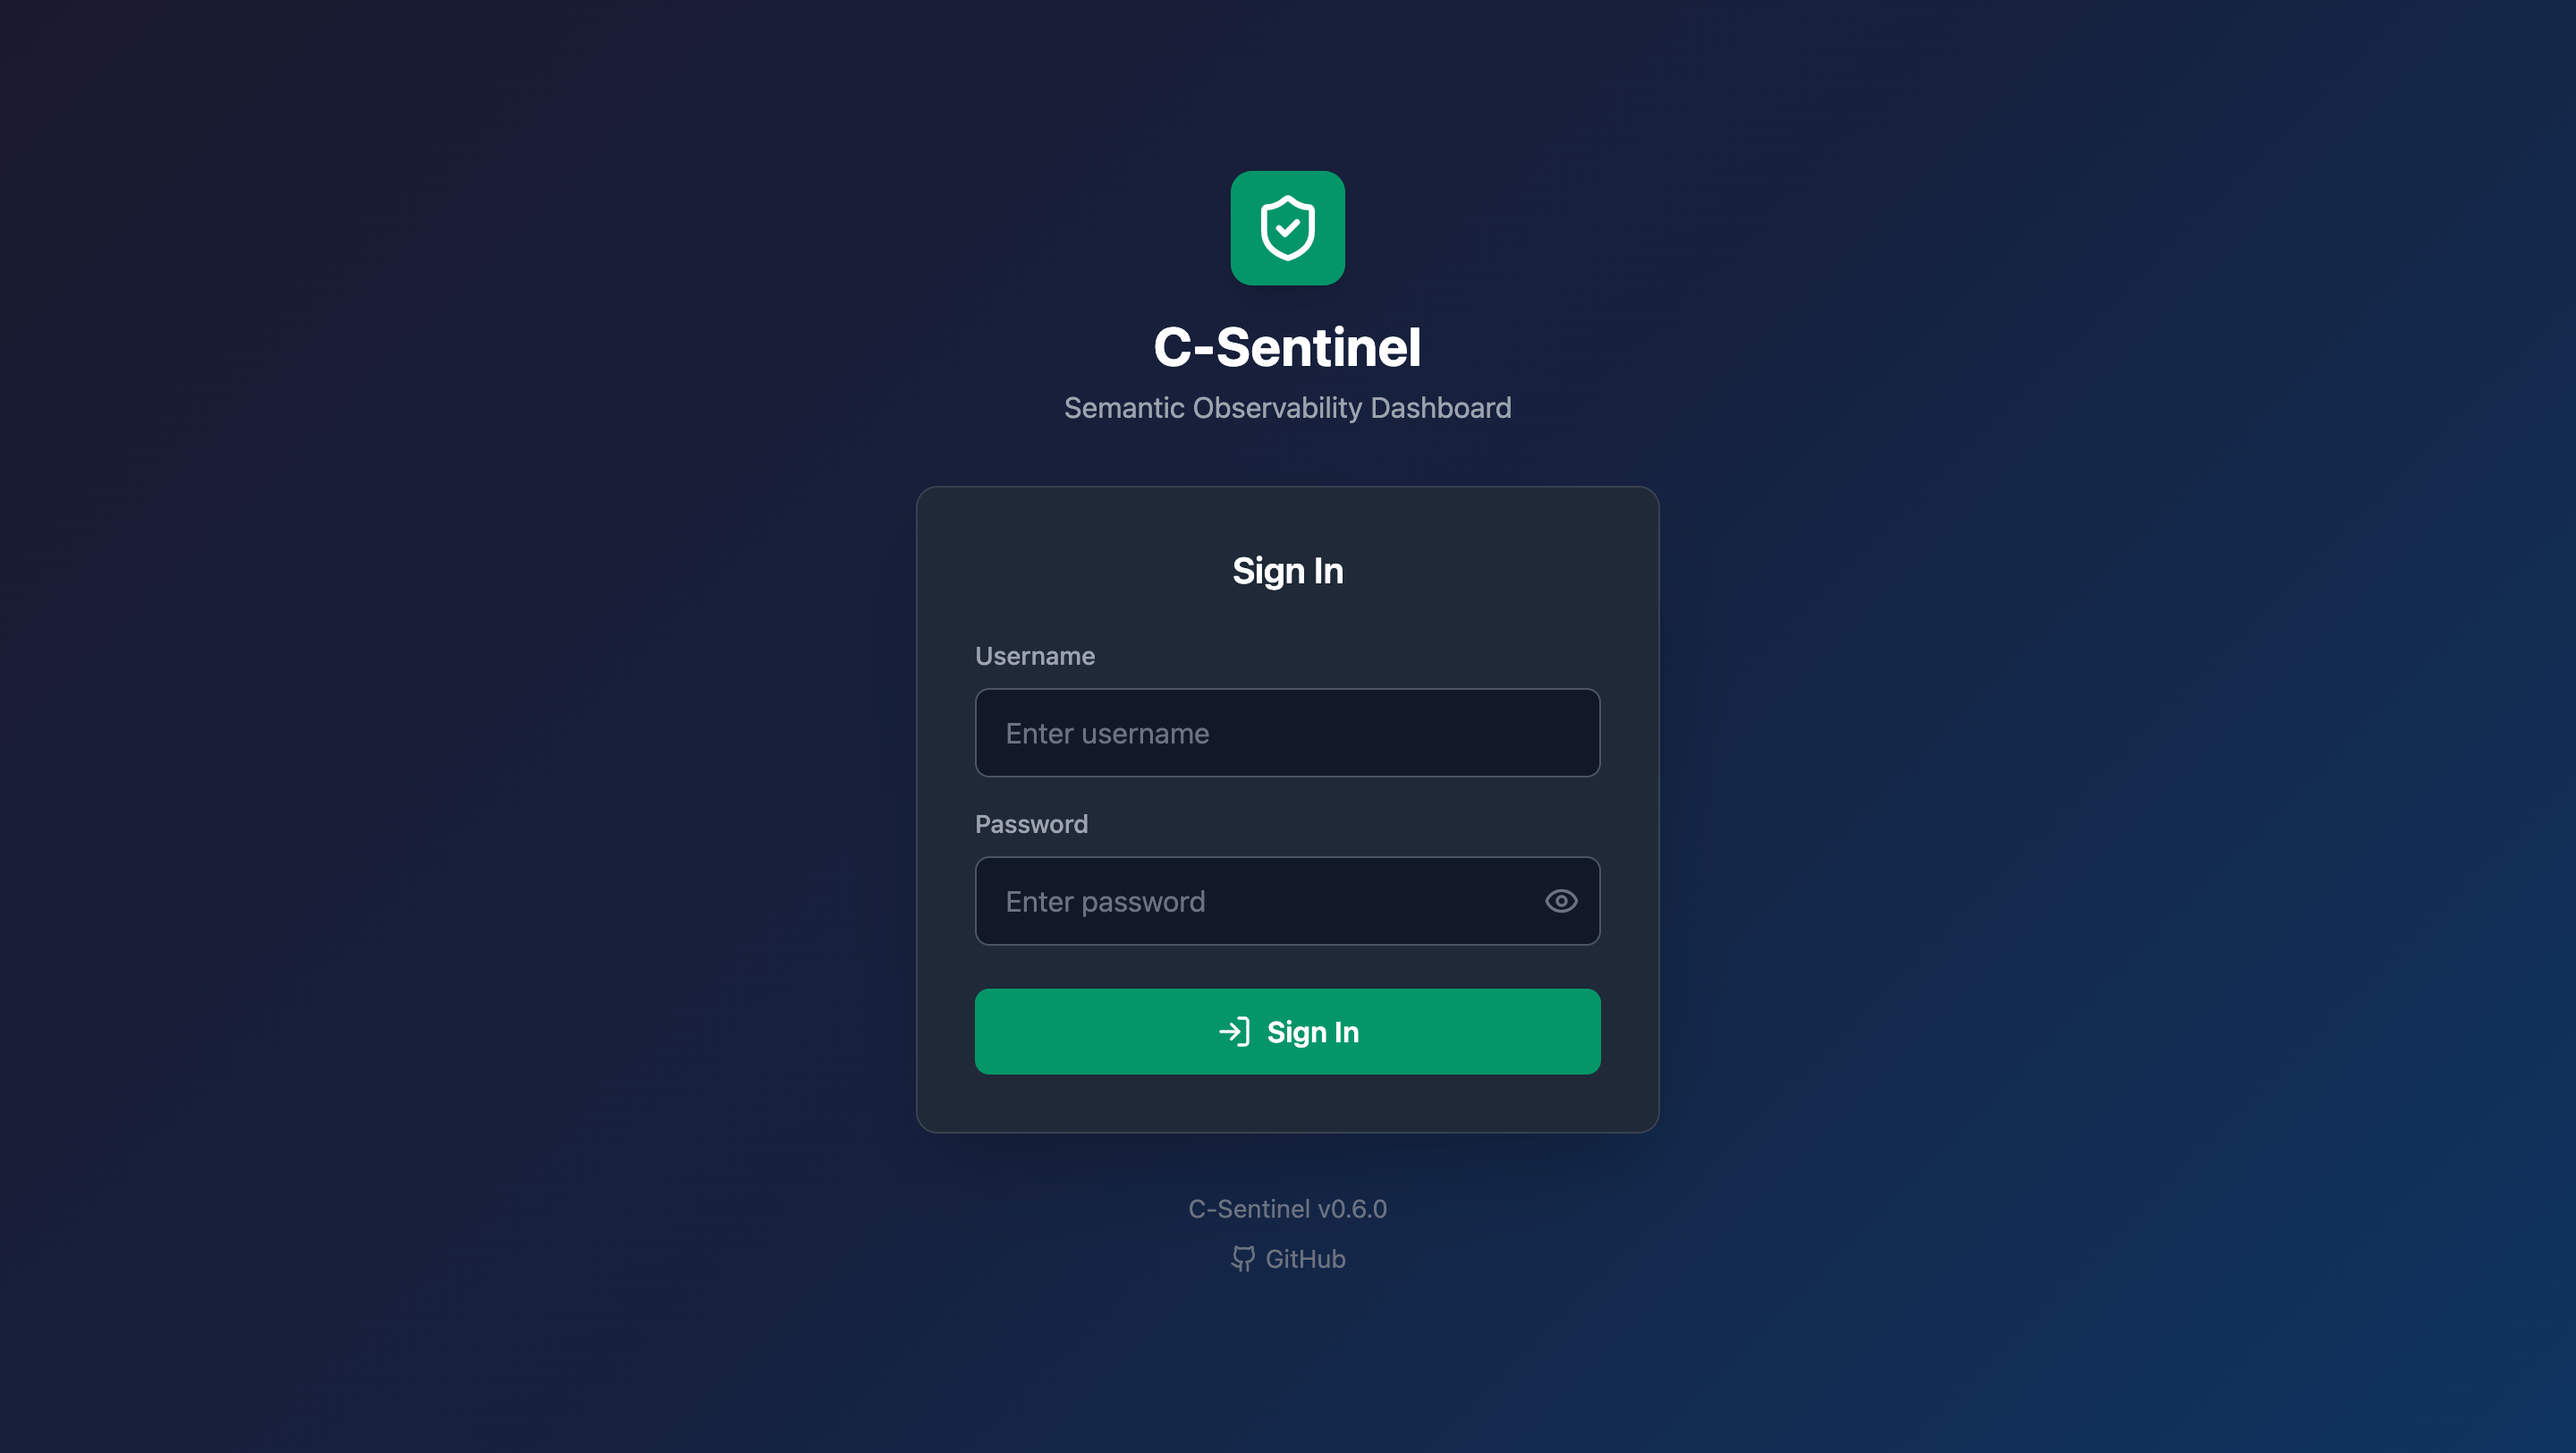
| Setup | Login |
|---|---|
![]() | ![]() |


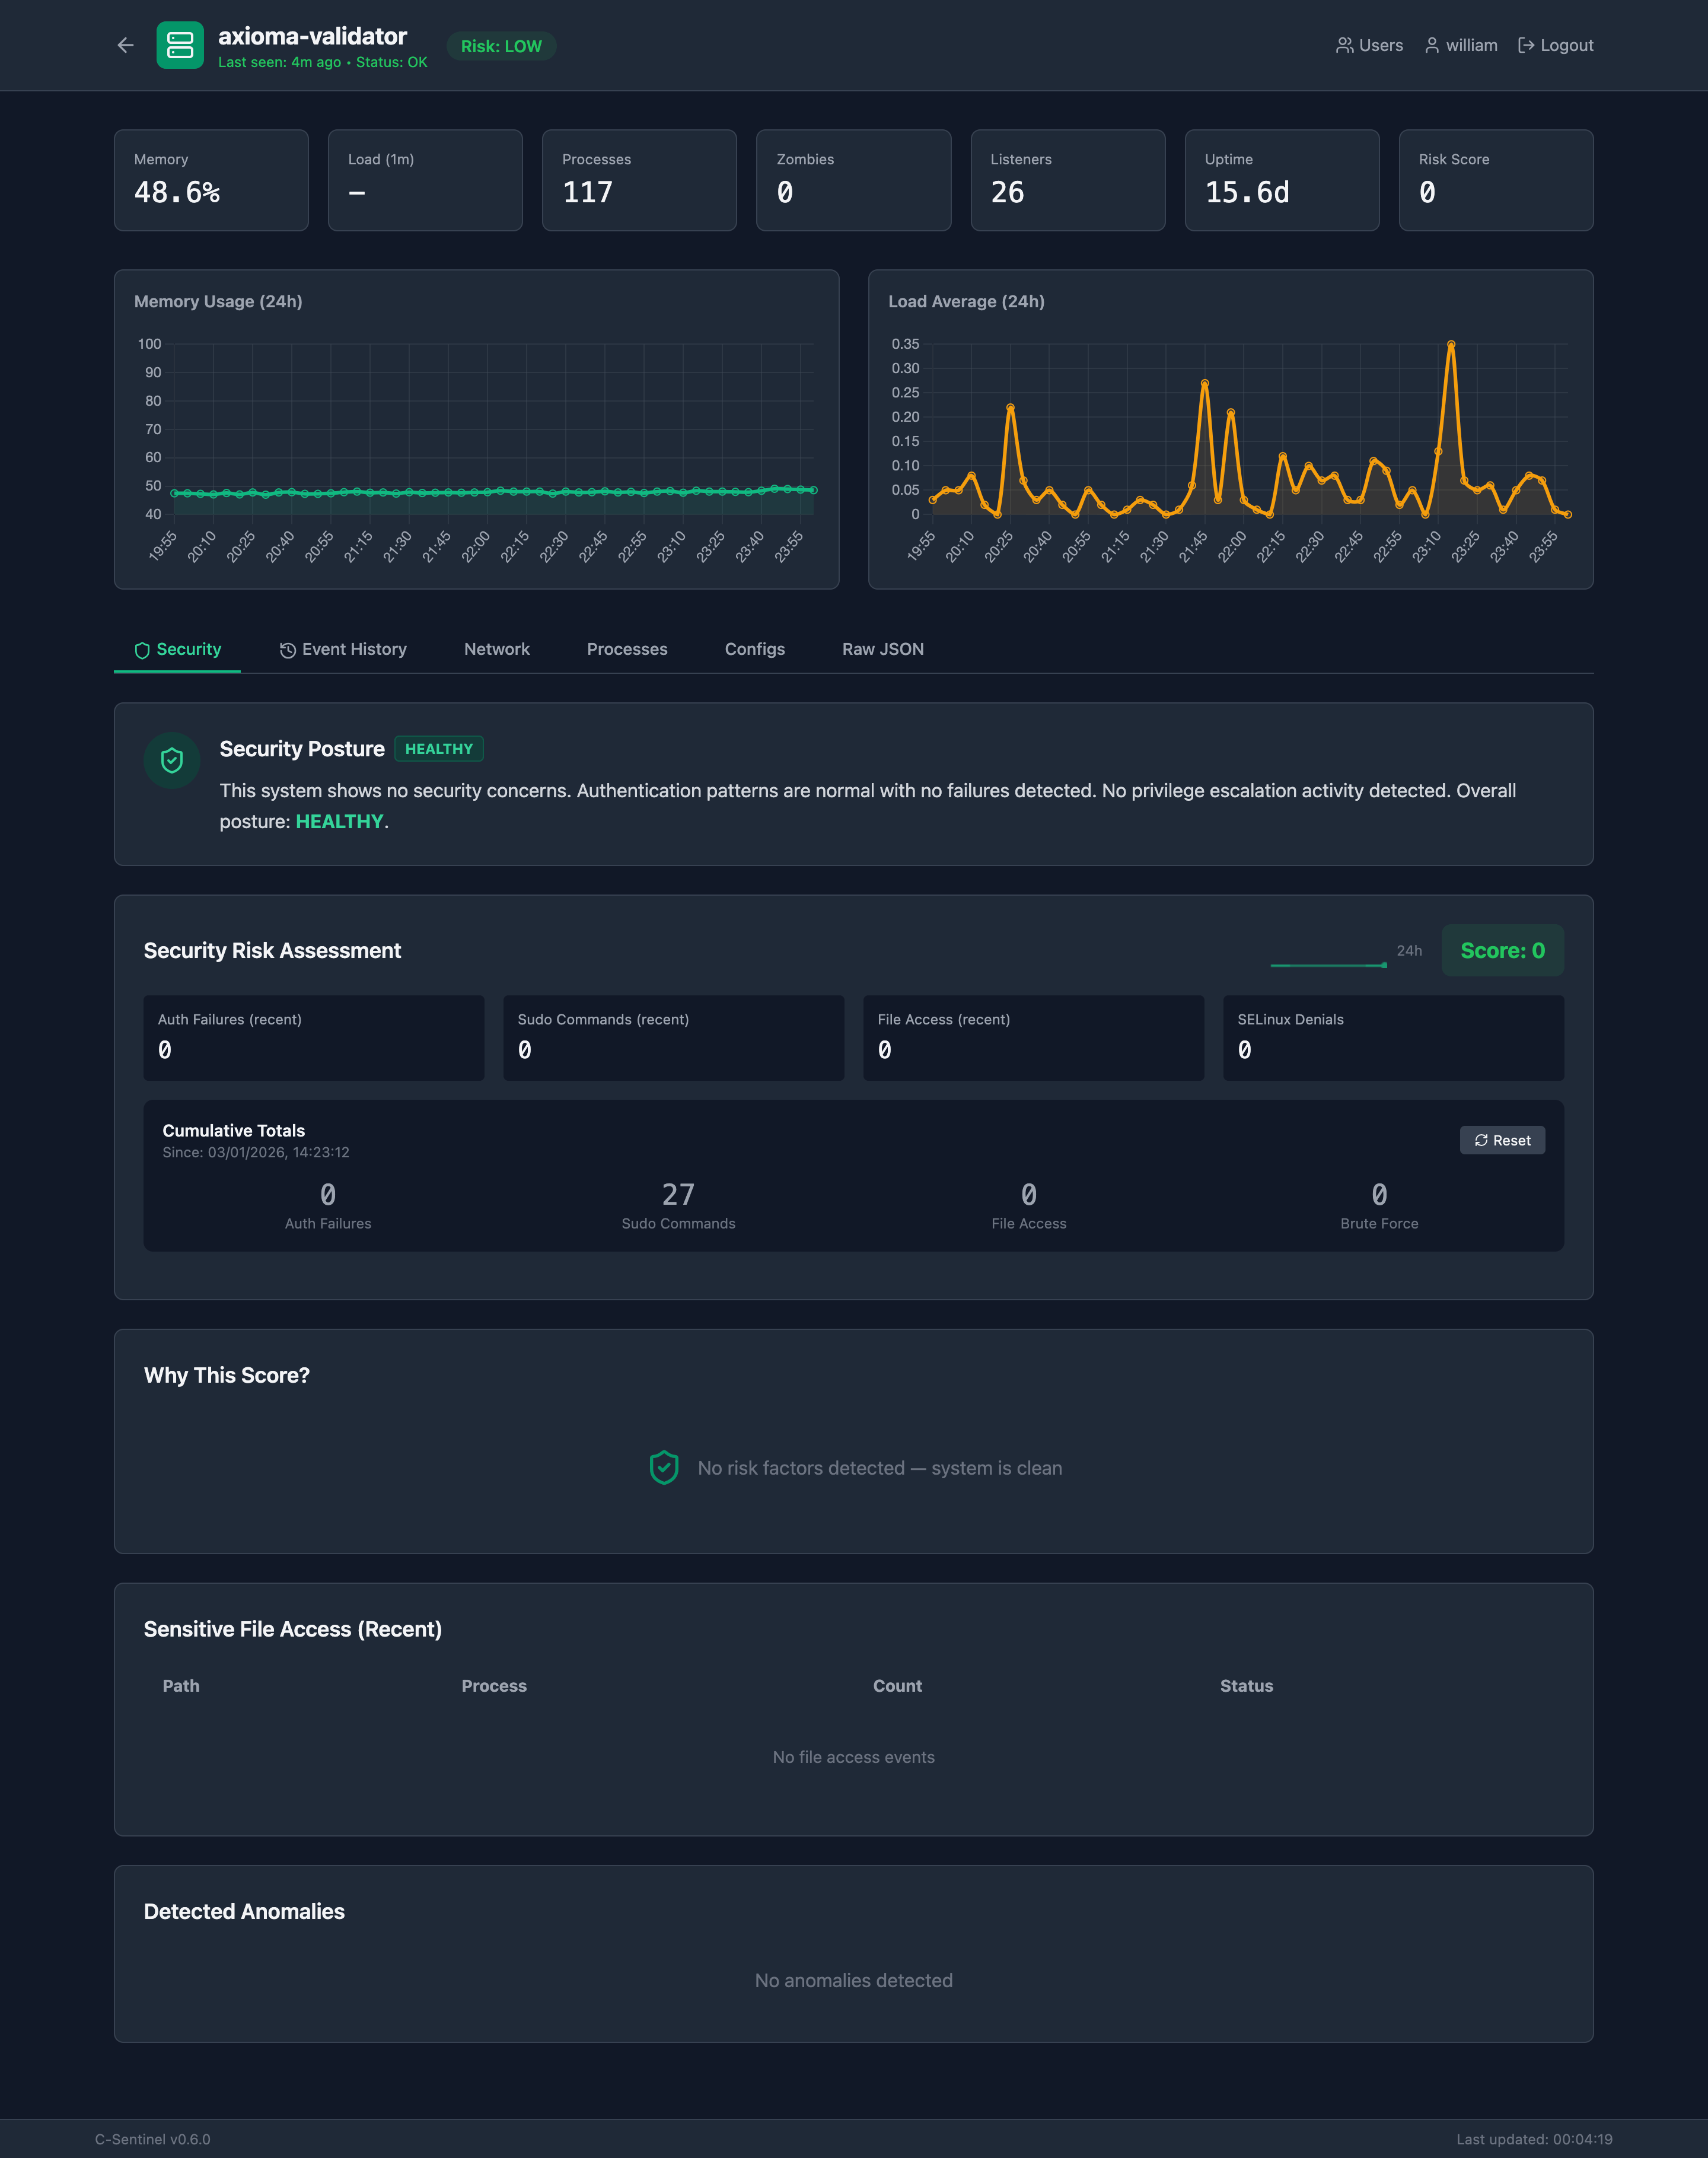
v0.5.x: Security posture summary, risk trend sparkline, learning indicator, explainable risk factors, email alerts, event history
v0.4.0: Auditd integration, brute force detection, privacy-preserving username hashing, process attribution, risk scoring
v0.3.0: Web Dashboard, SHA256 checksums, systemd service, baseline learning, network probe, watch mode
Modern observability tools like Dynatrace, Datadog, and Prometheus are excellent at metric collection and threshold alerting. But they answer a narrow question: "Is this metric outside its expected range?"
They struggle with:
C-Sentinel takes a different approach: capture a comprehensive system fingerprint—including security events—and use LLM reasoning to identify the "ghosts in the machine."
# Clone and build
git clone https://github.com/williamofai/c-sentinel.git
cd c-sentinel
make
# Quick analysis
./bin/sentinel --quick --network
# Quick analysis with security events (requires root for audit logs)
sudo ./bin/sentinel --quick --network --audit
# Learn baselines (automatic with --audit flag)
./bin/sentinel --learn --network
# Continuous monitoring with full context
sudo ./bin/sentinel --watch --interval 300 --network --audit
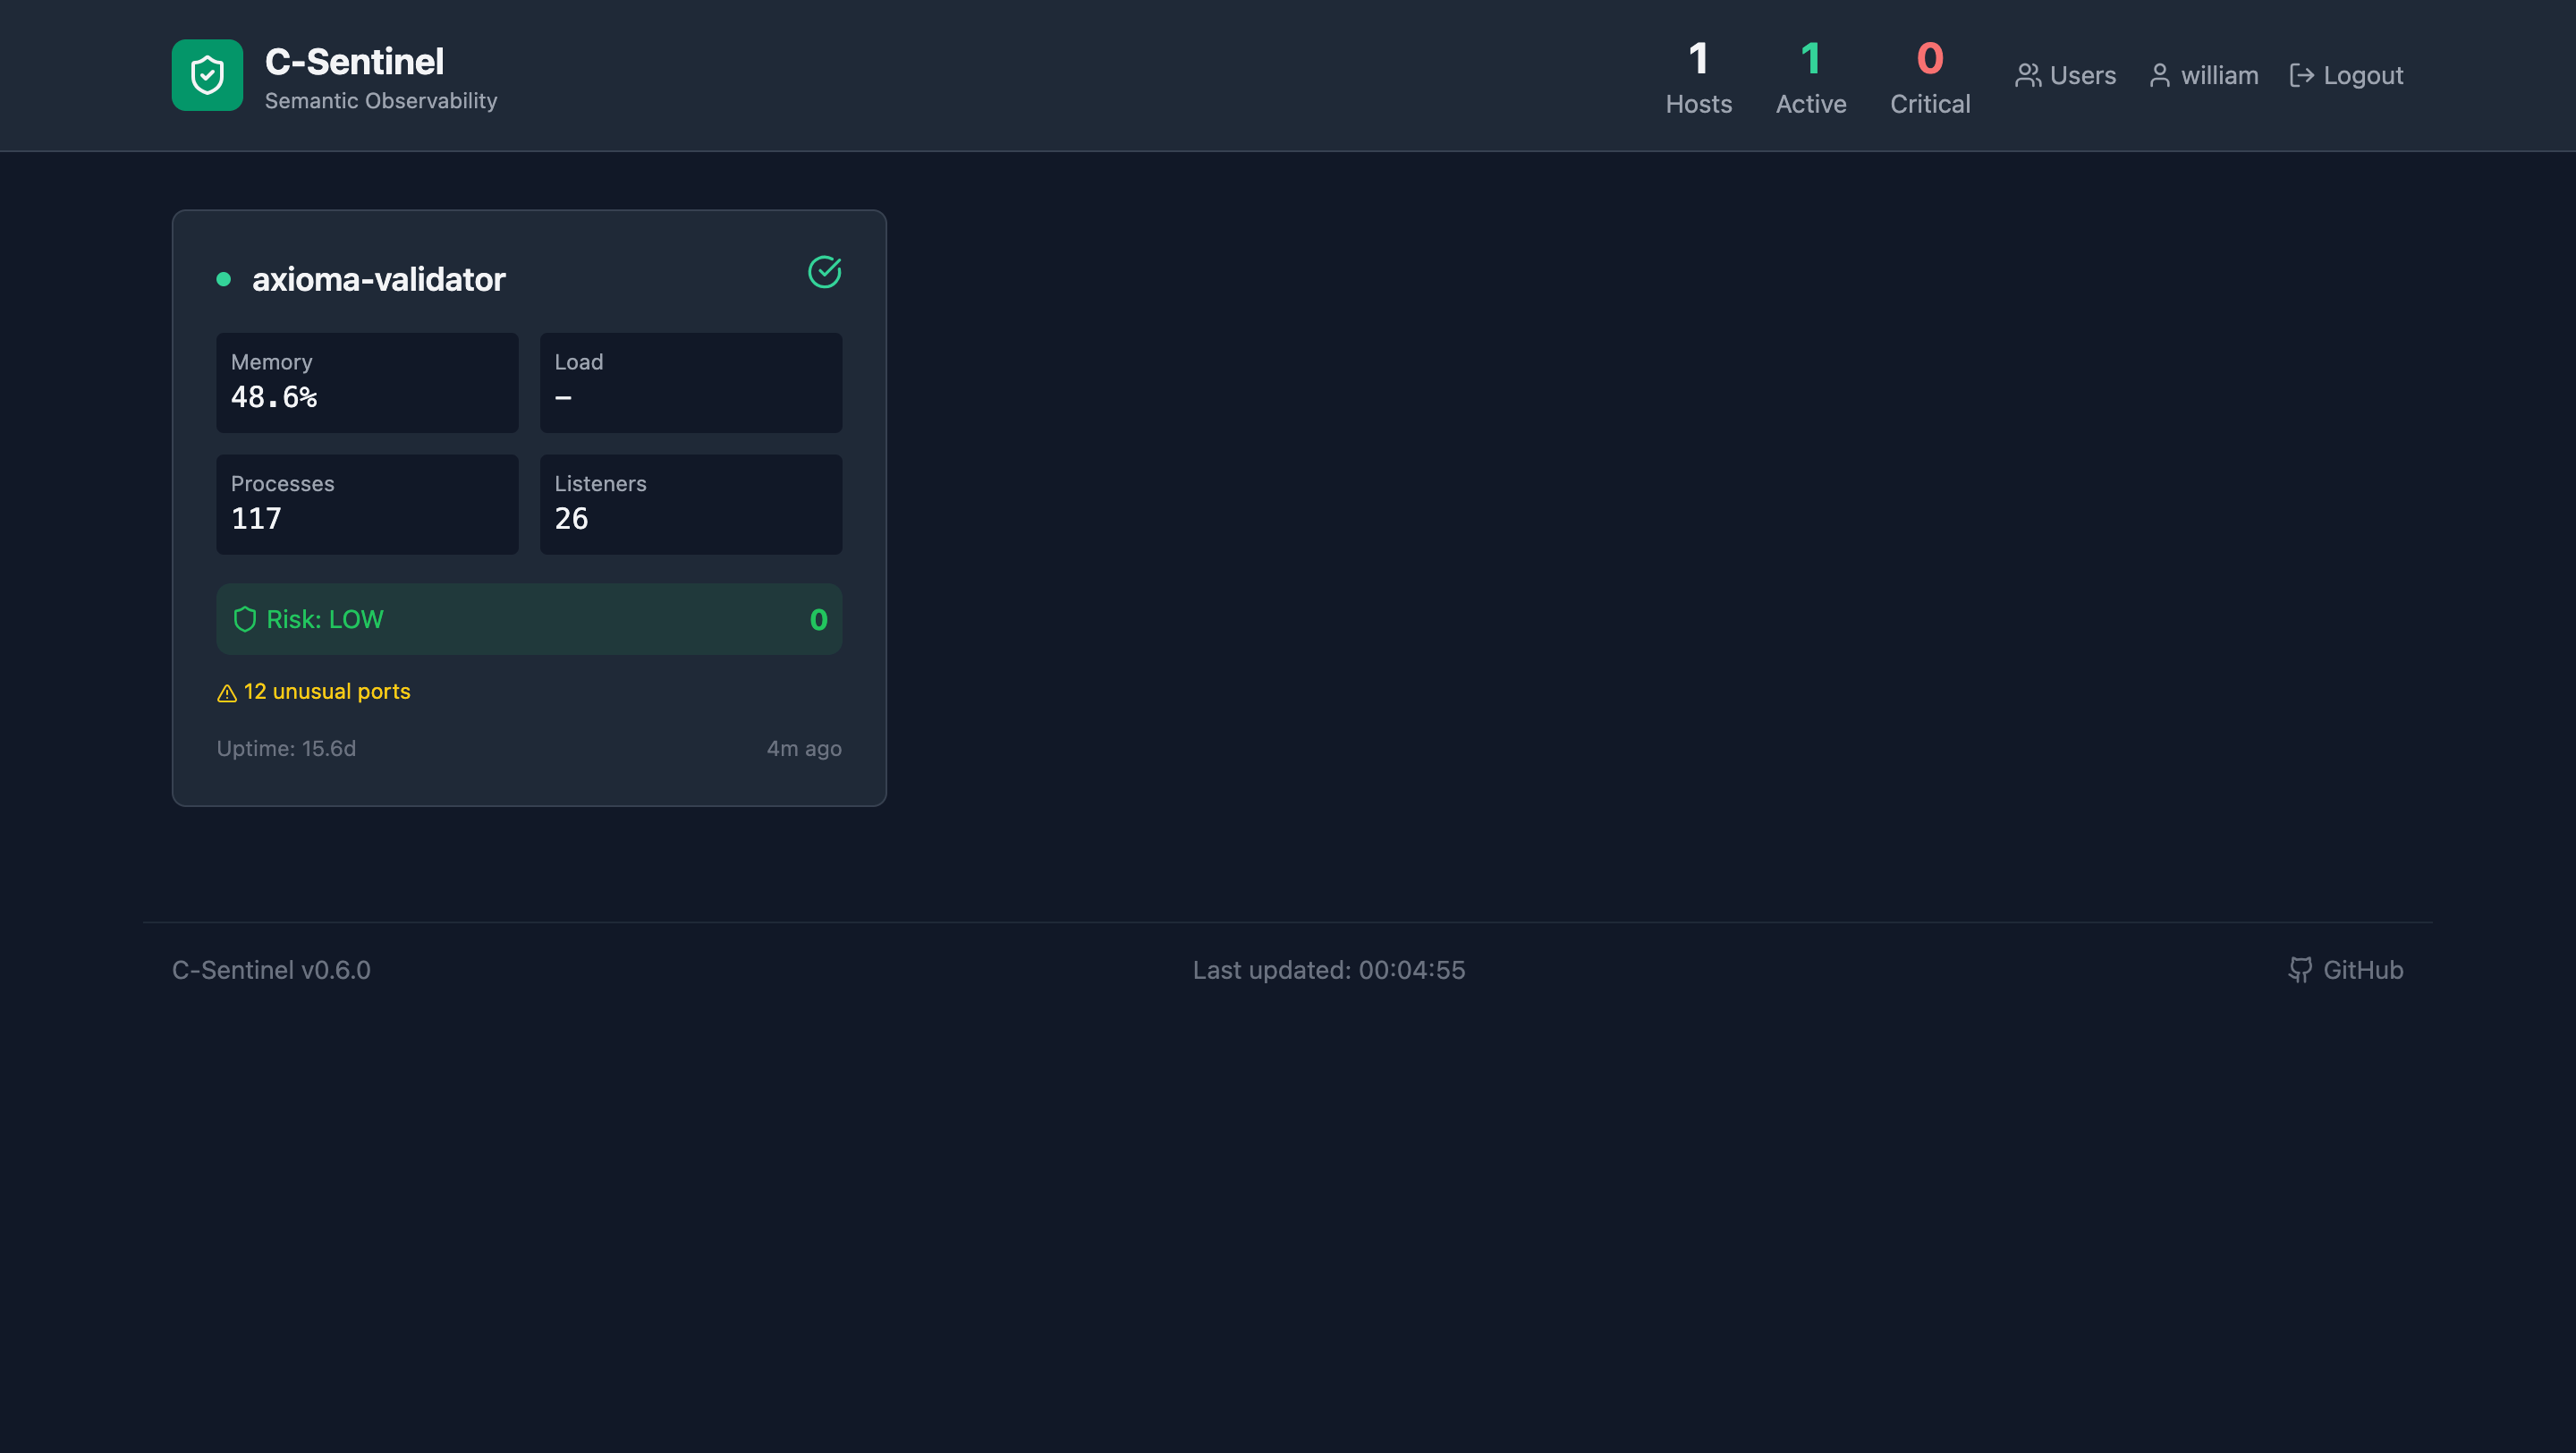
The web dashboard provides real-time security monitoring across your infrastructure.
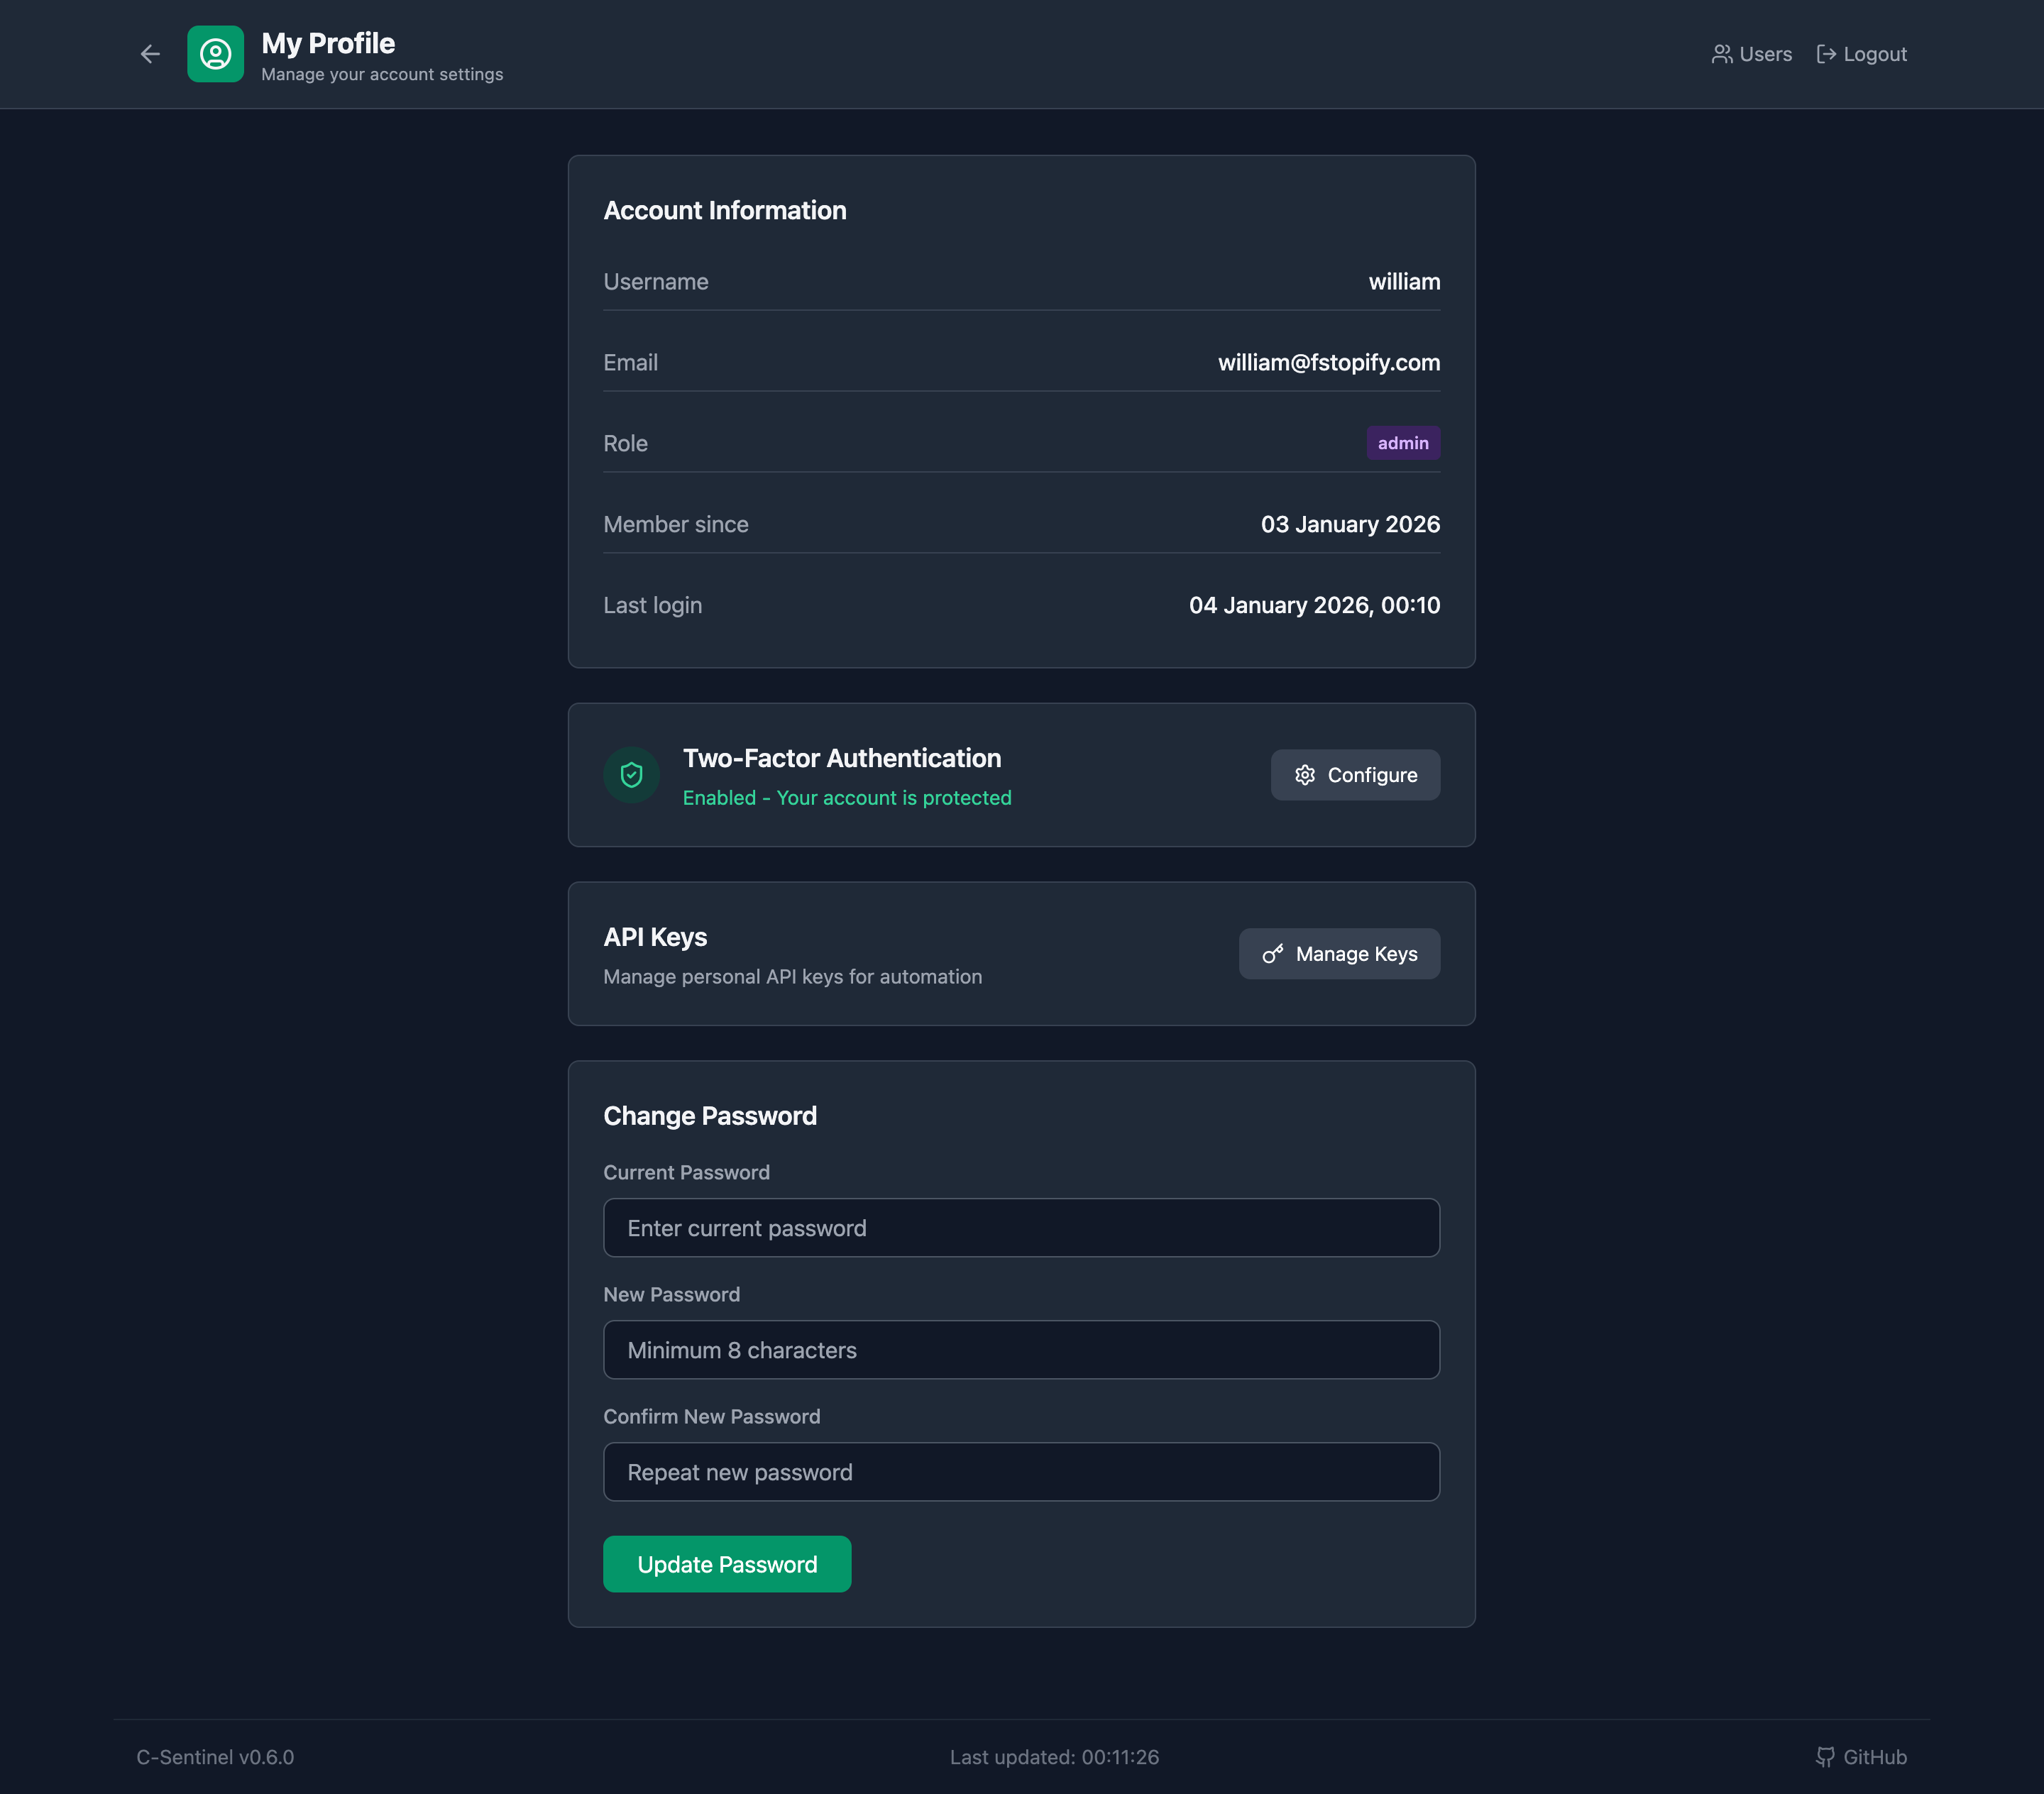
Enterprise-grade access control with three roles:
| Role | Permissions |
|---|---|
| Admin | Full access: manage users, view audit logs, all operations |
| Operator | Acknowledge events, reset counters, view all data |
| Viewer | Read-only access to dashboards and data |
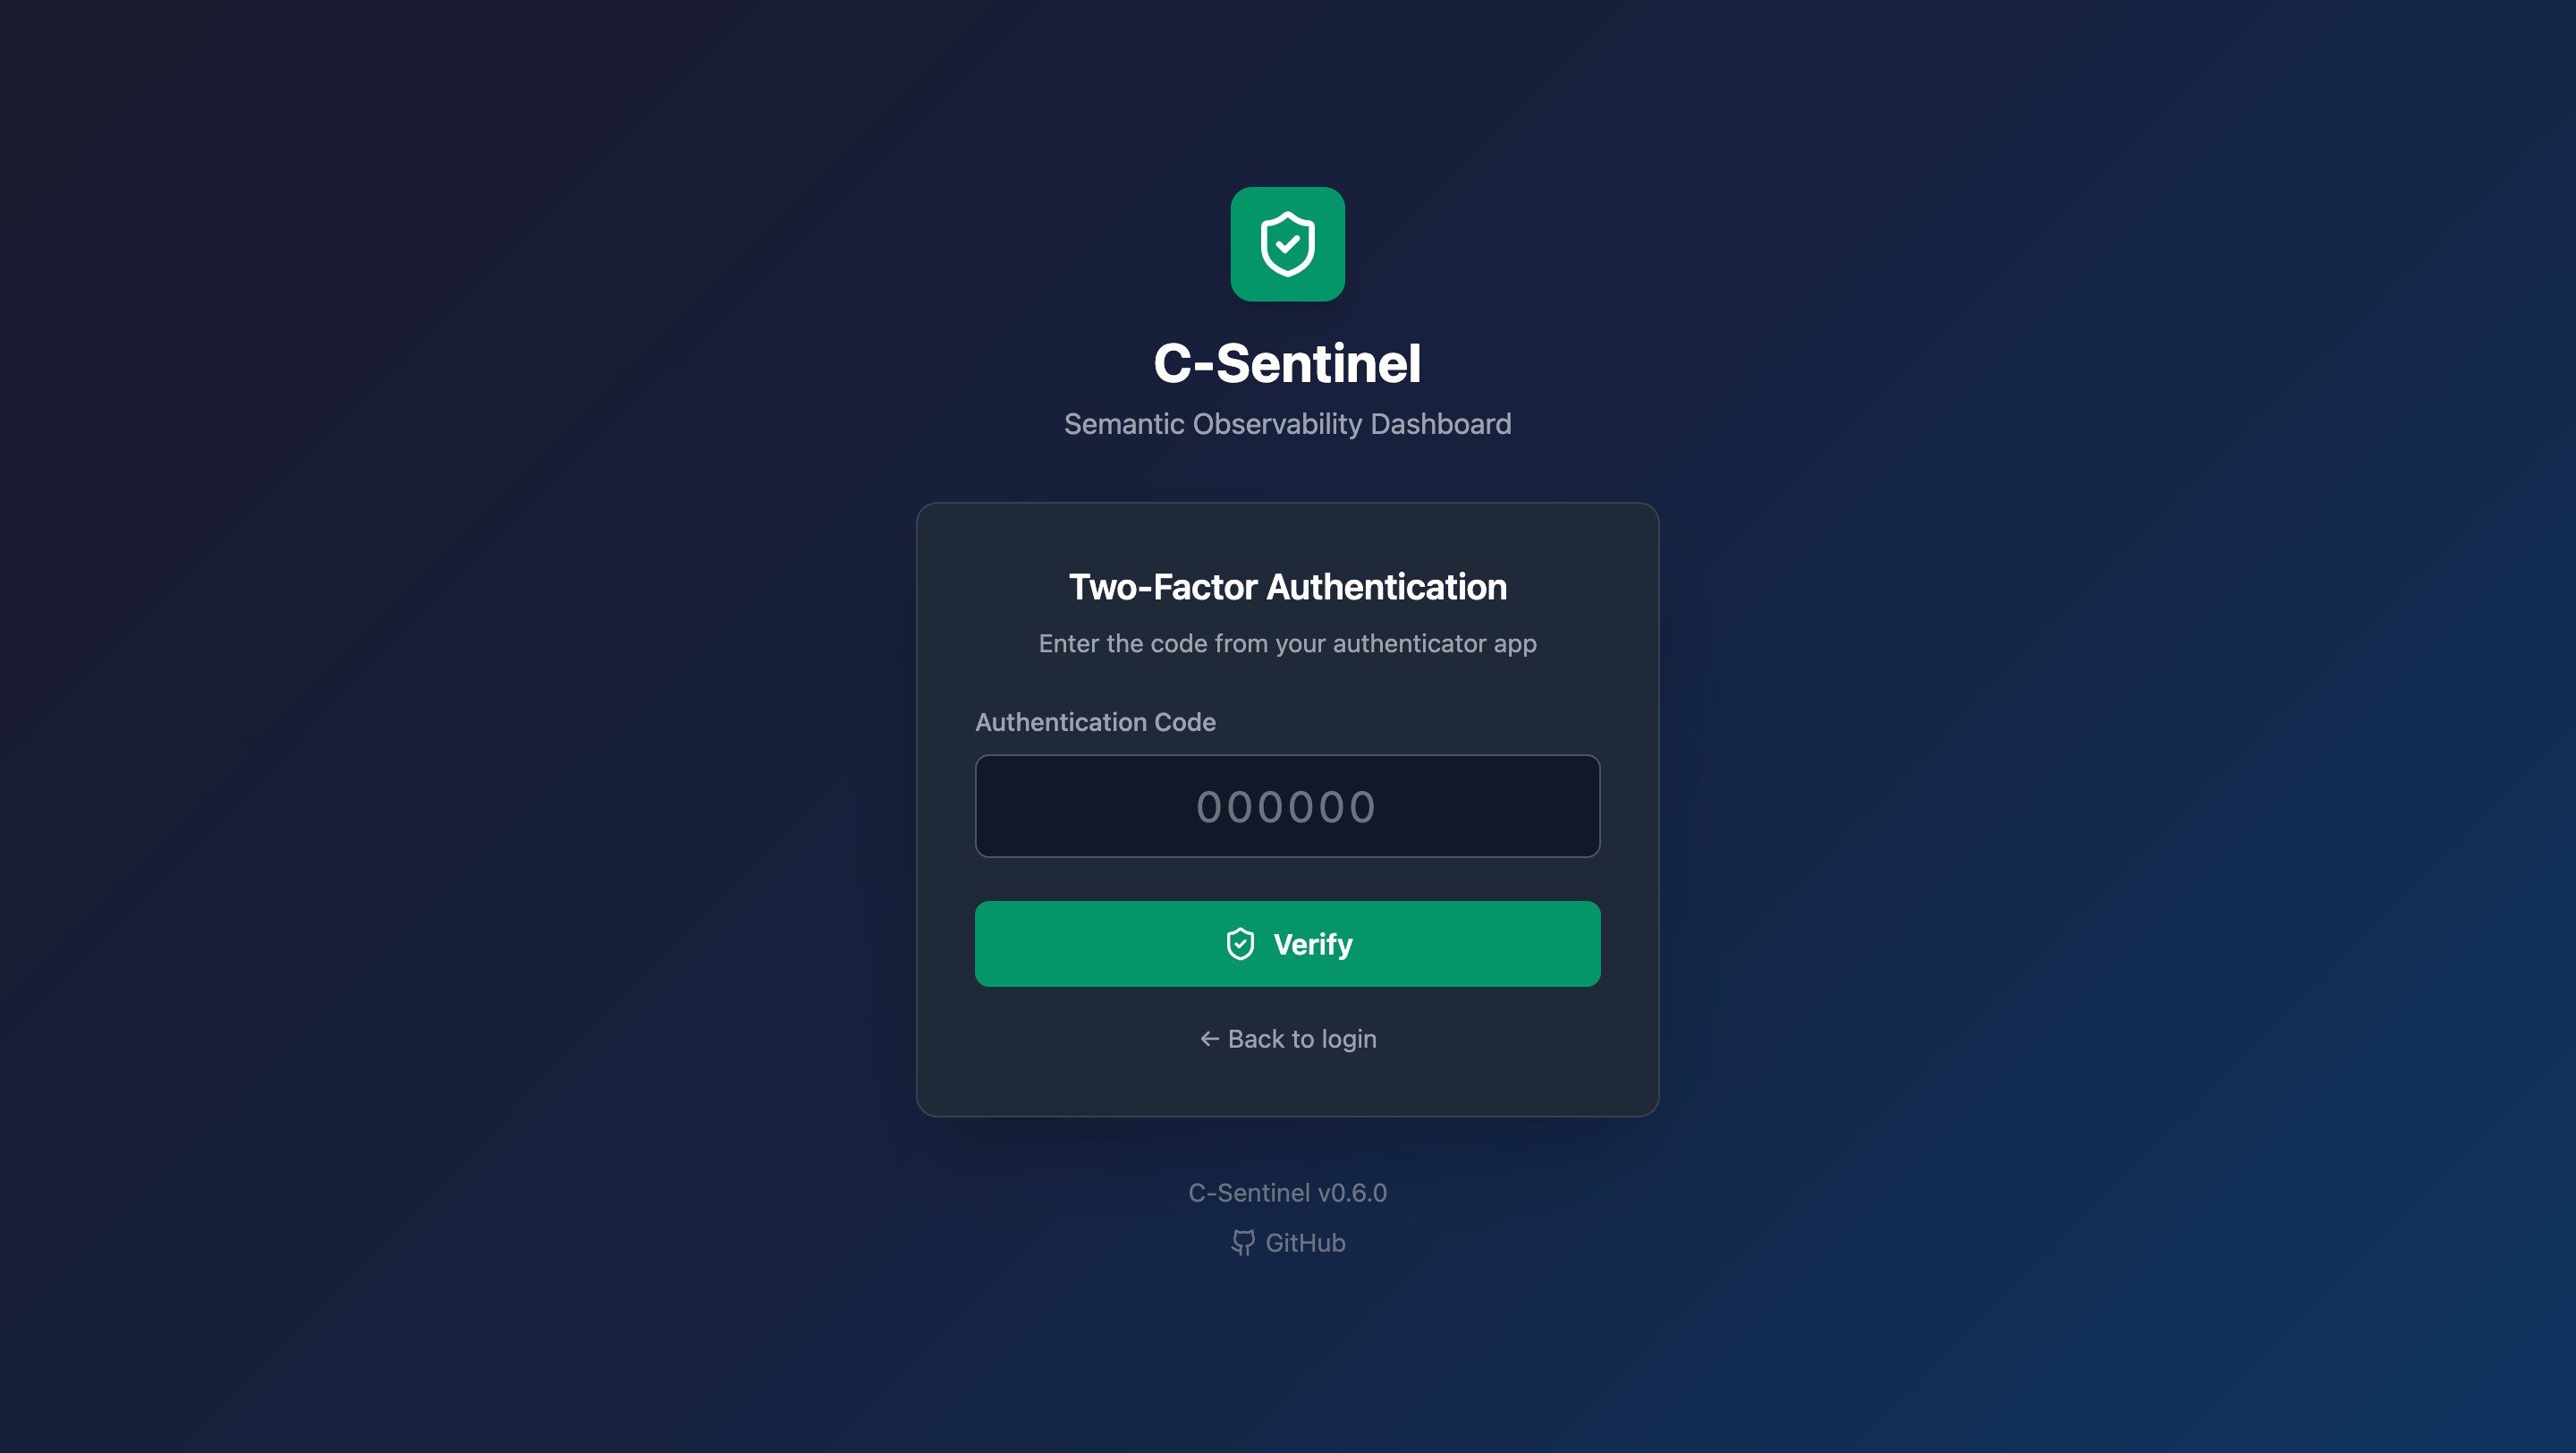
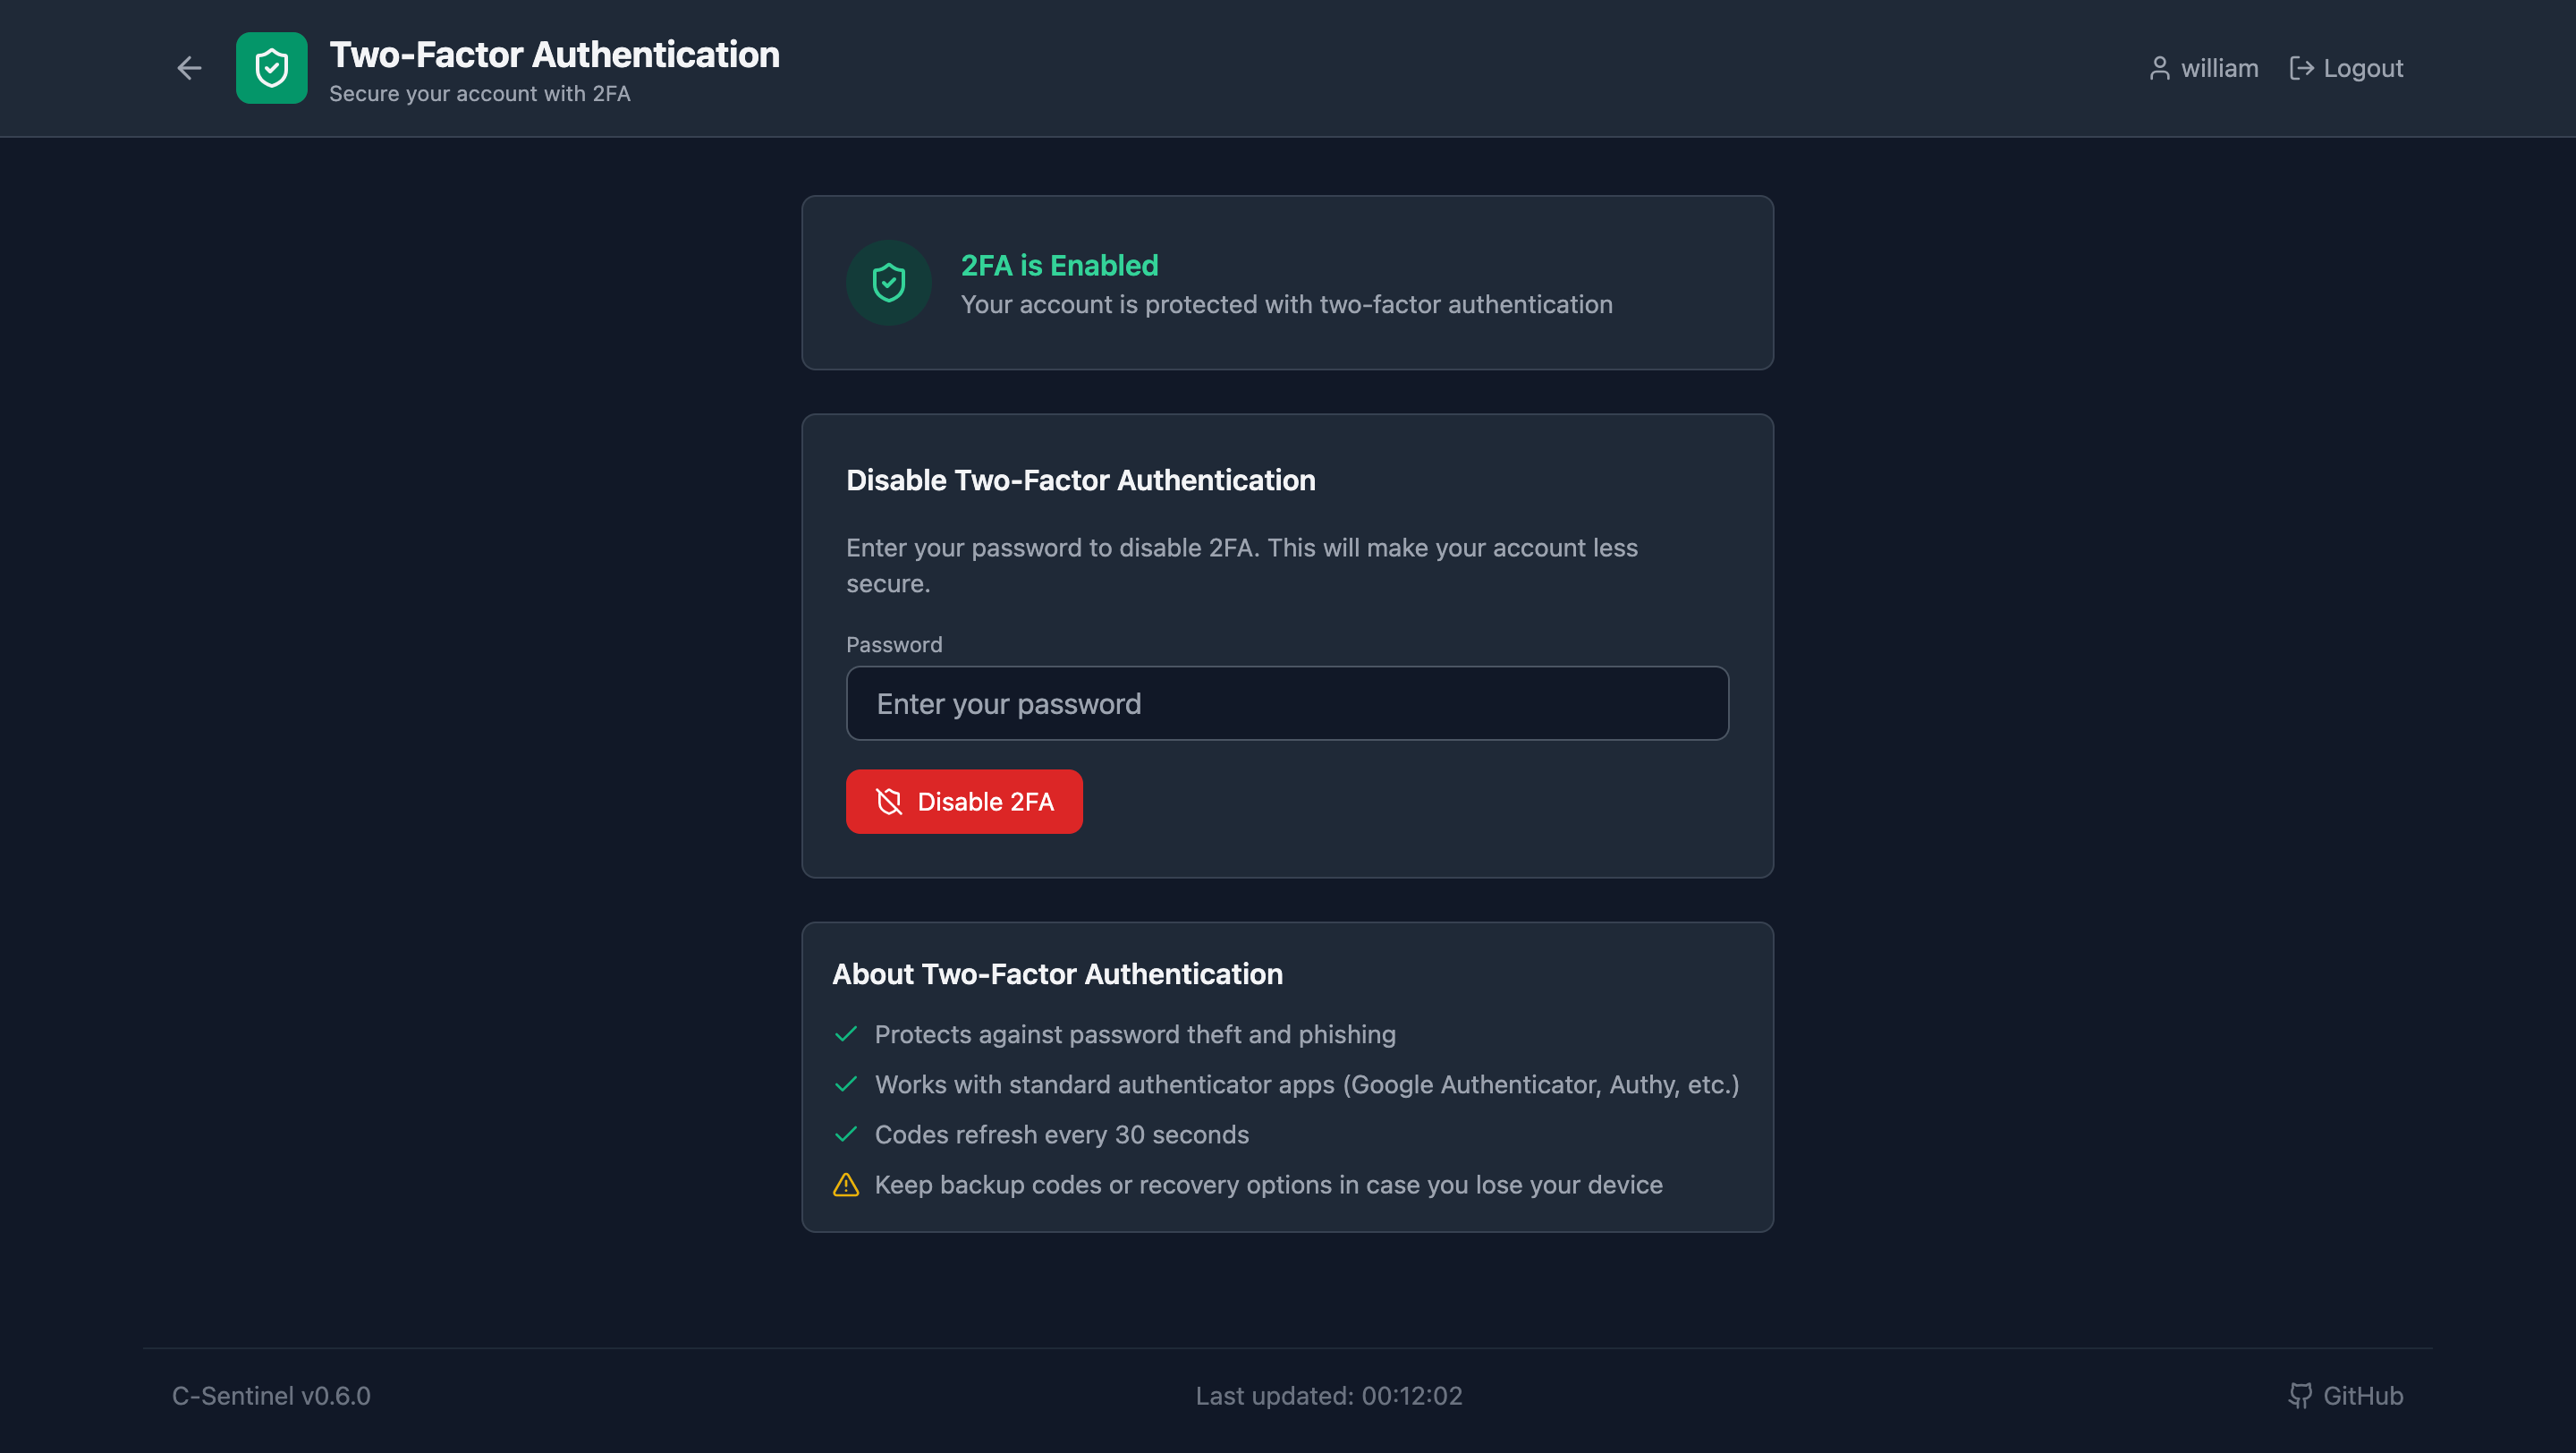
Secure your account with industry-standard TOTP:
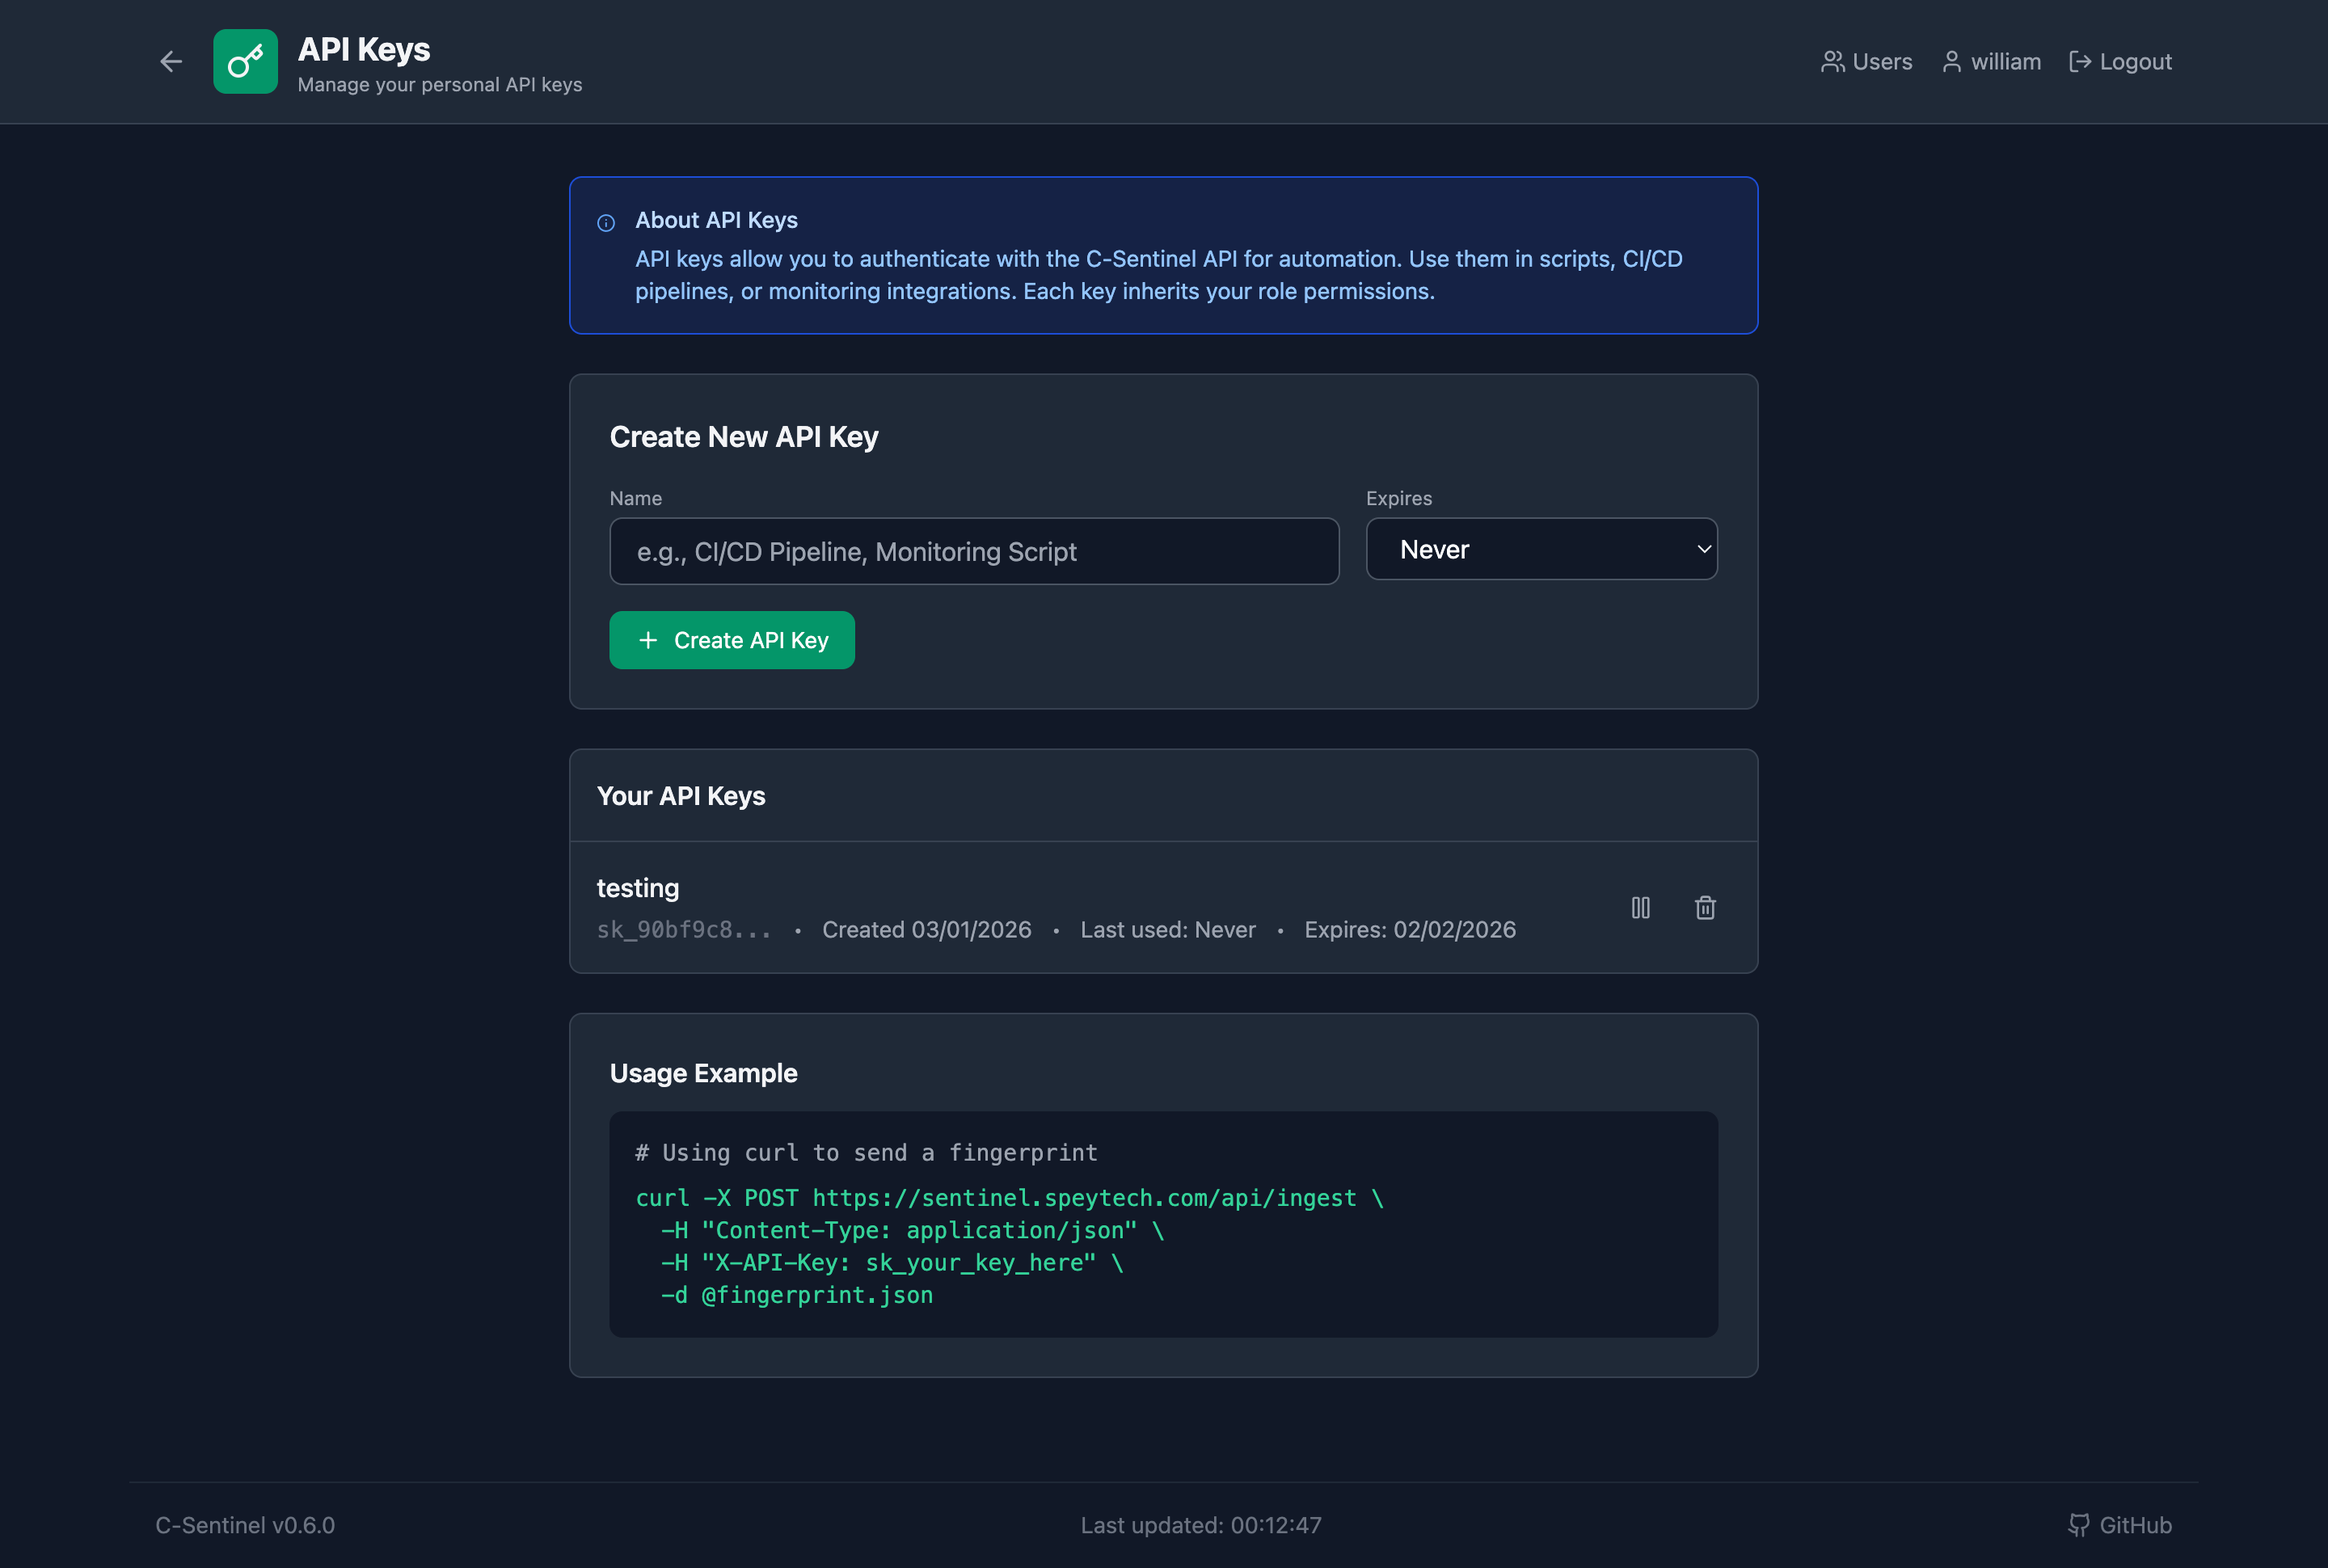
Each user can create their own API keys for automation:
# Use your personal API key
curl -X POST https://sentinel.example.com/api/ingest \
-H "Content-Type: application/json" \
-H "X-API-Key: sk_your_personal_key" \
-d @fingerprint.json
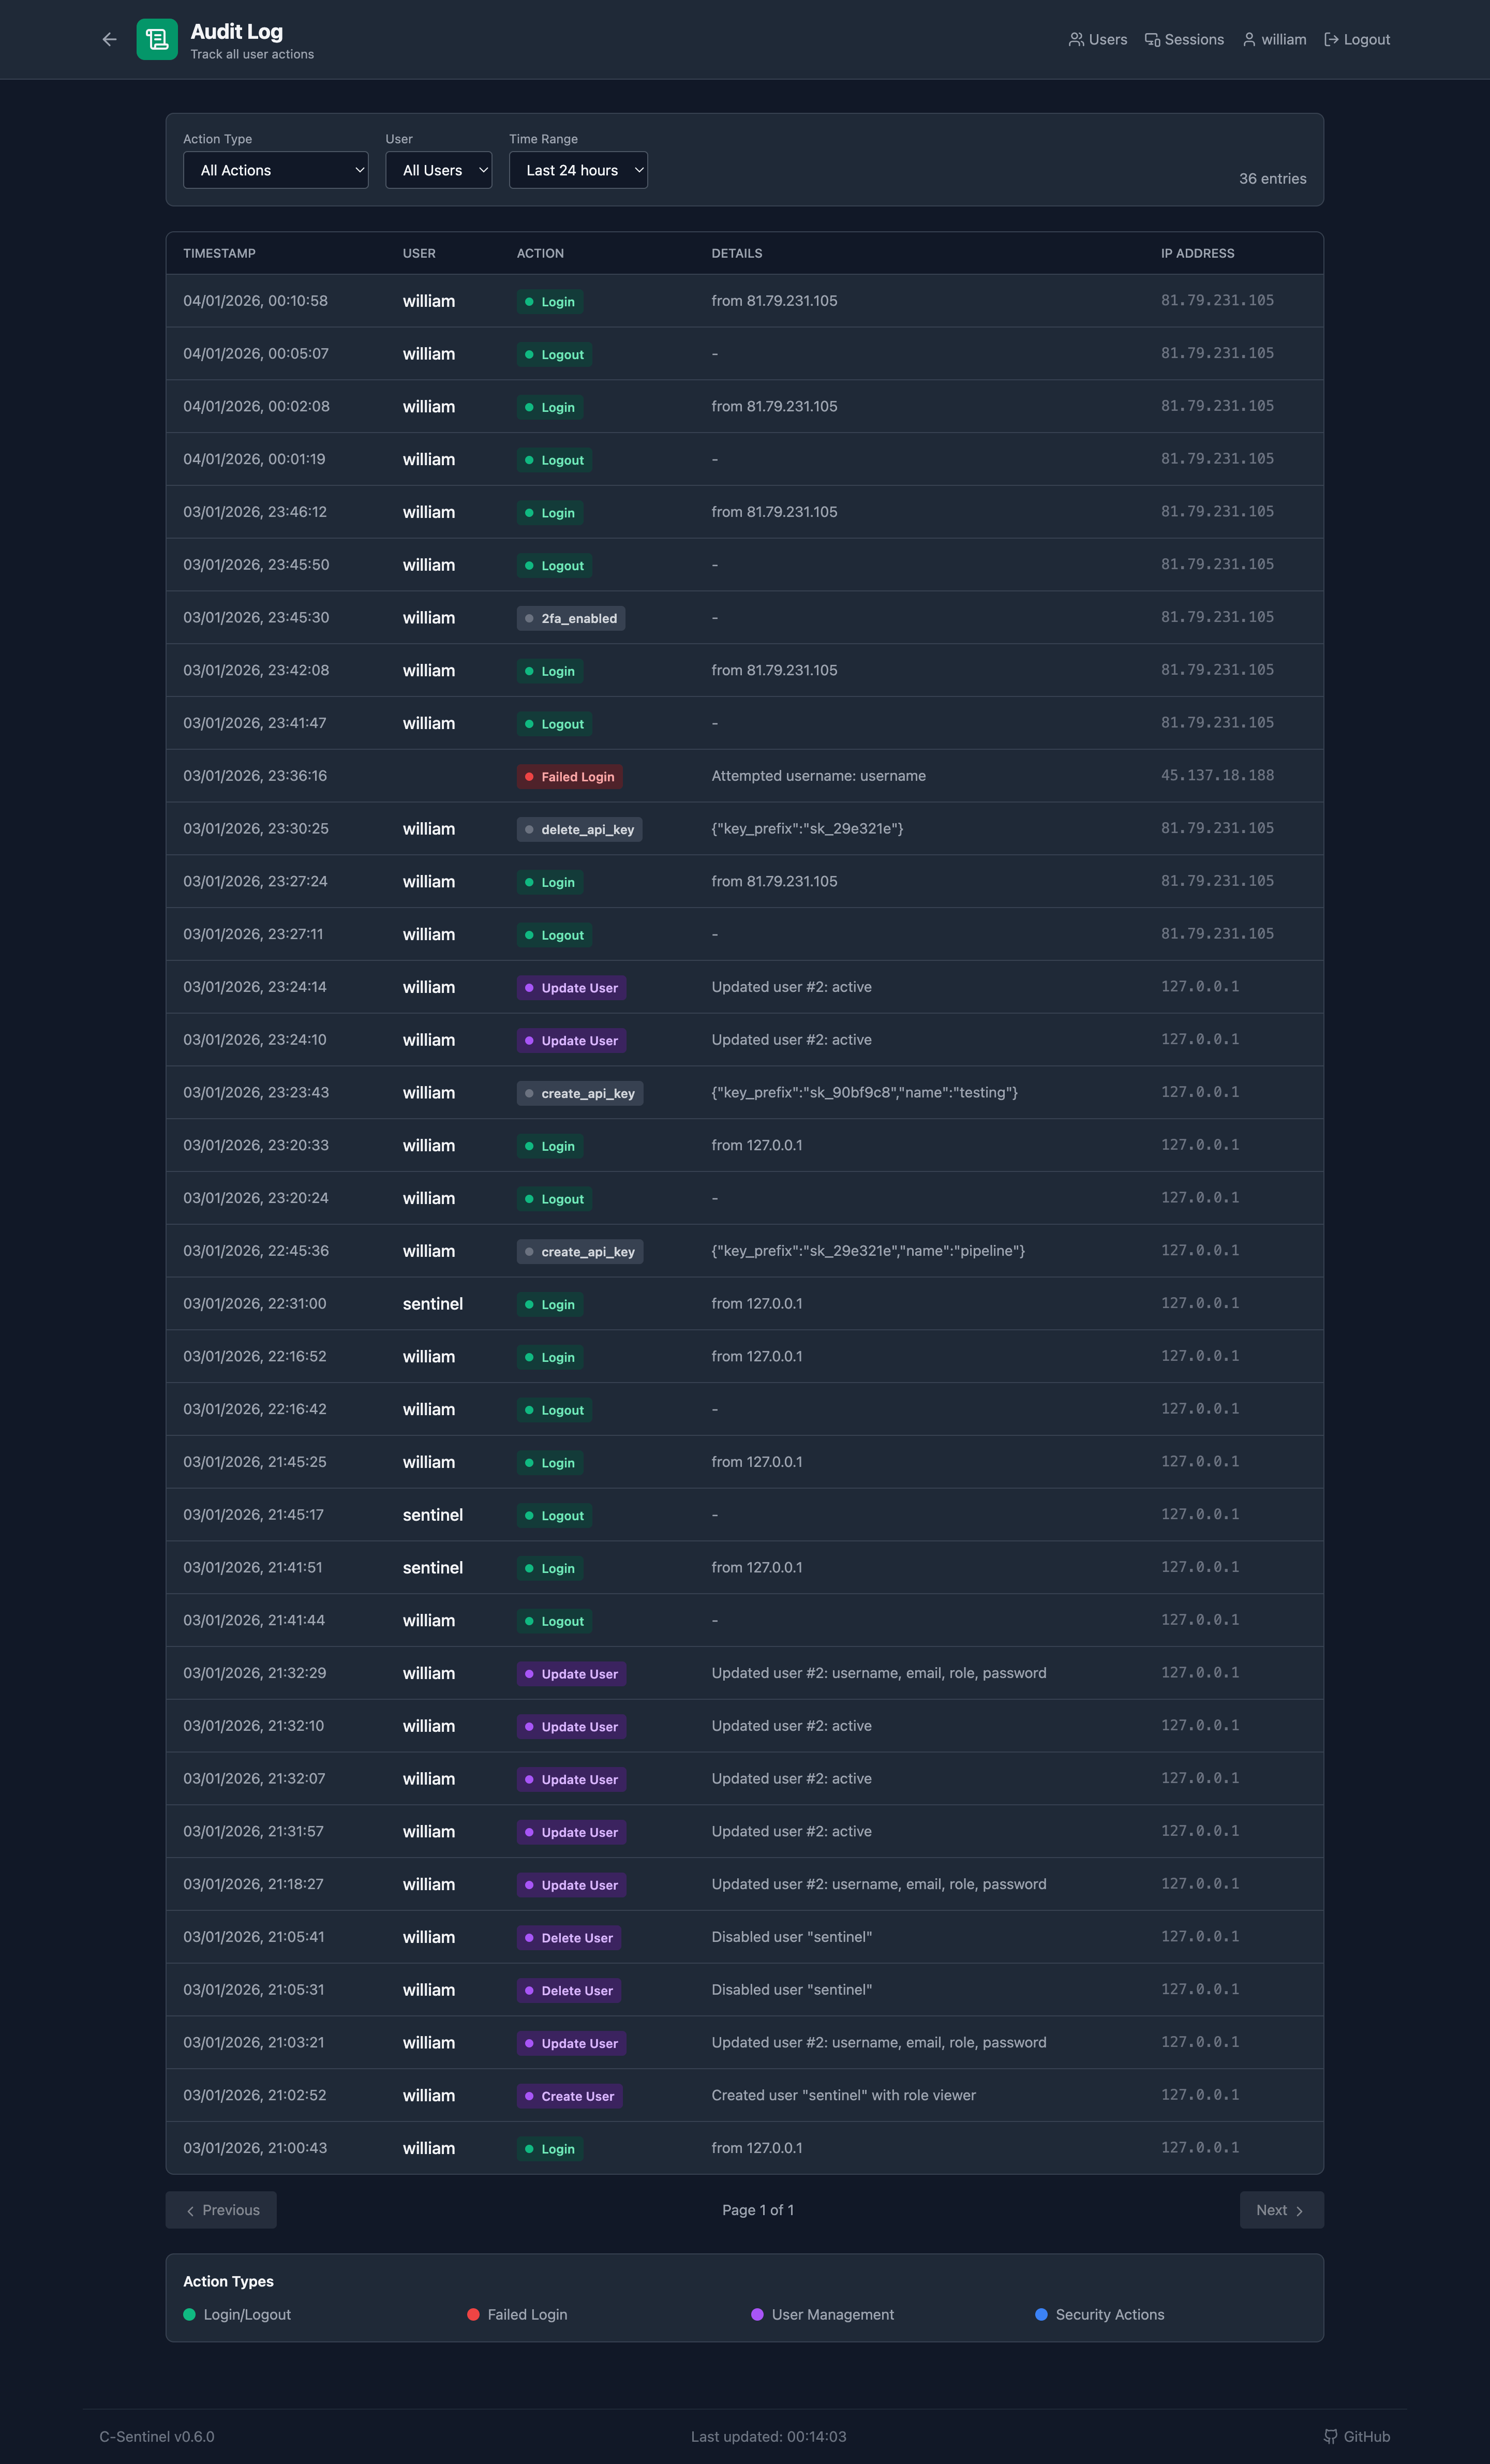
Track all user actions for compliance and security:
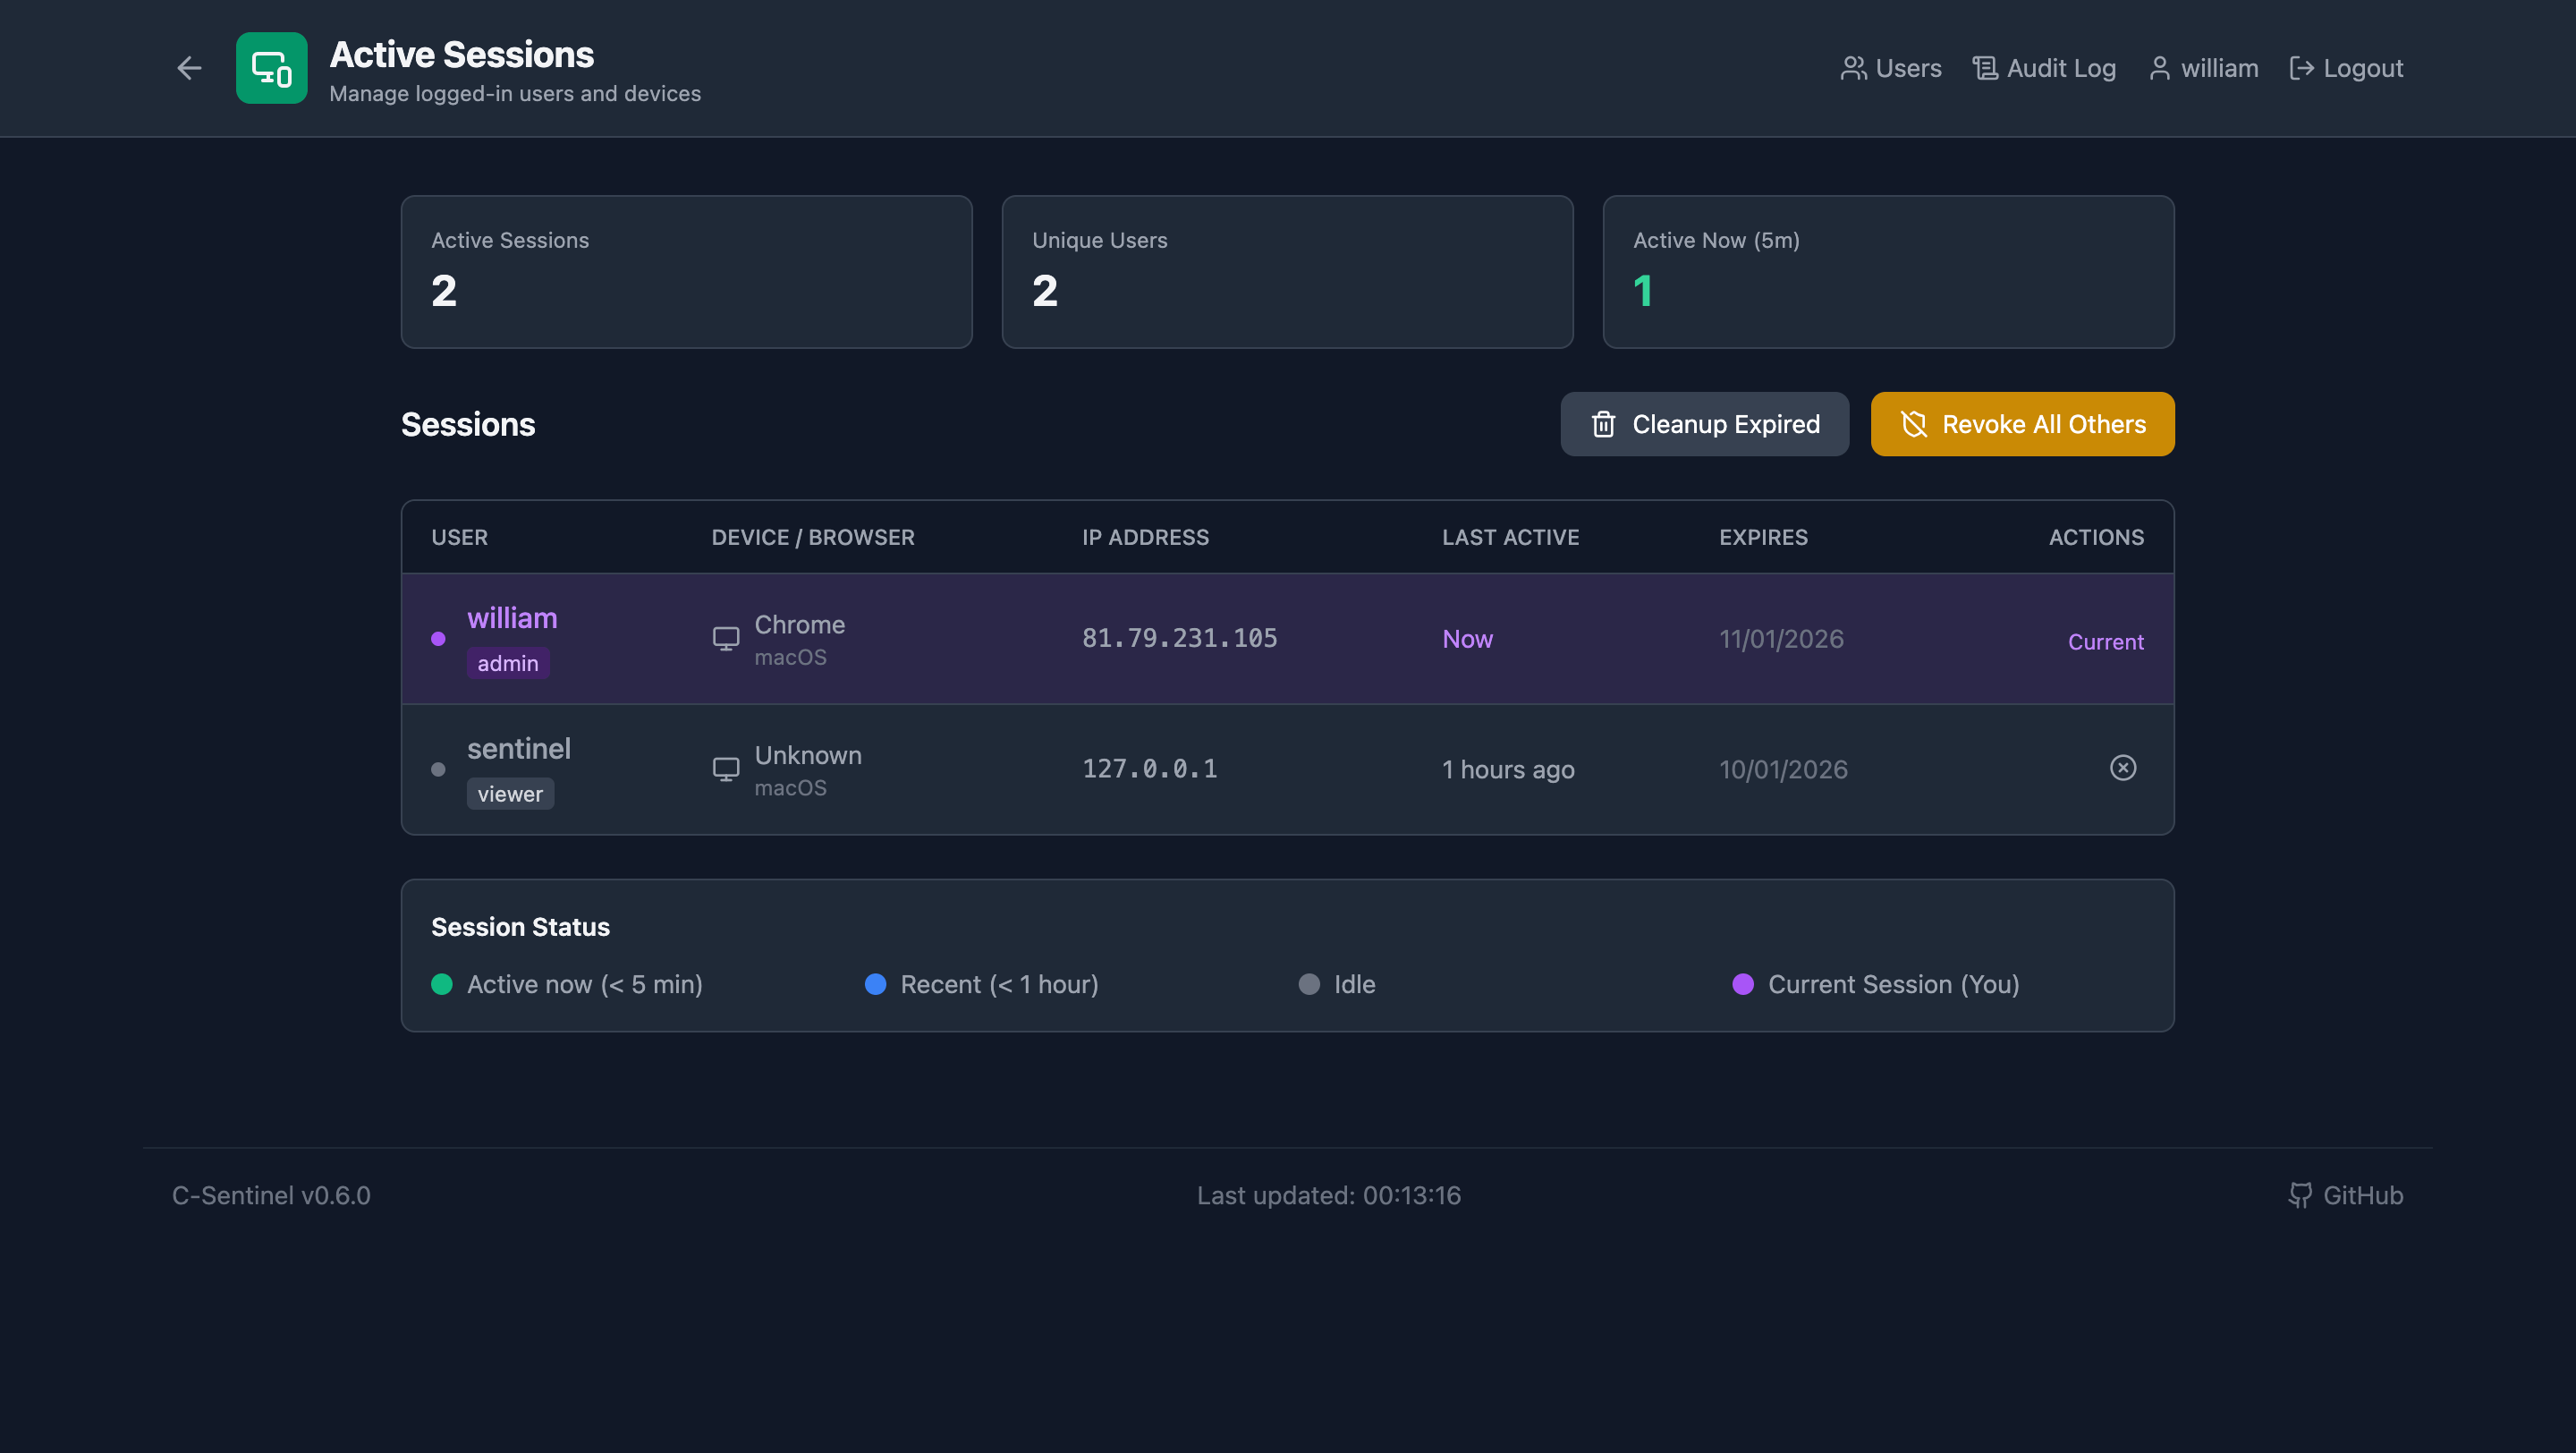
Full visibility into active sessions:
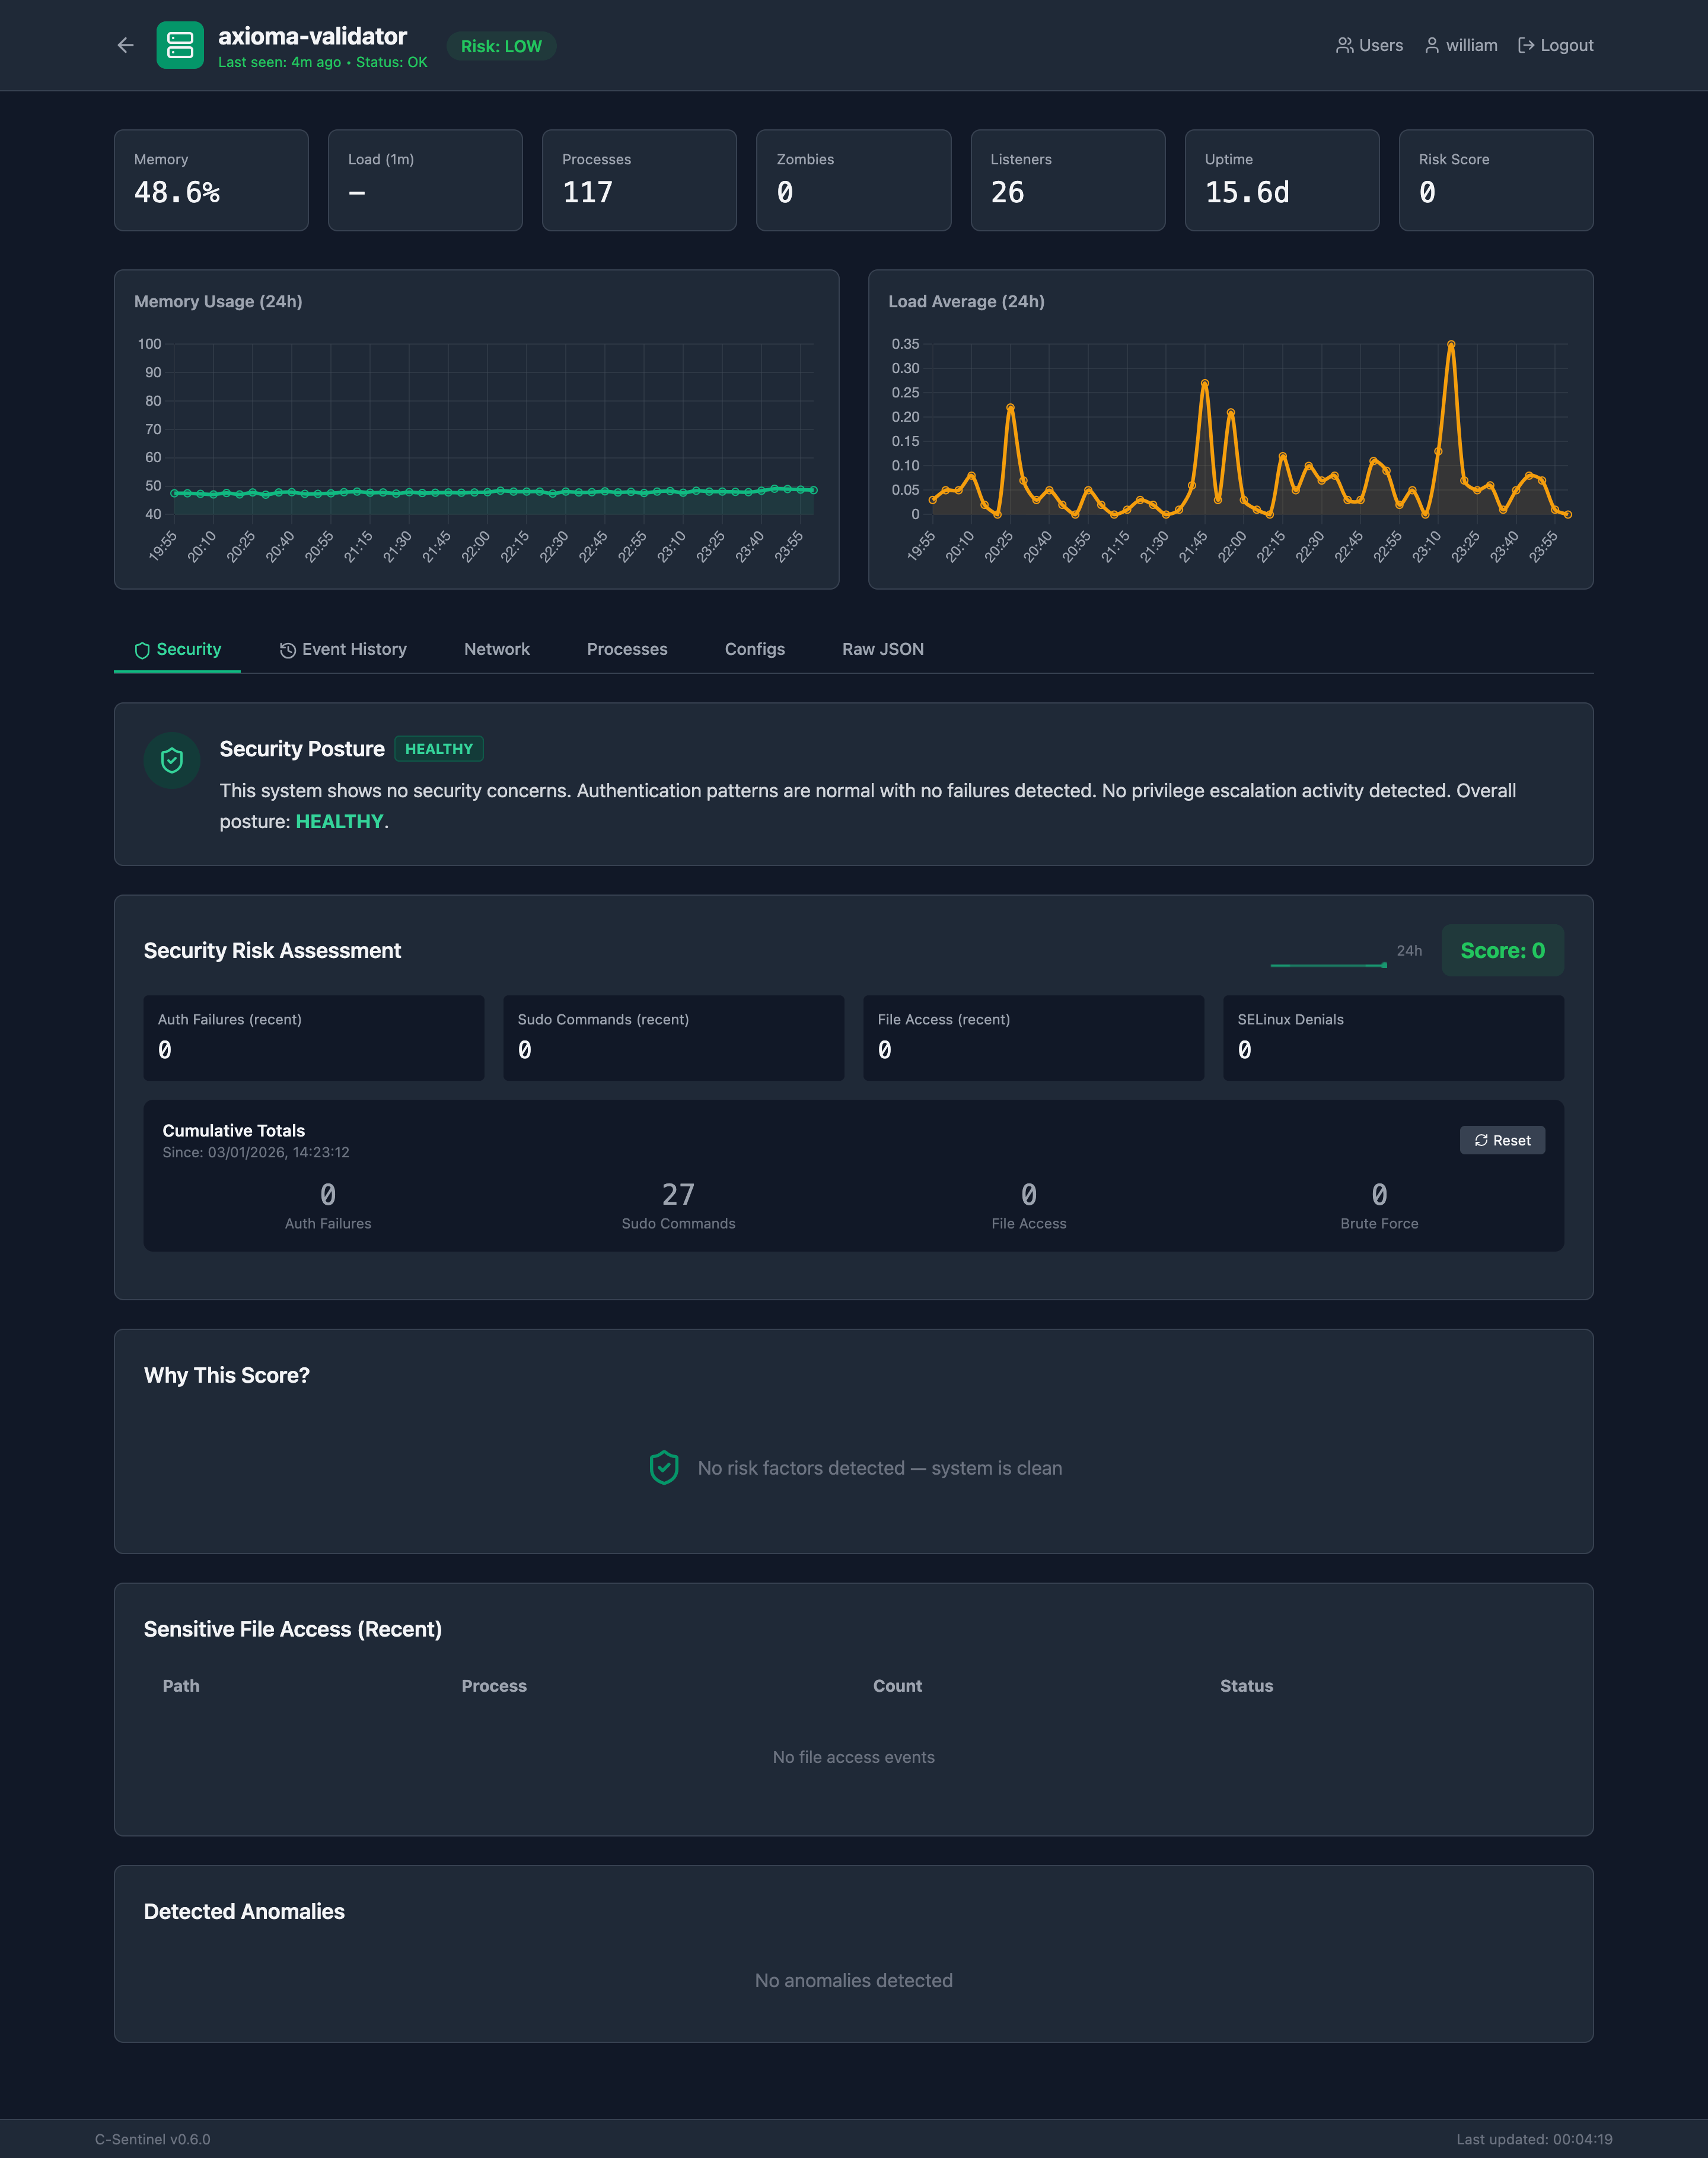
Plain English explanation of your system's security status:
"This system shows no security concerns. Authentication patterns are normal with no failures detected. No privilege escalation activity detected. Overall posture: HEALTHY."
Every risk score includes factors that explain why:
| Factor | Weight |
|---|---|
| 10 authentication failures (200% above baseline - high) | +30 |
| Brute force attack pattern detected | +10 |
| 2 sensitive file(s) accessed | +4 |
| Total | 44 |
The system learns what's "normal" for your environment:
| Samples | Status | Meaning |
|---|---|---|
| < 10 | 🧠 Learning | Building initial baseline |
| 10-50 | 🧠 Calibrating | Refining normal patterns |
| > 50 | (hidden) | Fully calibrated |
A mini chart showing 24-hour risk score history - instantly see if things are getting better or worse.
Automatic notifications via email and/or Slack when:
Slack alerts include rich formatting with colour-coded severity, clickable dashboard links, and structured risk factor details.
C-Sentinel summarises auditd logs for semantic security analysis.
C-Sentinel Quick Analysis
========================
Hostname: axioma-validator
Uptime: 14.5 days
Load: 0.02 0.04 0.00
Memory: 49.2% used
Processes: 120 total
Potential Issues:
Zombie processes: 0
High FD processes: 1
Long-running (>7d): 95
Config permission issues: 0
Network:
Listening ports: 26
Established connections: 14
Unusual ports: 12 ⚠
Security (audit):
Auth failures: 6
⚠ BRUTE FORCE PATTERN DETECTED
Sudo commands: 81
Sensitive file access: 2
- /etc/passwd by touch
- /etc/shadow by touch ⚠
Risk: high (score: 25)
{
"audit_summary": {
"enabled": true,
"period_seconds": 300,
"authentication": {
"failures": 6,
"failure_users_hashed": ["user_c4c5", "user_b91b"],
"brute_force_detected": true
},
"privilege_escalation": {
"sudo_count": 81,
"sudo_baseline_avg": 12.5,
"sudo_deviation_pct": 548.0,
"su_count": 5
},
"file_integrity": {
"sensitive_file_access": [
{
"path": "/etc/shadow",
"access": "write",
"count": 2,
"process": "touch",
"process_chain": ["touch", "bash", "sshd"],
"suspicious": true
}
]
},
"learning": {
"sample_count": 42,
"confidence": "medium"
},
"risk_factors": [
{"reason": "6 auth failures (200% above baseline - high)", "weight": 18},
{"reason": "Brute force attack pattern detected", "weight": 10}
],
"risk_score": 25,
"risk_level": "high"
}
}
For best results, add audit rules for sensitive files:
# Add audit rules
sudo auditctl -w /etc/passwd -p wa -k identity
sudo auditctl -w /etc/shadow -p wa -k identity
sudo auditctl -w /etc/sudoers -p wa -k priv_esc
sudo auditctl -w /var/log/lastlog -p wa -k auth
# Make permanent (add to /etc/audit/rules.d/sentinel.rules)
user_c4c5) preserving pattern detection without exposing identitiesC-Sentinel includes a web dashboard for monitoring multiple hosts in real-time.
# Install dashboard
cd dashboard
sudo ./install-dashboard.sh
# Run database migration
sudo -u postgres psql -d sentinel -f migrate.sql
# Install 2FA dependencies (optional)
sudo /opt/sentinel-dashboard/venv/bin/pip install pyotp qrcode pillow
# Configure agent to report (with audit)
*/5 * * * * sudo /usr/local/bin/sentinel --json --network --audit | curl -s -X POST \
-H "Content-Type: application/json" \
-H "X-API-Key: YOUR_KEY" \
-d @- https://your-dashboard.com/api/ingest
Add to your systemd service or environment:
ALERT_EMAIL_ENABLED=true
ALERT_SMTP_HOST=smtp.gmail.com
ALERT_SMTP_PORT=587
[email protected]
ALERT_SMTP_PASS=your-app-password
[email protected]
[email protected]
ALERT_COOLDOWN_MINS=60
ALERT_SLACK_ENABLED=true
ALERT_SLACK_WEBHOOK=https://hooks.slack.com/services/T00000000/B00000000/XXXXXXXXXXXXXXXXXXXXXXXX
ALERT_SLACK_CHANNEL=#security-alerts # Optional - override default webhook channel
ALERT_SLACK_USERNAME=C-Sentinel # Optional - bot display name
To get a webhook URL:
See dashboard/README.md for full setup instructions.
Enable read-only public access for showcasing your dashboard:
Environment="DEMO_MODE=true"
In demo mode:
Great for LinkedIn posts, blog articles, or letting prospects explore before deploying.
For production deployment:
# Install
sudo ./install.sh
# Enable and start
sudo systemctl enable sentinel
sudo systemctl start sentinel
# Check status
sudo journalctl -u sentinel -f
| Feature | Command | Description |
|---|---|---|
| Quick analysis | --quick | Human-readable summary |
| Network probe | --network | Listening ports & connections |
| Audit probe | --audit | Security events (requires root) |
| Watch mode | --watch --interval 60 | Continuous monitoring |
| Baseline learn | --learn | Save current state as "normal" |
| Audit baseline | --audit-learn | Learn normal security patterns |
| Baseline compare | --baseline | Detect deviations |
| JSON output | --json | Full fingerprint for LLM/dashboard |
| Colour output | --color | Coloured terminal output |
| Config | --config | Show current settings |
Colour output is auto-detected (TTY) and respects the NO_COLOR standard.
| Code | Meaning |
|---|---|
| 0 | No issues detected |
| 1 | Warnings (minor issues) |
| 2 | Critical (zombies, permission issues, unusual ports, high-risk security events) |
| 3 | Error (probe failed) |
| Category | Data | Purpose |
|---|---|---|
| System | Hostname, kernel, uptime, load, memory | Basic health context |
| Processes | Notable processes with metadata | Zombie, leak, stuck detection |
| Configs | File metadata + SHA256 checksums | Cryptographic drift detection |
| Network | Listeners, connections, ports | Service monitoring |
| Security | Auth failures, sudo usage, file access | Threat detection |
┌─────────────────────────────────────────────────────────────────┐
│ Web Dashboard │
│ • Multi-user auth (RBAC) • Two-factor authentication │
│ • Personal API keys • Session management │
│ • Admin audit log • Email & Slack alerts │
│ • Security posture summary • Risk trend sparkline │
│ • Explainable risk factors • Event history timeline │
│ • Multi-host view • Historical charts │
└─────────────────────────────────────────────────────────────────┘
▲
│ JSON via HTTP POST
│
┌─────────────────────────────────────────────────────────────────┐
│ C Foundation (99KB) │
│ • /proc parsing • SHA256 checksums │
│ • Process analysis • Drift detection │
│ • Network probing • Baseline learning │
│ • Auditd parsing • Risk scoring │
│ • Process chains • Anomaly detection │
└─────────────────────────────────────────────────────────────────┘
| Concern | Python | C |
|---|---|---|
| Dependencies | Requires Python runtime (~100MB) | Static binary (~99KB) |
| Startup time | ~500ms interpreter startup | ~1ms |
| Memory | ~30MB baseline | <2MB |
| Portability | Needs matching Python version | Runs on any POSIX system |
make # Release build
make DEBUG=1 # Debug build with symbols
make test # Run all tests (unit + integration)
make install # Install to /usr/local/bin
C-Sentinel includes a comprehensive test suite with 128+ unit tests using the cmocka testing framework.
Debian/Ubuntu:
sudo apt-get install libcmocka-dev
Fedora/RHEL/CentOS:
sudo dnf install libcmocka-devel
macOS (Homebrew):
brew install cmocka
FreeBSD:
sudo pkg install cmocka
OpenBSD:
doas pkg_add cmocka
make test # Run all tests (unit + integration)
make unit-test # Run unit tests only (requires cmocka)
make integration-test # Run integration/smoke tests only
make coverage # Run tests with gcov coverage report
make check-cmocka # Verify cmocka is installed correctly
The unit tests cover:
| Module | Tests | Coverage |
|---|---|---|
| SHA256 | 10 | NIST test vectors, edge cases |
| Sanitize | 30 | Input validation, injection prevention |
| Policy | 36 | Command/path allow/deny rules |
| JSON Serialize | 11 | Output formatting, escaping |
| Baseline | 11 | Learning mode, deviation detection |
| Config | 9 | Configuration parsing |
| Audit | 21 | Risk scoring, event analysis |
Tests are located in tests/src/ and use cmocka conventions:
#include <stdarg.h>
#include <stddef.h>
#include <setjmp.h>
#include <cmocka.h>
#include "test_helpers.h"
static void test_example(void **state) {
(void)state;
assert_int_equal(1 + 1, 2);
}
int main(void) {
const struct CMUnitTest tests[] = {
cmocka_unit_test(test_example),
};
return cmocka_run_group_tests(tests, NULL, NULL);
}
Add new test files to the Makefile's TEST_SOURCES variable.
| Platform | Build | Process Probe | Network Probe | Audit |
|---|---|---|---|---|
| Linux | ✅ | ✅ /proc | ✅ /proc/net | ✅ auditd |
| macOS | ✅ | ✅ libproc | ✅ netstat | ❌ N/A |
| FreeBSD | ✅ | ✅ libkvm | ✅ netstat | ❌ N/A |
| OpenBSD | ✅ | ✅ libkvm | ✅ netstat | ❌ N/A |
| NetBSD | ✅ | ✅ libkvm | ✅ netstat | ❌ N/A |
| DragonFlyBSD | ✅ | ✅ libkvm | ✅ netstat | ❌ N/A |
--audit flag)c-sentinel/
├── include/
│ ├── sentinel.h # Core data structures
│ └── audit.h # Audit integration types
├── src/
│ ├── main.c # CLI entry point
│ ├── prober.c # System probing (/proc)
│ ├── net_probe.c # Network probing
│ ├── audit.c # Auditd log parsing
│ ├── audit_json.c # Audit JSON serialisation
│ ├── process_chain.c # Process ancestry walking
│ ├── baseline.c # Baseline learning
│ ├── sha256.c # Pure C SHA256
│ └── ...
├── dashboard/ # Flask web dashboard
├── deploy/ # Systemd service files
└── docs/
├── AUDIT_SPEC.md # Audit integration design
└── DESIGN_DECISIONS.md
MIT License - see LICENSE for details.
William Murray - 30 years UNIX systems engineering
"The goal isn't to replace monitoring tools—it's to add wisdom to their data."