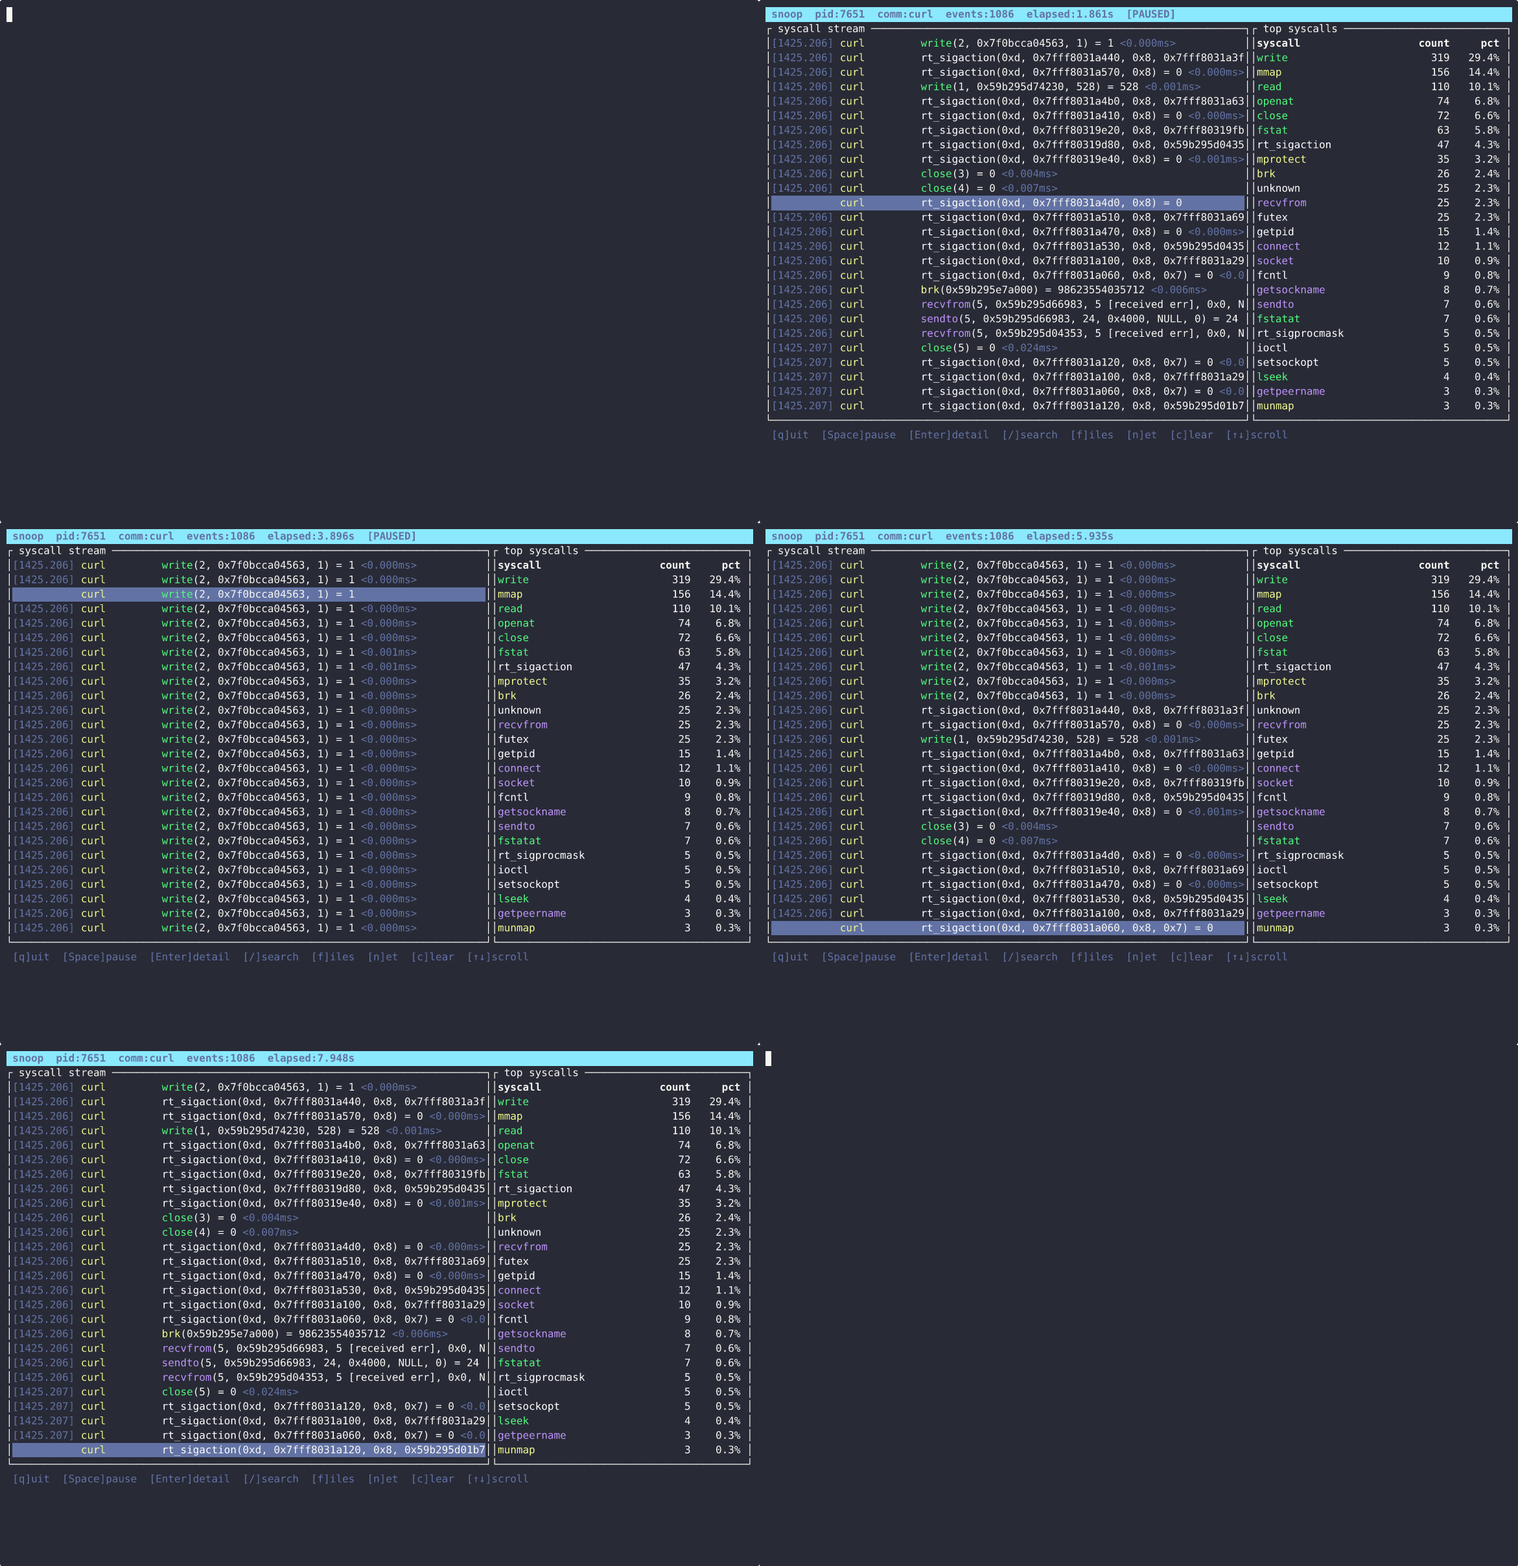

A modern syscall tracer built on eBPF. Think strace, but with a real TUI, smart filters, TLS decryption, and output that's actually readable.


A syscall tracer for Linux, built on eBPF. Like strace but with a live TUI, smart filters, and argument decoding you can actually read.
$ sudo snoop curl https://example.com
[   0.001] curl(1234/1234)  openat(AT_FDCWD, "/etc/ssl/certs/ca-certificates.crt", O_RDONLY) = 4  <0.031ms>
[   0.002] curl(1234/1234)  read(4, 0x7f3a1c000b20, 4096) = 4096  <0.012ms>
[   0.003] curl(1234/1234)  socket(AF_INET, SOCK_STREAM, IPPROTO_TCP) = 5  <0.008ms>
[   0.004] curl(1234/1234)  connect(5, 93.184.216.34:443) = 0  <42.187ms>
[   0.046] curl(1234/1234)  sendto(5, 0x55a3bc001b40, 78, MSG_NOSIGNAL) = 78  <0.011ms>
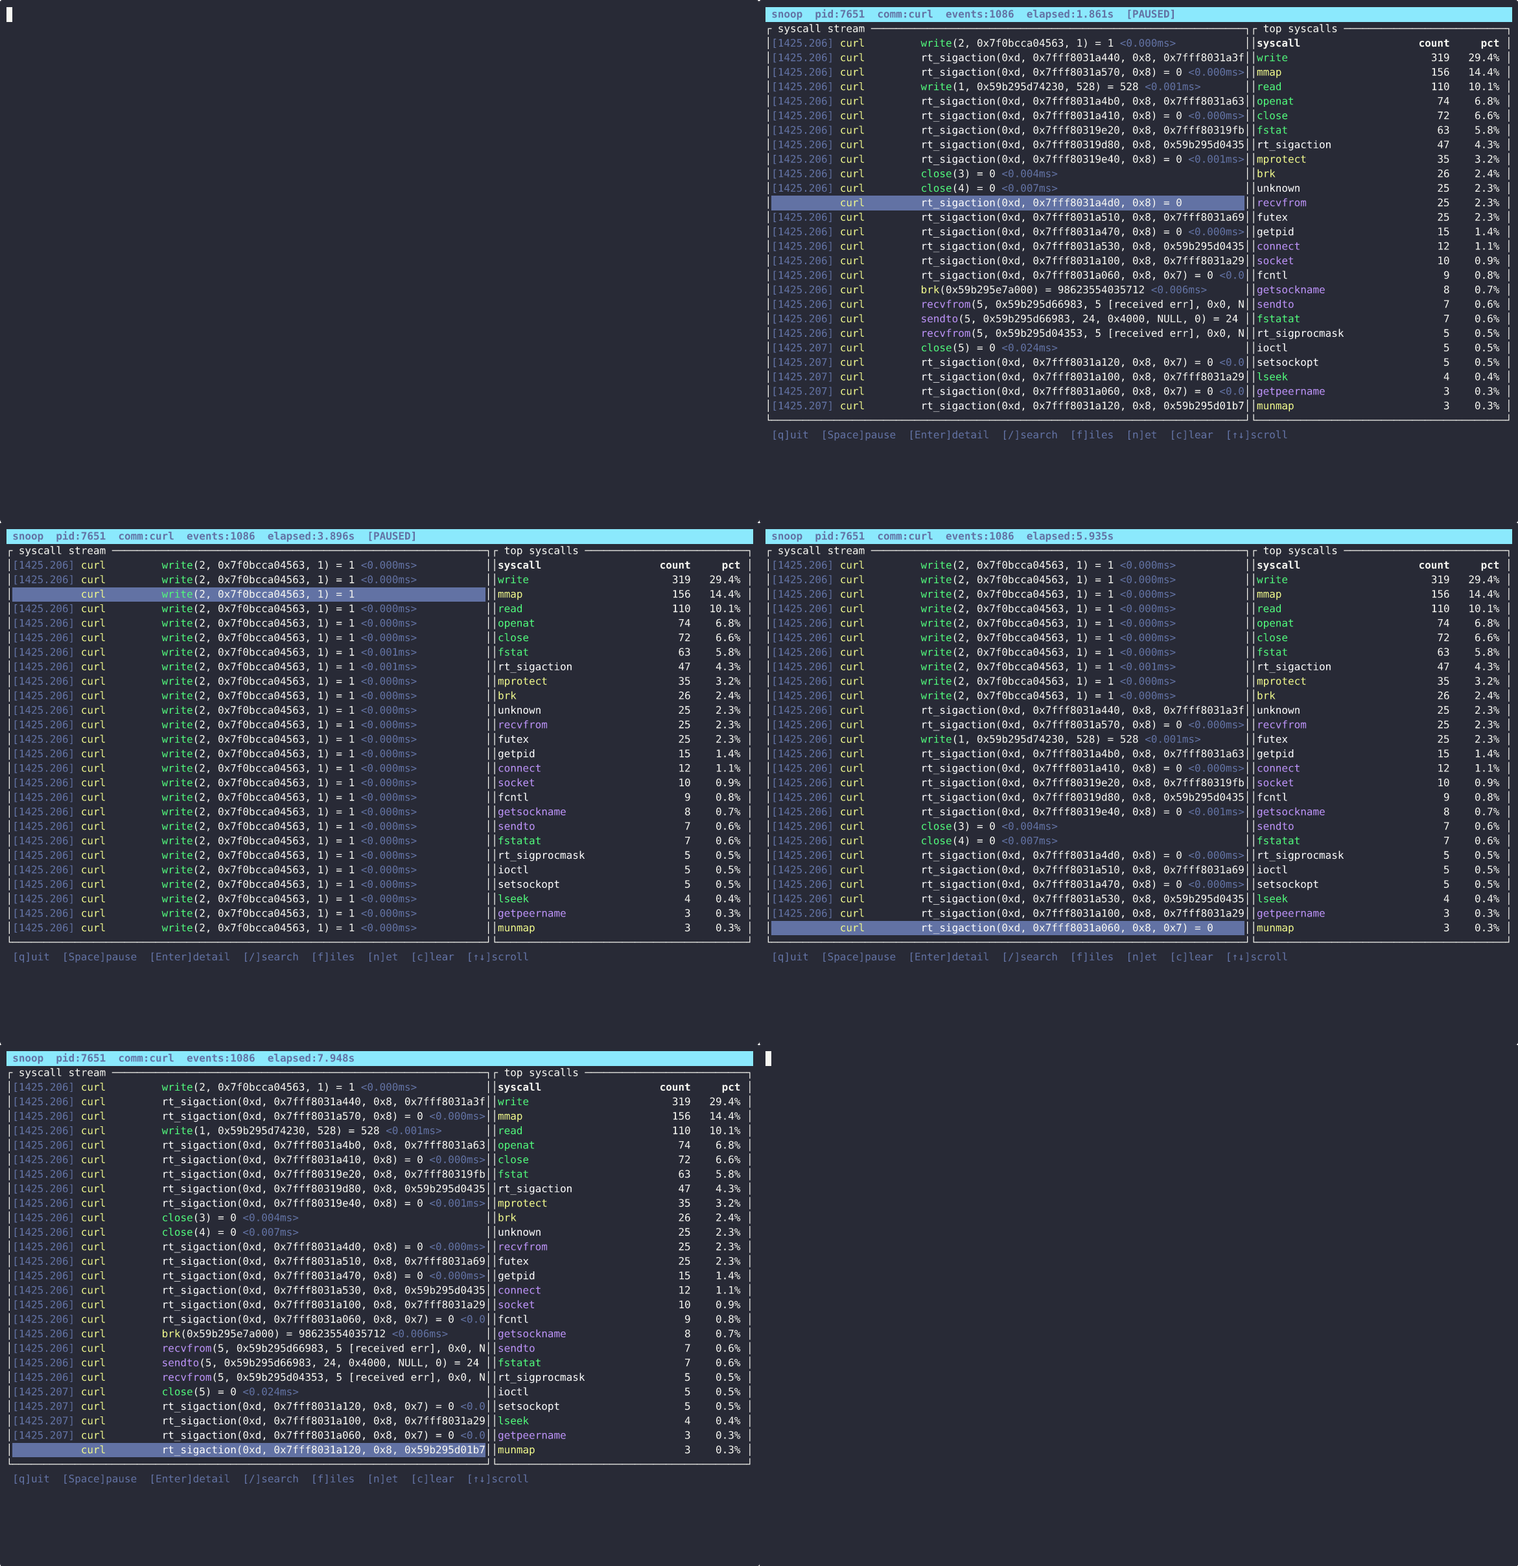
Or run it without --raw and get a full-screen TUI:
 snoop  pid:1234  comm:curl  events:142  elapsed:0.341s
┌── syscall stream ─────────────────────────────────────┐┌── top syscalls ─────────┐
│ [  0.001] curl  openat("/etc/ssl/…") = 4  <0.031ms>  ││ syscall       count  pct│
│ [  0.002] curl  read(4, …) = 4096                    ││ read            38  26.8%│
│ [  0.003] curl  socket(AF_INET, …) = 5               ││ write           21  14.8%│
│ [  0.004] curl  connect(5, 93.184.216.34:443) = 0    ││ openat          18  12.7%│
│ [  0.046] curl  sendto(5, …) = 78                    ││ mmap            14   9.9%│
└───────────────────────────────────────────────────────┘└─────────────────────────┘
 [q]uit  [Space]pause  [/]search  [f]iles  [n]et  [c]lear  [↑↓]scroll  [G]bottom
strace uses ptrace, which stops your process on every syscall. snoop uses eBPF tracepoints instead -- your process keeps running at full speed with the tracing happening in-kernel. Beyond performance, snoop decodes arguments into something you can actually read, has a real-time TUI, and can save/replay/diff traces.
--raw (strace-compatible), --json (JSON Lines for
jq), --explain (groups syscalls into high-level activity summaries)--files, --net, --slow 10, --syscall openat-p PID) or spawn one (snoop <cmd>)--follow traces forked children too--docker <name> and --pod <name> trace everything
inside a container--tls hooks SSL_write/SSL_read via uprobes to show
plaintext--ltrace tracks malloc/free/calloc/reallocsnoop record saves to disk, snoop view replays
offline (no root needed)snoop diff before.snoop after.snoop shows what changed between
two runs--flamegraph out.svgNo kernel modules, no C toolchain. The eBPF programs are pure Rust (aya) and ship embedded in the binary.
CAP_BPF + CAP_PERFMONcurl -L https://github.com/pandaadir05/snoop/releases/latest/download/snoop-x86_64-linux.tar.gz \
| tar -xz
sudo install -m755 snoop /usr/local/bin/snoop
For aarch64, replace x86_64 with aarch64.
cargo install --git https://github.com/pandaadir05/snoop snoop
This builds the eBPF programs automatically. No C toolchain or kernel headers needed, just Rust.
# Trace a command
sudo snoop ls /etc
sudo snoop -- nginx -g 'daemon off;'

# Attach to a running process
sudo snoop -p $(pidof postgres)
sudo snoop -p 1234 --follow        # trace forked children too

# Containers
sudo snoop --docker my-nginx
sudo snoop --pod my-app-pod --namespace production

# Filtering
sudo snoop -p 1234 --files         # only file-system calls
sudo snoop -p 1234 --net           # only network calls
sudo snoop -p 1234 --slow 5        # only calls slower than 5ms
sudo snoop -p 1234 --syscall openat --syscall read
--explain groups raw syscalls into high-level summaries instead of showing
every call individually:
sudo snoop -p 1234 --explain
READ   /etc/passwd          ↓1.2 KB   (2 calls, 0.80ms)
NET    127.0.0.1:5432       ↑512 B ↓4.0 KB   (18.20ms)
EXEC   /usr/bin/python3
Hooks SSL_write/SSL_read in OpenSSL to capture plaintext:
sudo snoop -p 1234 --tls
sudo snoop -p 1234 --ltrace
Record a trace, then replay it later without root:
sudo snoop record -p 1234 -o trace.snoop

snoop view trace.snoop
snoop view trace.snoop --files --slow 5 --json | jq 'select(.name=="read")'
Useful for spotting regressions after a deploy:
sudo snoop record -p 1234 -o before.snoop
# ... deploy change ...
sudo snoop record -p 1234 -o after.snoop

snoop diff before.snoop after.snoop
SYSCALL COUNTS
  read      1200 → 1800  (+50.0%)  ▲
  openat     340 →  210  (-38.2%)  ▼

DURATION REGRESSIONS (median)
  read      0.02ms → 0.08ms  (+300%)

ONLY IN after
  statx (4x)
sudo snoop -p 1234 --json | jq 'select(.name == "connect")'
sudo snoop -p 1234 --flamegraph syscalls.svg
  -p, --pid <PID>           Attach to a running process
      --follow              Trace forked children (requires --pid)
      --docker <NAME|ID>    Trace all processes in a Docker container
      --pod <POD>           Trace all processes in a Kubernetes pod
  -n, --namespace <NS>      Kubernetes namespace (default: default)

      --raw                 One-line strace-compatible output
      --json                JSON Lines — one object per syscall
      --explain             Semantic activity summaries

      --files               File-system syscalls only
      --net                 Network syscalls only
      --slow <MILLIS>       Only calls slower than threshold
      --syscall <NAME>      Only this syscall (repeatable)
      --no-decode           Raw hex arguments, no decoding

      --tls                 Capture TLS plaintext via SSL_write/SSL_read uprobes
      --ltrace              Trace malloc/free/calloc/realloc

      --flamegraph <PATH>   Write flamegraph SVG on exit
      --ebpf-obj <PATH>     Override embedded eBPF object [$SNOOP_EBPF_OBJ]
| Key | Action |
|---|---|
q | Quit |
Space | Pause / resume |
/ | Incremental search |
f | Toggle file-system filter |
n | Toggle network filter |
c | Clear event list |
Enter | Show detail popup for selected event |
↑ / k | Scroll up |
↓ / j | Scroll down |
G / End | Jump to latest event |
g / Home | Jump to oldest event |
Two eBPF programs attach to raw_syscalls/sys_enter and sys_exit. On entry,
the syscall number and arguments go into a per-thread scratch map. On exit, the
return value gets paired with the entry data and pushed to a ring buffer.
Userspace drains the ring buffer over an async fd and runs everything through
the filter/decode pipeline.

