 ngwg/ceasta
reverse engineering tool with a built-in MCP server: an AI can debug your binary, not just read it — breakpoints, stepping, memory, calling functions. disassembler + decompiler + x64dbg-style debugger in one. windows gui, linux cli.


a disassembler, decompiler and debugger in one — for windows and linux




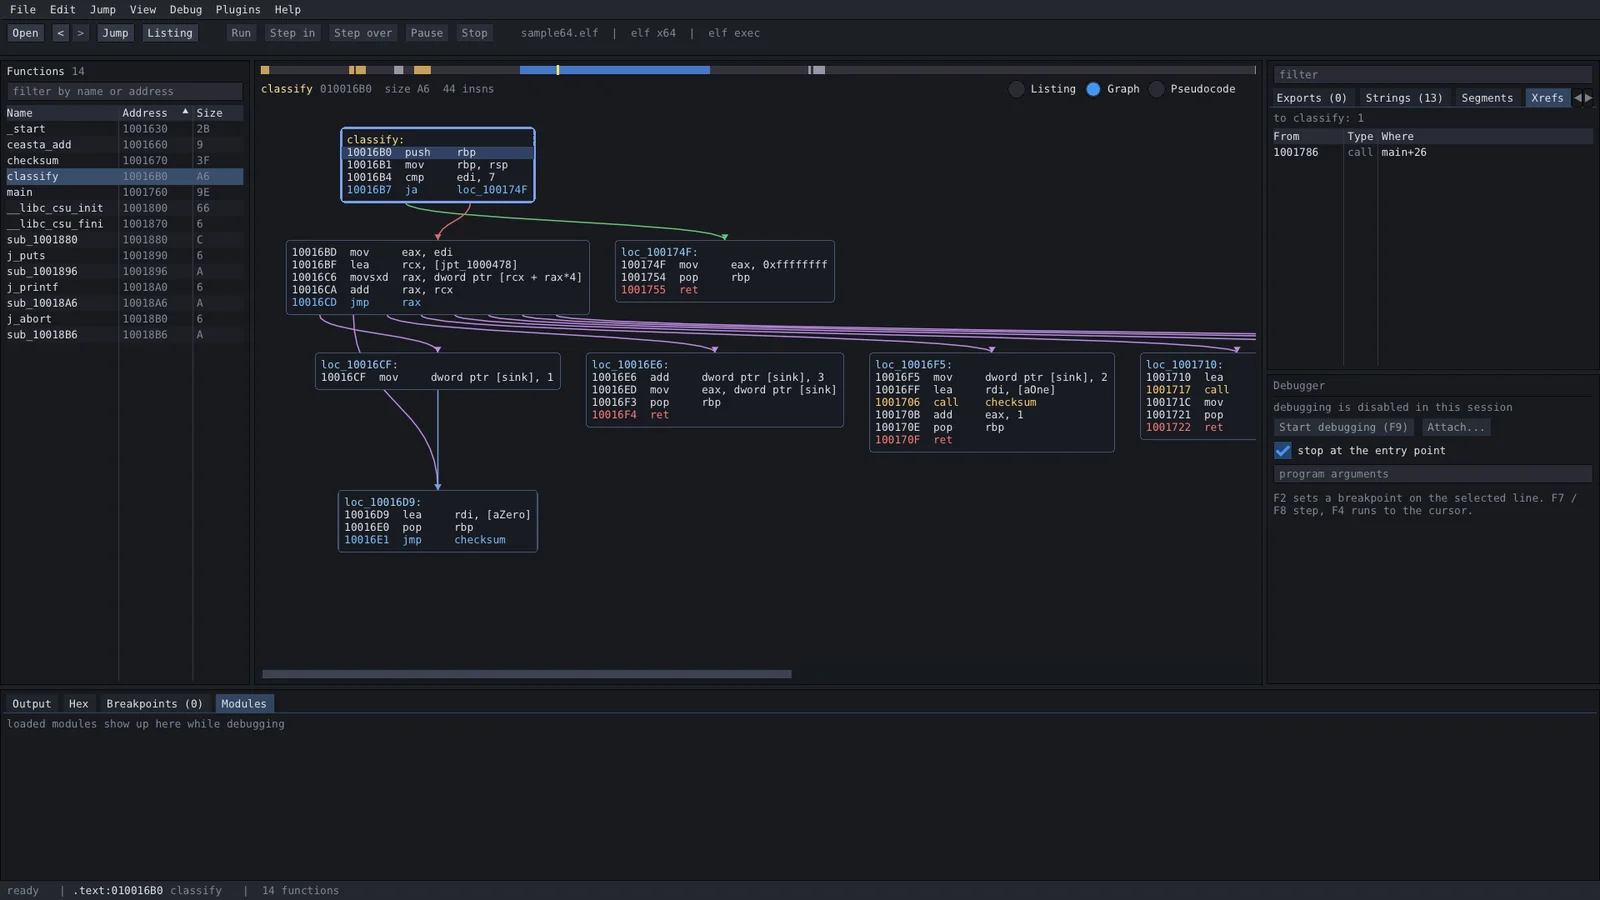
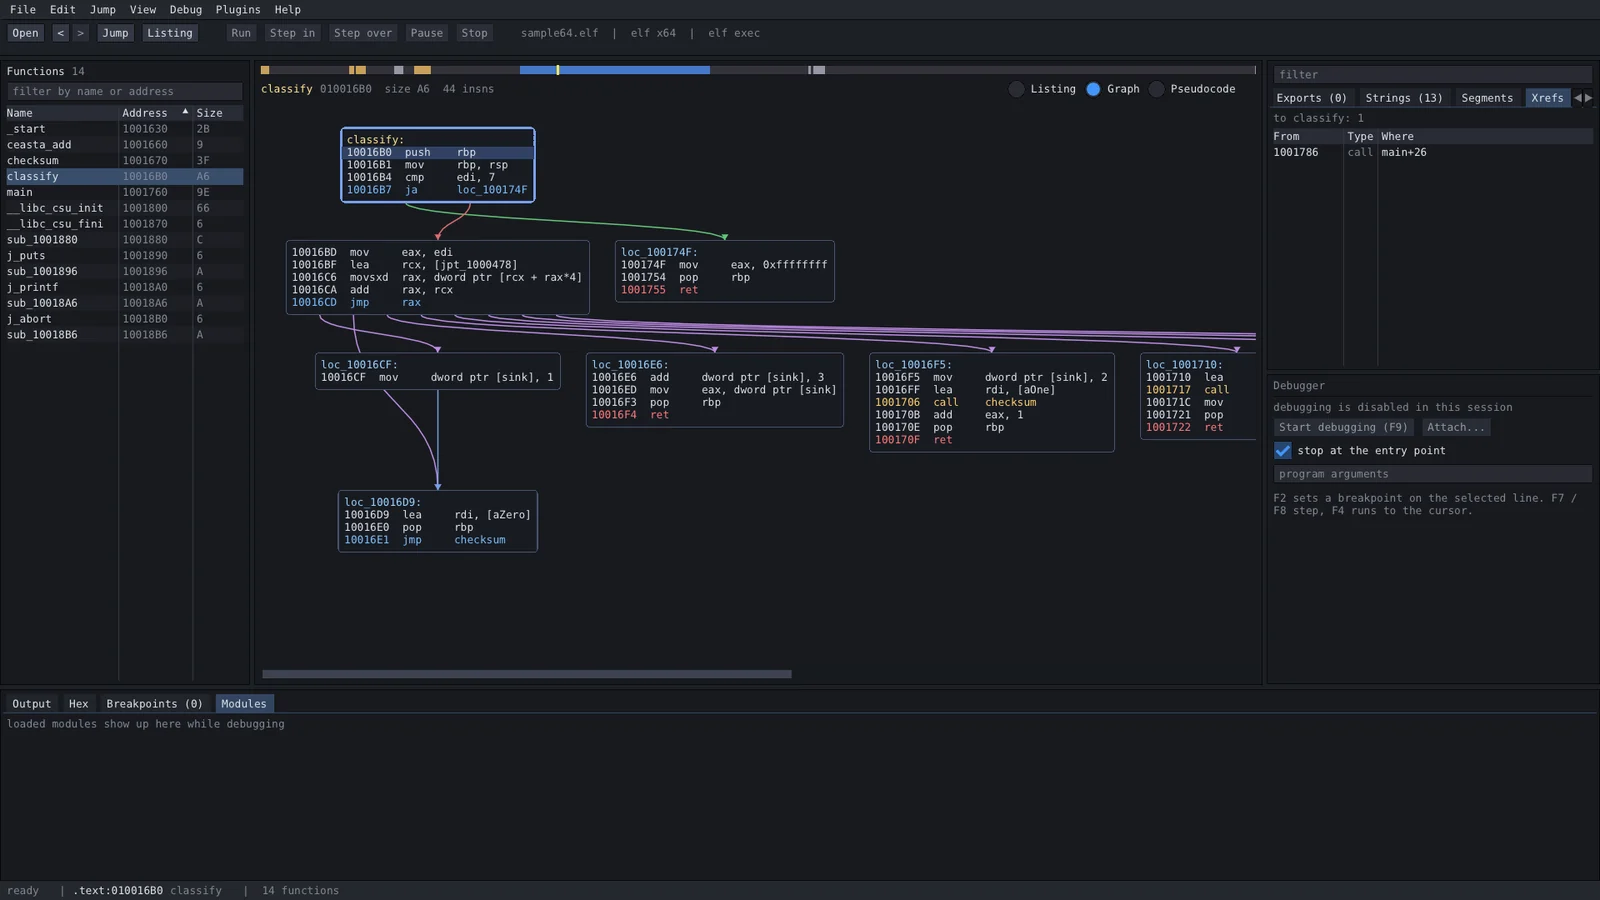
ida-style listing, a decompiler, a function graph, an x64dbg-style debugger, lua plugins, and a built-in MCP server so you can point an AI at a binary — one small program, everything vendored, nothing to install to build.
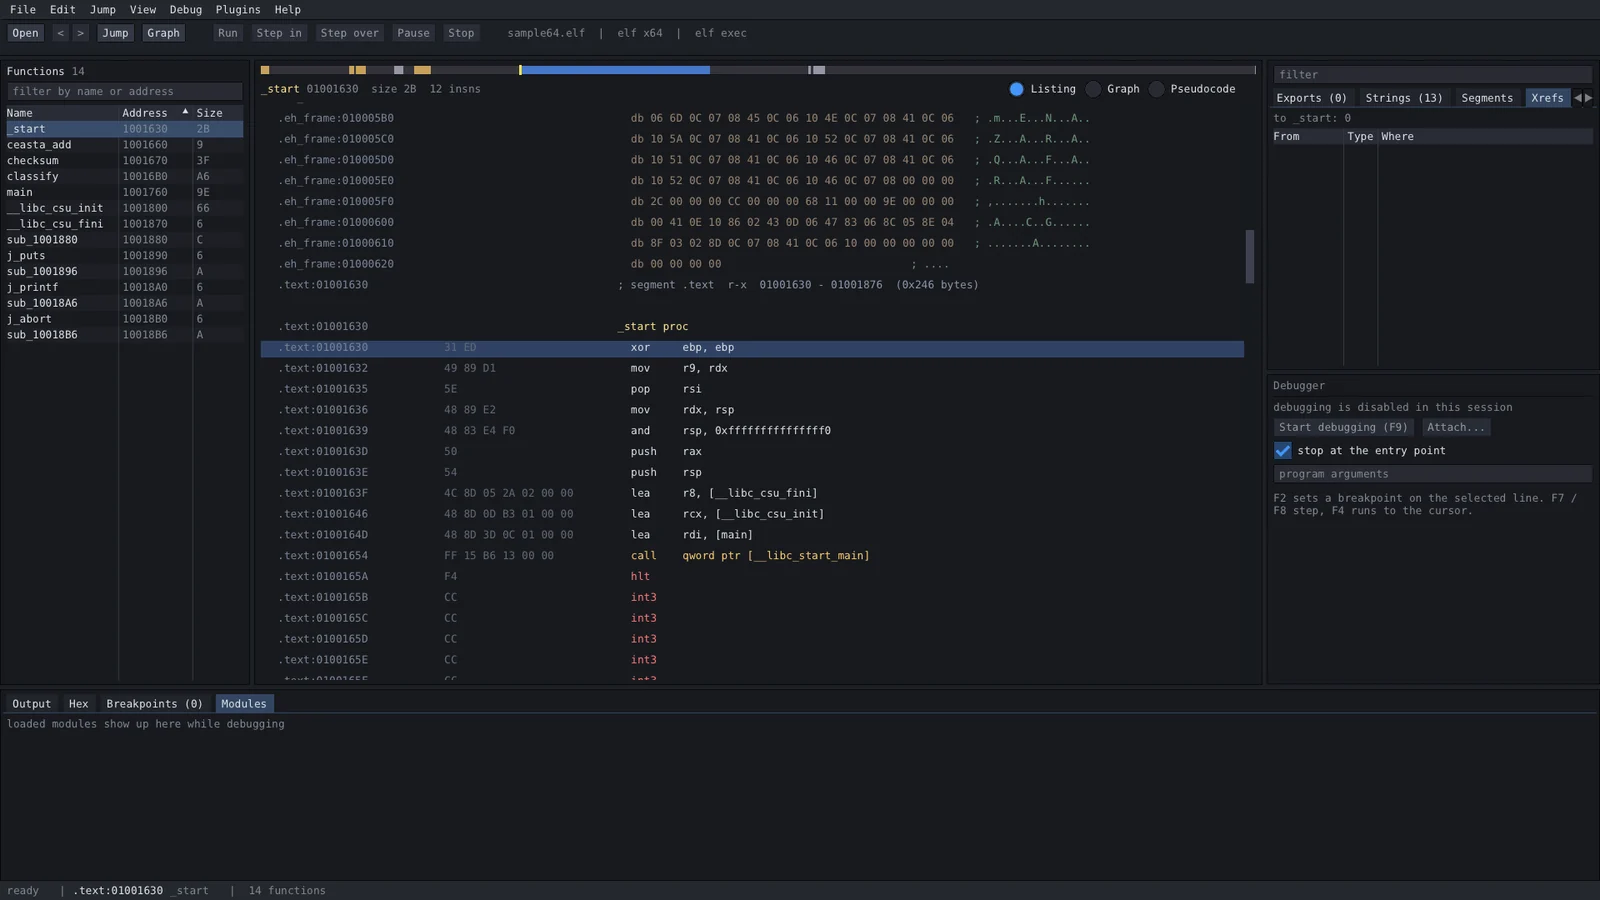
ceasta shows the same code from raw bytes up to readable c, so you can drop to whatever level you need:
; assembly - the real instructions  // pseudocode (f5) - reconstructed c

checksum proc                       int checksum(int rdi)
  movzx   edx, byte ptr [rdi]       {
  test    dl, dl                        rdx = *(char*)rdi;
  je      loc_1191                      if (rdx == 0) {
  mov     eax, 0x1505                       return 0x1505;
loc_1179:                               }
  mov     ecx, eax                      rax = 0x1505;
  shl     ecx, 5                        do {
  add     eax, ecx                          rax = rax + (rax << 5) + rdx;
  add     rdi, 1                            rdi = rdi + 1;
  movzx   edx, dl                           rdx = *(char*)rdi;
  add     eax, edx                      } while (rdx != 0);
  movzx   edx, byte ptr [rdi]           return rax;
  test    dl, dl                    }
  jne     loc_1179
  ret
loc_1191:
  mov     eax, 0x1505
  ret
that's djb2 (5381 is 0x1505, and (h << 5) + h is h * 33). the decompiler is best-effort: no types or structs yet, so you read registers and casts - great for getting a routine quickly, while the listing stays the source of truth.
grab it from the releases page:
| file | platform | what you get |
|---|---|---|
ceasta-x.y.z-setup.exe | windows 10/11 x64 | the full app, installs for your user (no admin), start menu + optional "open with ceasta" |
ceasta-x.y.z-windows-x64.zip | windows x64 | the full app, portable — unzip and run ceasta.exe |
ceasta-cli-x.y.z-linux-x64.tar.gz | linux x64 | ceasta-cli + plugins: analysis, disassembly, decompiler, scripting, terminal debugger (on linux) |
ceasta-cli dbg) — breakpoints, stepping, registers, memory. basic but real; best on single-threaded targetscall decrypt "..."), record indirect call targets as xrefs (trace)sigmake / sigapply)<binary>.ceasta next to itceasta-cli for scripts and cione window, nothing floating around:
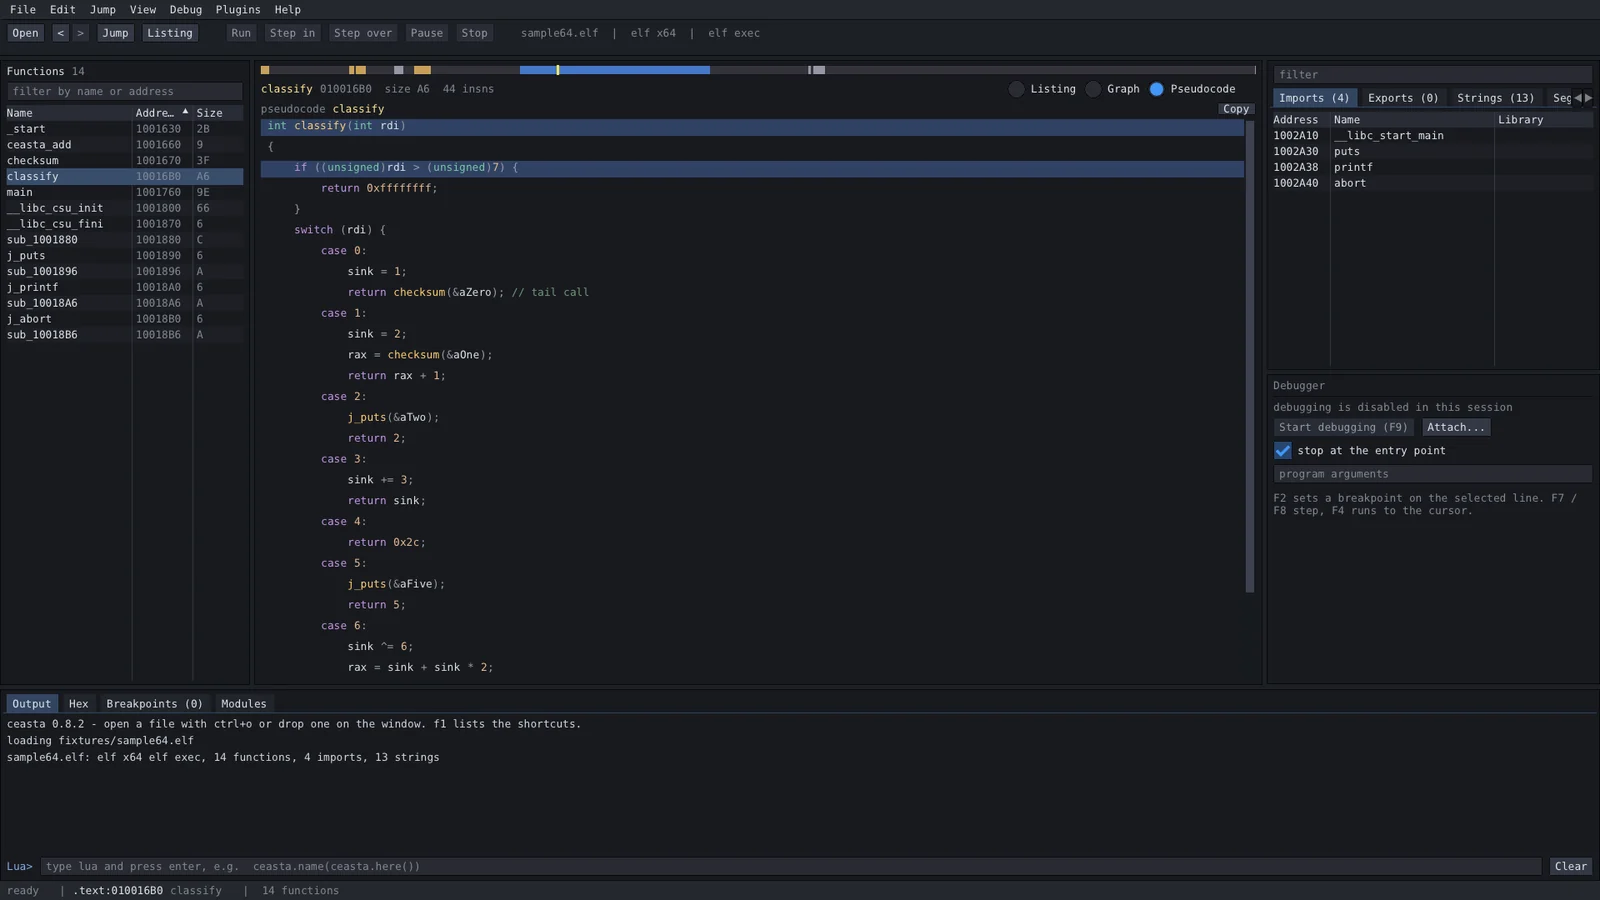
the decompiler (f5):
| key | what | key | what |
|---|---|---|---|
| ctrl+o | open a file | space | listing / graph |
| g | jump to address or name | f5 | pseudocode (decompiler) |
| enter / double click | follow the operand | alt+b | search bytes |
| esc / ctrl+enter | back / forward | f9 | start debugging / continue |
| n | rename | f7 / f8 | step into / over |
| ; | comment | f4 | run to cursor |
| x | references to here | f2 | toggle breakpoint |
| ctrl+s | save names and comments | f1 | all shortcuts |
plugins are lua files in plugins/ (next to the program) or in %APPDATA%\ceasta\plugins. they add commands to the plugins menu. five come with it: file summary, crypto finder, wrapper namer, strings report, call tracer (debugger).
ceasta.register_command("Count calls", function()
    local n = 0
    for _, fn in ipairs(ceasta.functions()) do
        n = n + #ceasta.xrefs_to(fn.addr)
    end
    ceasta.log(n .. " references to functions")
end)
the whole api is in the lua scripting guide. the output panel has a lua prompt too — try ceasta.name(ceasta.here()).
ceasta-cli info file.exe            format, entry, segments
ceasta-cli funcs file.exe           functions
ceasta-cli disasm file.exe main 40  listing from a name or address
ceasta-cli graph file.exe start     basic blocks of a function
ceasta-cli decompile file.exe main  pseudocode for a function
ceasta-cli xrefs file.exe CreateFileW
ceasta-cli find file.exe "48 8b ?? 05"
ceasta-cli run file.exe script.lua  run a plugin / script
ceasta-cli dbg ./program [args]     interactive debugger (linux + windows)
ceasta-cli diff old.exe new.exe     match functions, show what changed
ceasta-cli sigmake libc.a lib.sig   make signatures from a file with symbols
ceasta-cli sigapply stripped lib.sig  name matching functions
ceasta-cli mcp file.exe             serve the file to an AI over MCP
point an AI (Claude Code, Claude Desktop, Cursor, ...) at the binary through ceasta's built-in MCP server:
claude mcp add ceasta -- ceasta-cli mcp /path/to/target.exe
it can decompile, read xrefs, rename functions, diff builds, and — with --allow-debug — set
breakpoints, step, read memory and even call a function in the running program. the full guide,
including the debugger tools and the safety notes, is in connect an AI.
the gui is windows-only, but the command line tool does the analysis, disassembly, decompiler, scripting and a terminal debugger. grab ceasta-cli-x.y.z-linux-x64.tar.gz, unpack and run — nothing else to install:
tar xzf ceasta-cli-*-linux-x64.tar.gz
cd ceasta-cli-*-linux-x64

./ceasta-cli info /bin/ls                   format, entry, function / import / string counts
./ceasta-cli decompile /bin/ls start        pseudocode for the entry point
./ceasta-cli run /bin/ls plugins/hello.lua  run a lua plugin
./ceasta-cli dbg ./program                  debug it (break, step, registers, memory)
it reads elf (x86 / x64) and windows pe files alike, so you can look at a windows exe from linux too.
the terminal debugger (dbg) is a ptrace debugger with ceasta's names, disassembly and decompiler built in:
(ceasta) b main            break at a name or address
(ceasta) c                 continue
(ceasta) ni / si           step over / into      until <addr>  run to
(ceasta) r                 registers             k  stack       x <addr>  memory
(ceasta) u                 disassemble here (with names)
(ceasta) dec               decompile the function you're stopped in
(ceasta) lua ...           run lua against the live process
everything needed is in the repo — just a compiler, nothing to fetch.
windows
ceasta.sln, pick Release | x64, build → build\msvc\Releasecmake -S . -B build then cmake --build build --config Releasepowershell -ExecutionPolicy Bypass -File installer\package.ps1linux (core + cli, the gui is windows-only)
cmake -S . -B build && cmake --build build -j
src/app.* — state, actions and the main layoutsrc/ui/ — one file per panel (top_bar, left_panel, ida_view, graph_view, pseudo_view, right_panel, cpu_panel, bottom_panel, status_bar, dialogs)src/widgets/ — small shared bits (nav_band, splitter)src/core/ — no ui: loaders (binary, pe, elf), disasm (capstone), analysis, database, decompiler, lua_host, debugger (win32) + debugger_linux (ptrace), ossrc/cli/ — ceasta-cli and the dbg terminal debuggerplugins/ — lua plugins that ship with itdocs/ — the lua guide, the changelog, third-party licenses, screenshotsinstaller/ — inno setup script and packagingthird_party/ — imgui, capstone (x86 only), lua 5.4ceasta is GPLv3. the vendored libraries keep their own (permissive) licenses — dear imgui and lua are MIT, capstone is BSD; details in docs/THIRD_PARTY_NOTICES.md.
