
A personal Windows SOC suite built in PowerShell — monitors network connections, resource usage, scheduled tasks and power events with severity classification and baseline detection.
A personal Security Operations Center (SOC) built from scratch during an Anwendungsentwicklung retraining program. This suite monitors a Windows endpoint for network anomalies, resource spikes, process execution, registry changes, Security Event Log activity, scheduled task changes, DNS queries, and power events — logging everything to structured files for weekly analysis and correlation through a Python engine.
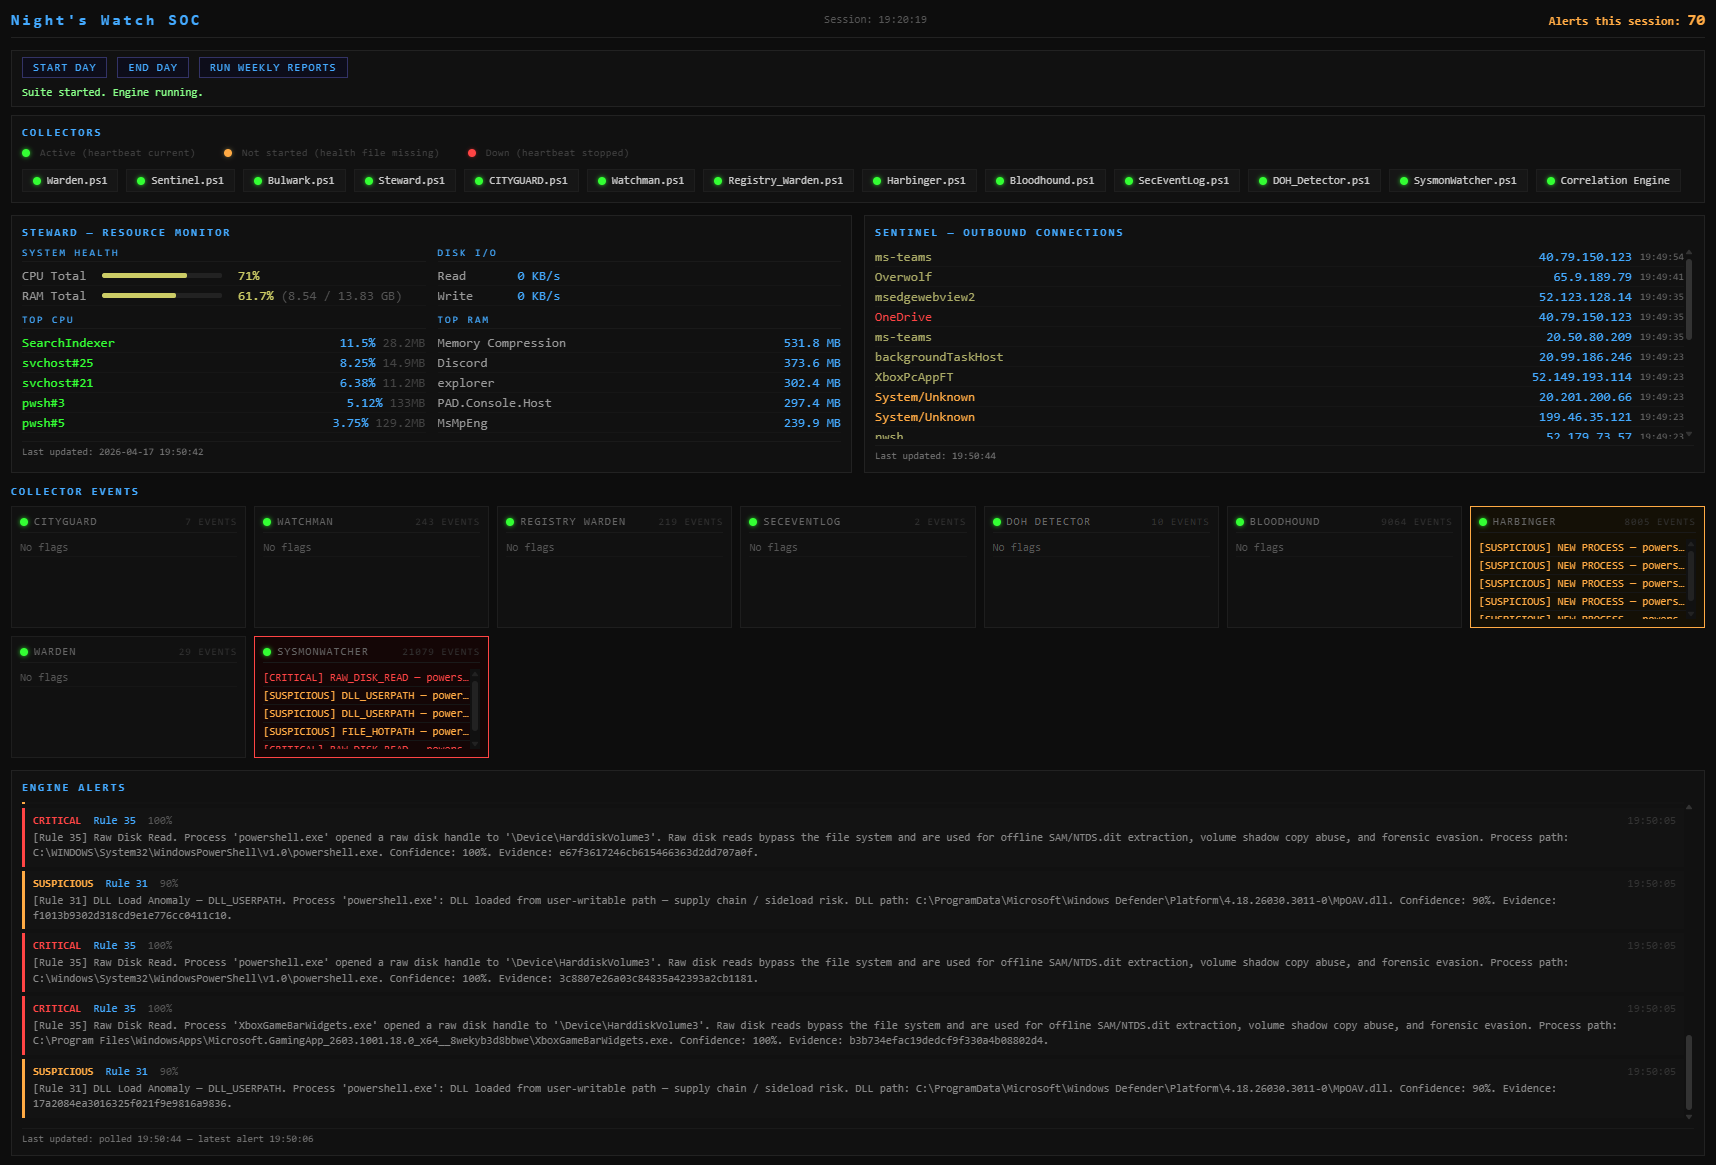
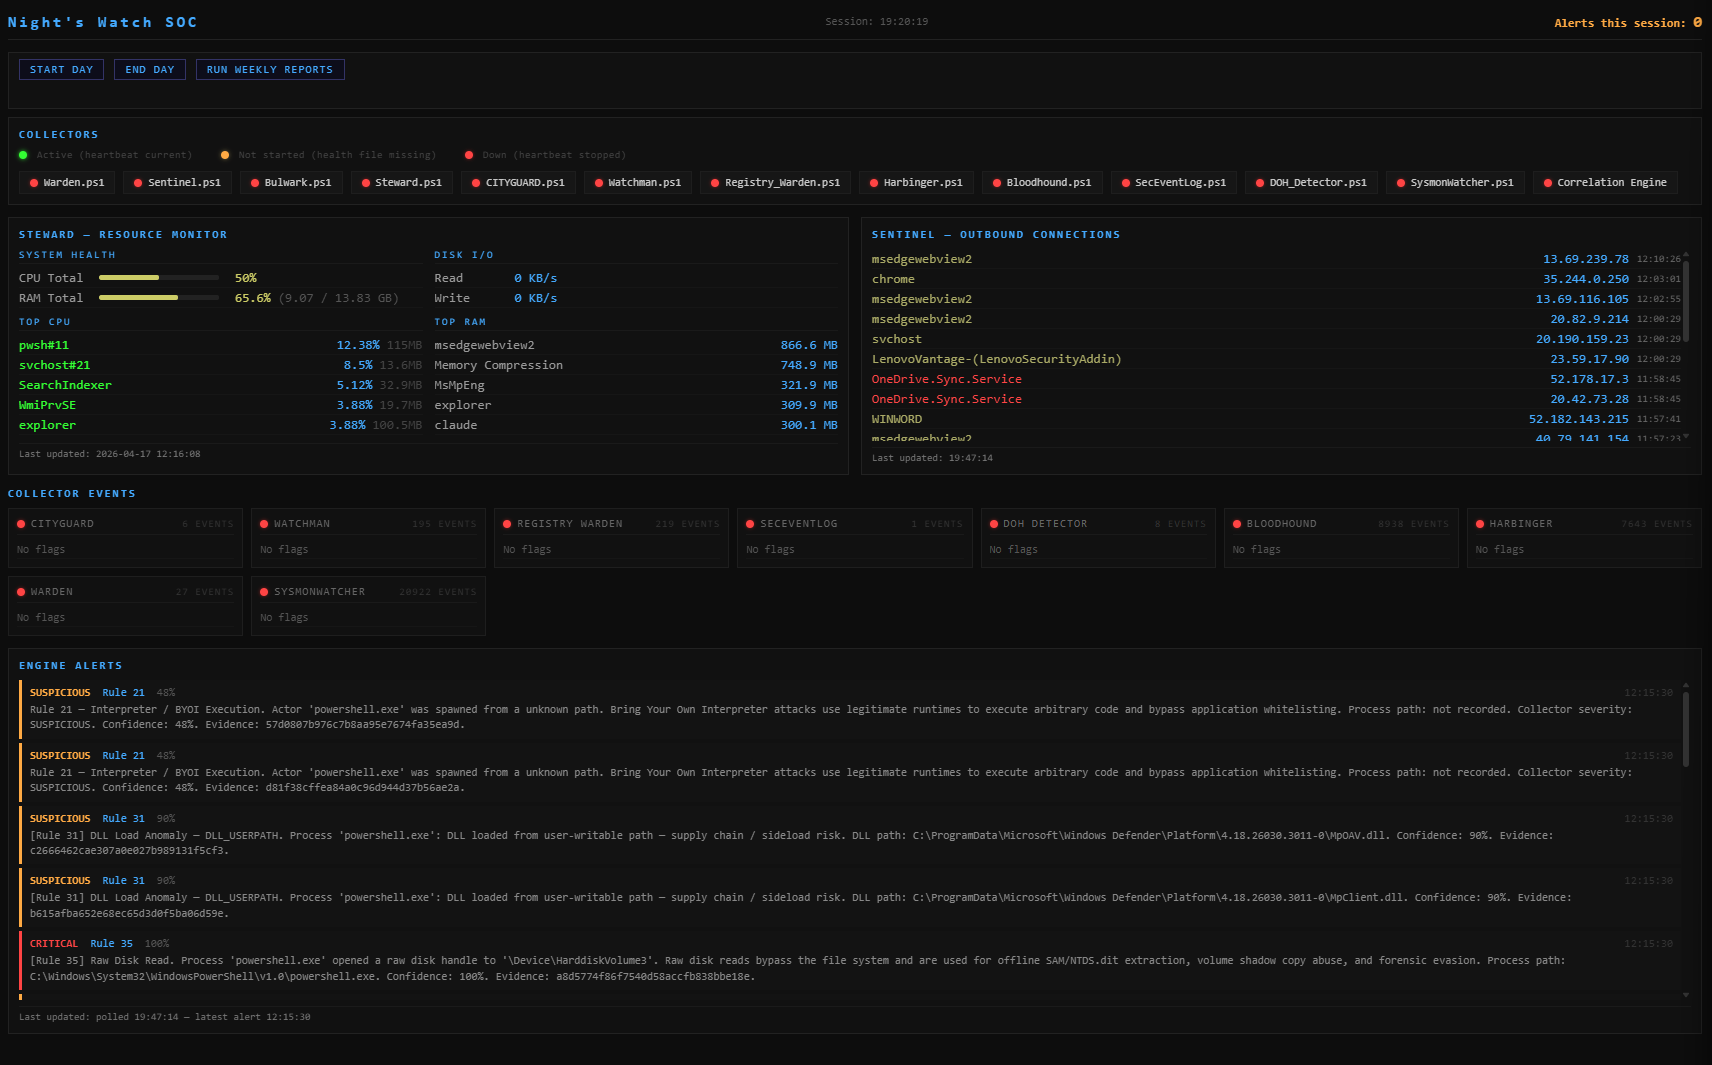
Single-page Flask dashboard. All 12 collectors + correlation engine active, live resource monitor, outbound connection feed, collector event tiles, and streaming engine alerts.
Built as a practical learning project alongside formal IT retraining, this suite applies real SOC concepts — baseline collection, anomaly detection, severity classification, log aggregation, and cross-source correlation — to a personal Windows machine. The design process was adversarial from the start: each phase was stress-tested against a red team analysis before the next was built, with 48 correlation rules defined from those findings driving the architecture of the Python engine.
Development is tracked in roadmap.md — current state, Phase 9
Forensic Engine plans, and longer-term hardening goals.
The dashboard runs as a Flask server and requires Administrator elevation for collector process detection. Create a shortcut once after cloning:
pwsh.exe -ExecutionPolicy Bypass -WindowStyle Minimized -File "C:\path\to\SOC\Dashboard\Launch_Dashboard.ps1"
C:\path\to\SOC with your actual install path.SOC DashboardThe shortcut starts Flask, waits for it to be ready, then opens the browser automatically. If Flask is already running it skips startup and opens the browser directly. Status dots will show grey if the shortcut is run without Administrator elevation.
The dashboard enforces a clean start/stop sequence so the Auditor bookends (morning integrity check, evening hash chain validation) always run in order.
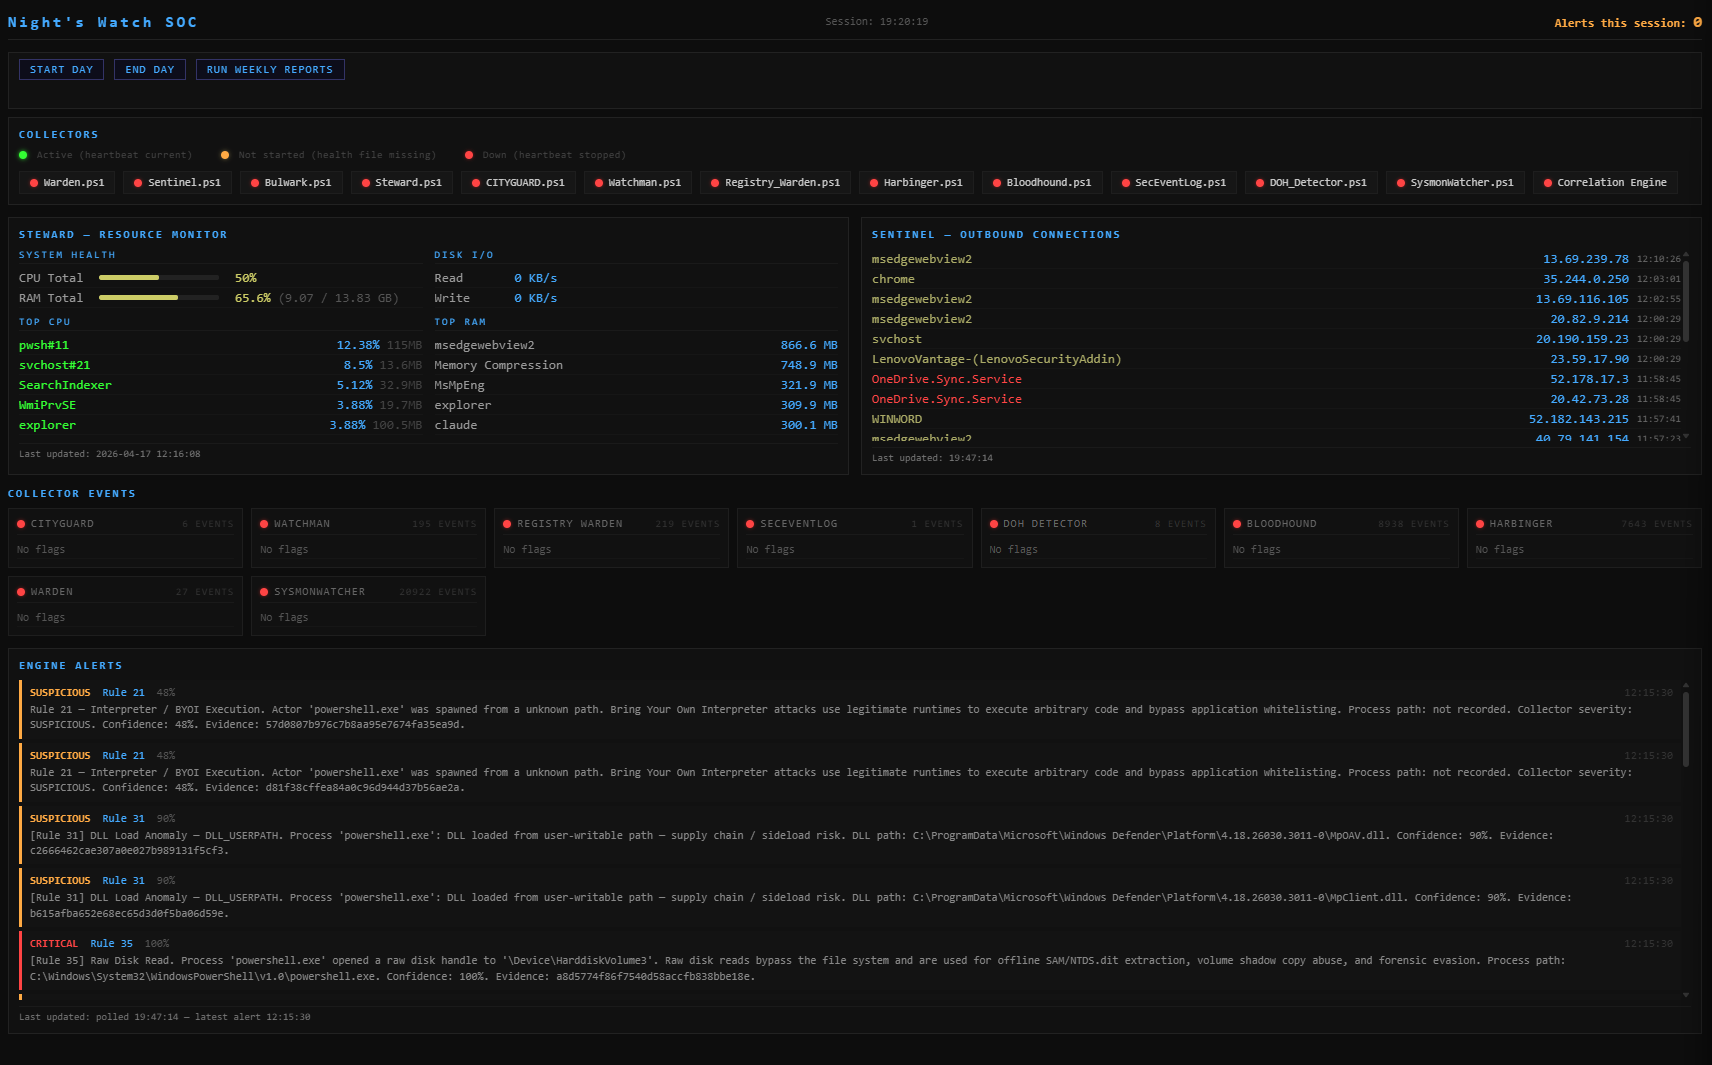
All collector heartbeats are red (health files missing or stopped). The Shutdown Dashboard button is hidden — the dashboard will not allow shutdown until End Day has run.

Start Day runs the morning Auditor bookend (SHA256 log verification, archive hash chain validation) and launches all 12 collectors plus the correlation engine. Heartbeats turn green as each collector reports in.
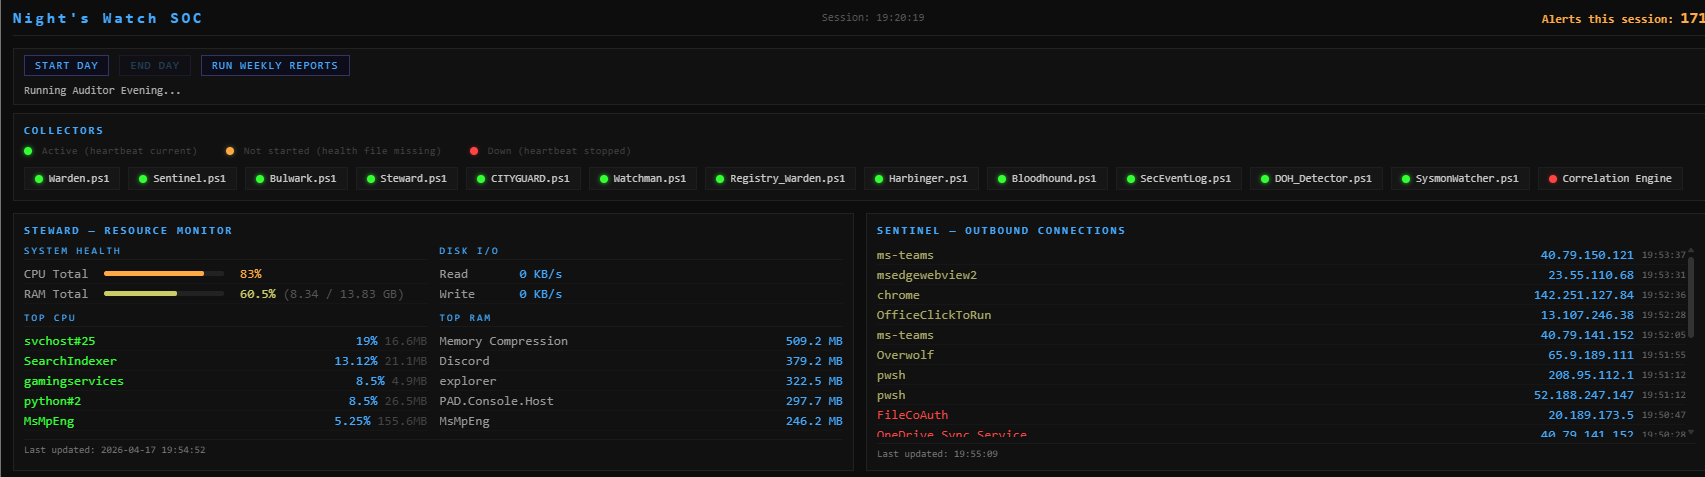
End Day stops all collectors in sequence and runs the evening Auditor bookend. Collector dots stay green while the sequence runs; the status line shows Running Auditor Evening…
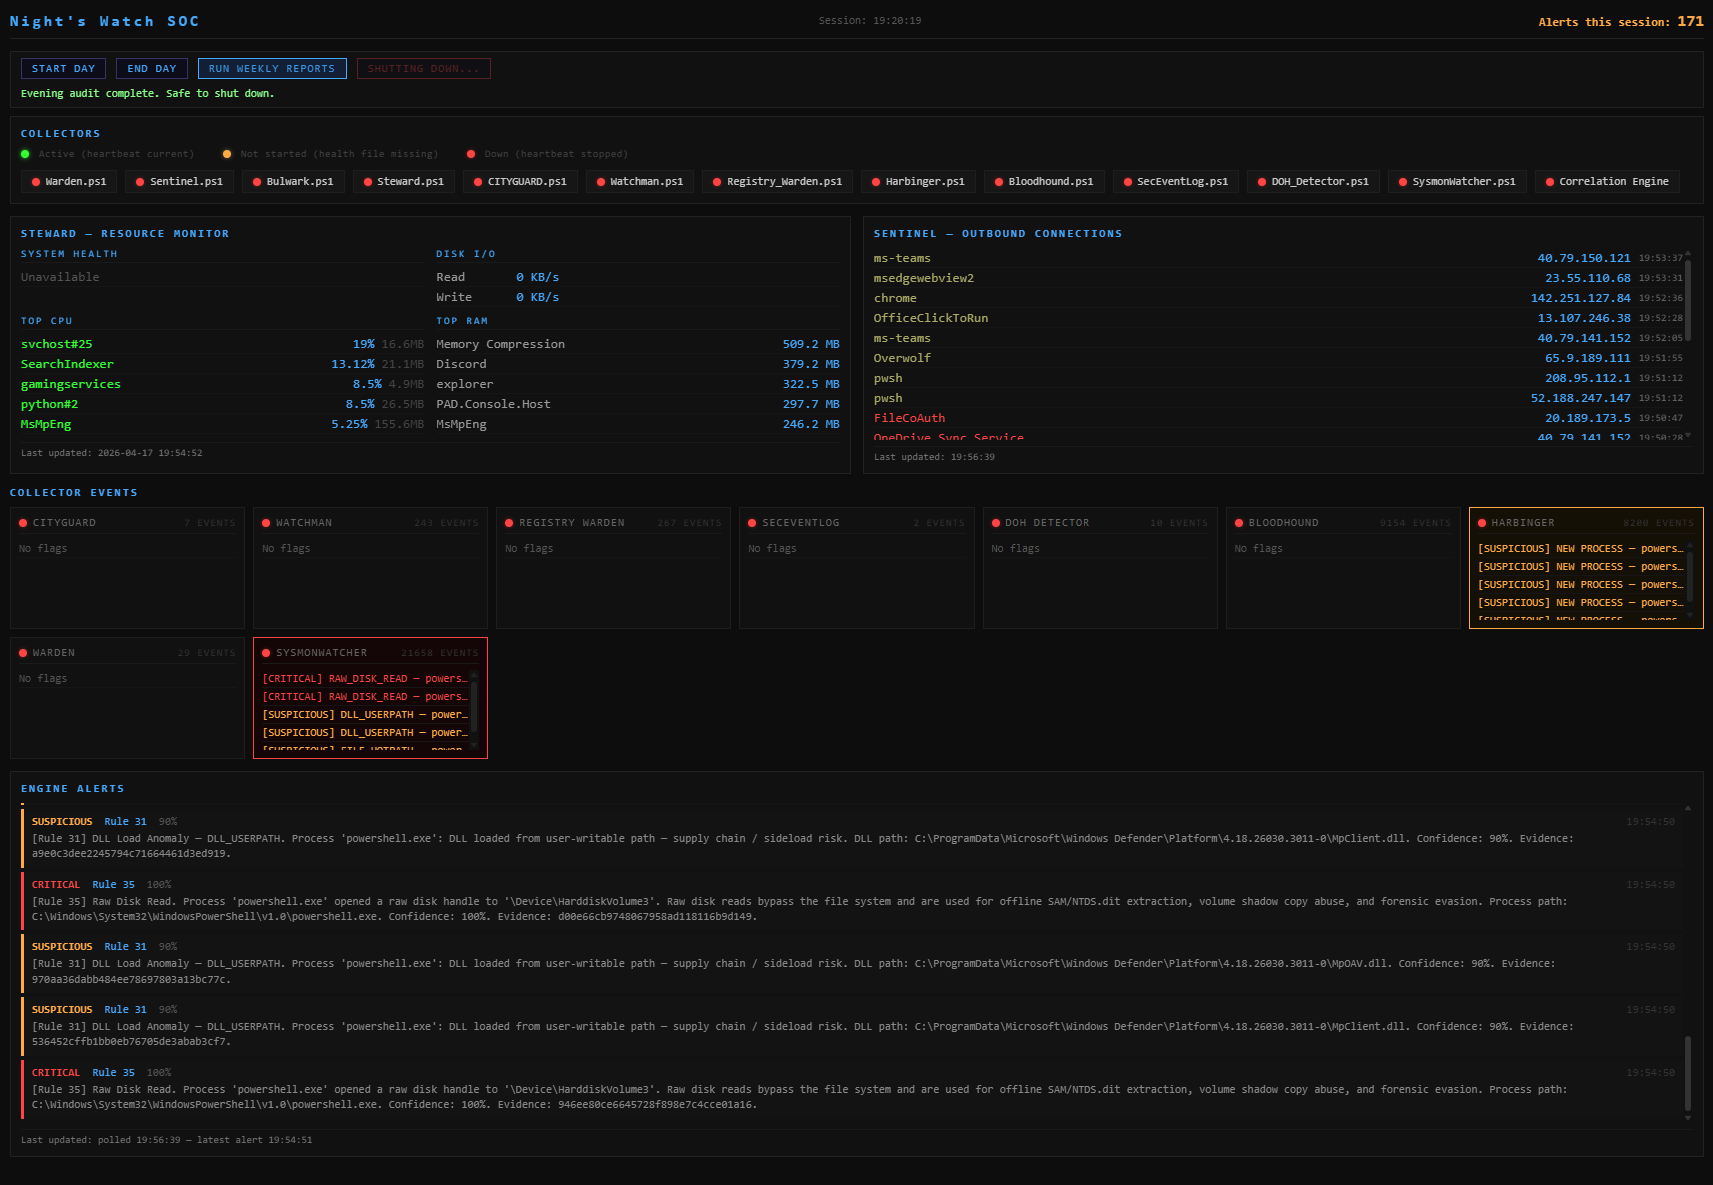
Once the evening audit completes, all collector dots go red, the status line reads Evening audit complete. Safe to shut down., and the Shutdown Dashboard button appears — clicking it terminates the Flask process cleanly.

The browser tab must be closed manually (browsers do not expose a close API to external processes).
Collector event tiles show the most recent severity-tagged events per source. The Engine Alerts feed streams correlated findings from the Python engine in real time, with rule number, confidence score, full evidence chain, and SHA256 evidence hash.
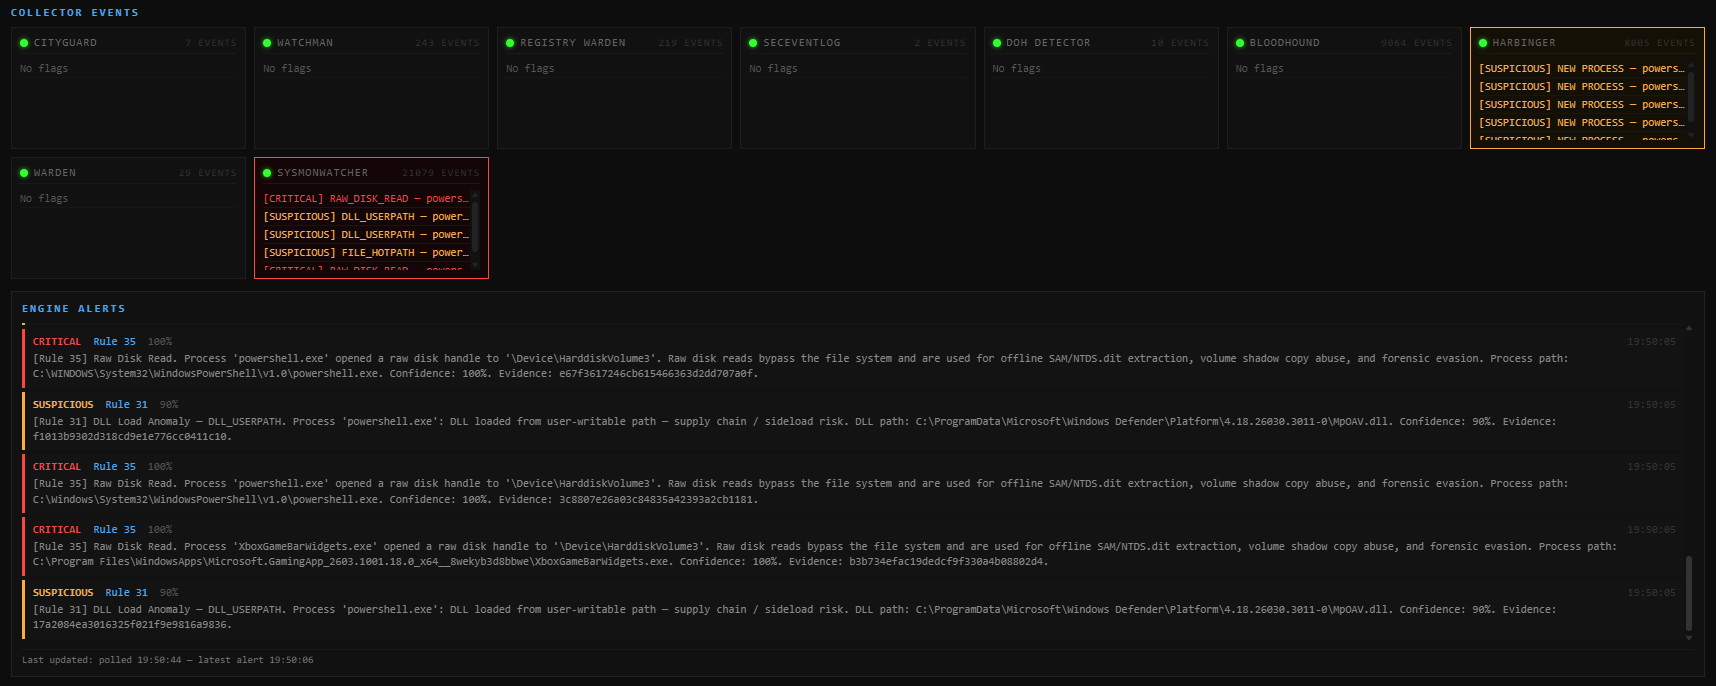
Example: Rule 35 (Raw Disk Read) firing on powershell.exe opening a raw
handle to \Device\HarddiskVolume3, and Rule 31 (DLL Load Anomaly) flagging
Defender DLLs loading from a user-writable path. Both with full process
provenance and file hashes.
The suite follows a three-layer architecture:
Collection Layer — PowerShell collectors that run continuously in the background, each monitoring a specific data source and writing structured, severity-tagged log entries. All require Administrator elevation.
Analysis Layer — PowerShell analyst scripts that parse collected logs and generate weekly summary reports. Run as standard user.
Correlation Engine (Phase 7 — complete) — Python engine that ingests all collector logs, normalises events to a common schema, and runs rule-based and risk-scored correlation across all data streams. Three programs:
| Program | Phase | Role |
|---|---|---|
| Correlation Engine | 7 — complete | Ingest, normalise, correlate, alert (SQLite operational store) |
| SOC Dashboard | 8 — complete | Live visibility — collector health, alerts, evidence chains (Flask) |
| Forensic Engine | 9 — planned | Post-event investigation — super timelines, process lineage, beacon analysis, persistence audits, append-only evidence databank |
| Forensic Dashboard | 9 — planned | Summarised forensic conclusions — color-coded status, report generation, evidence navigation |

