 m0vi0/pacmap
Graph-first network traffic visualizer for live capture and PCAP replay with checkpoint diffing, path tracing, and Wireshark-style display filters for security analysis.

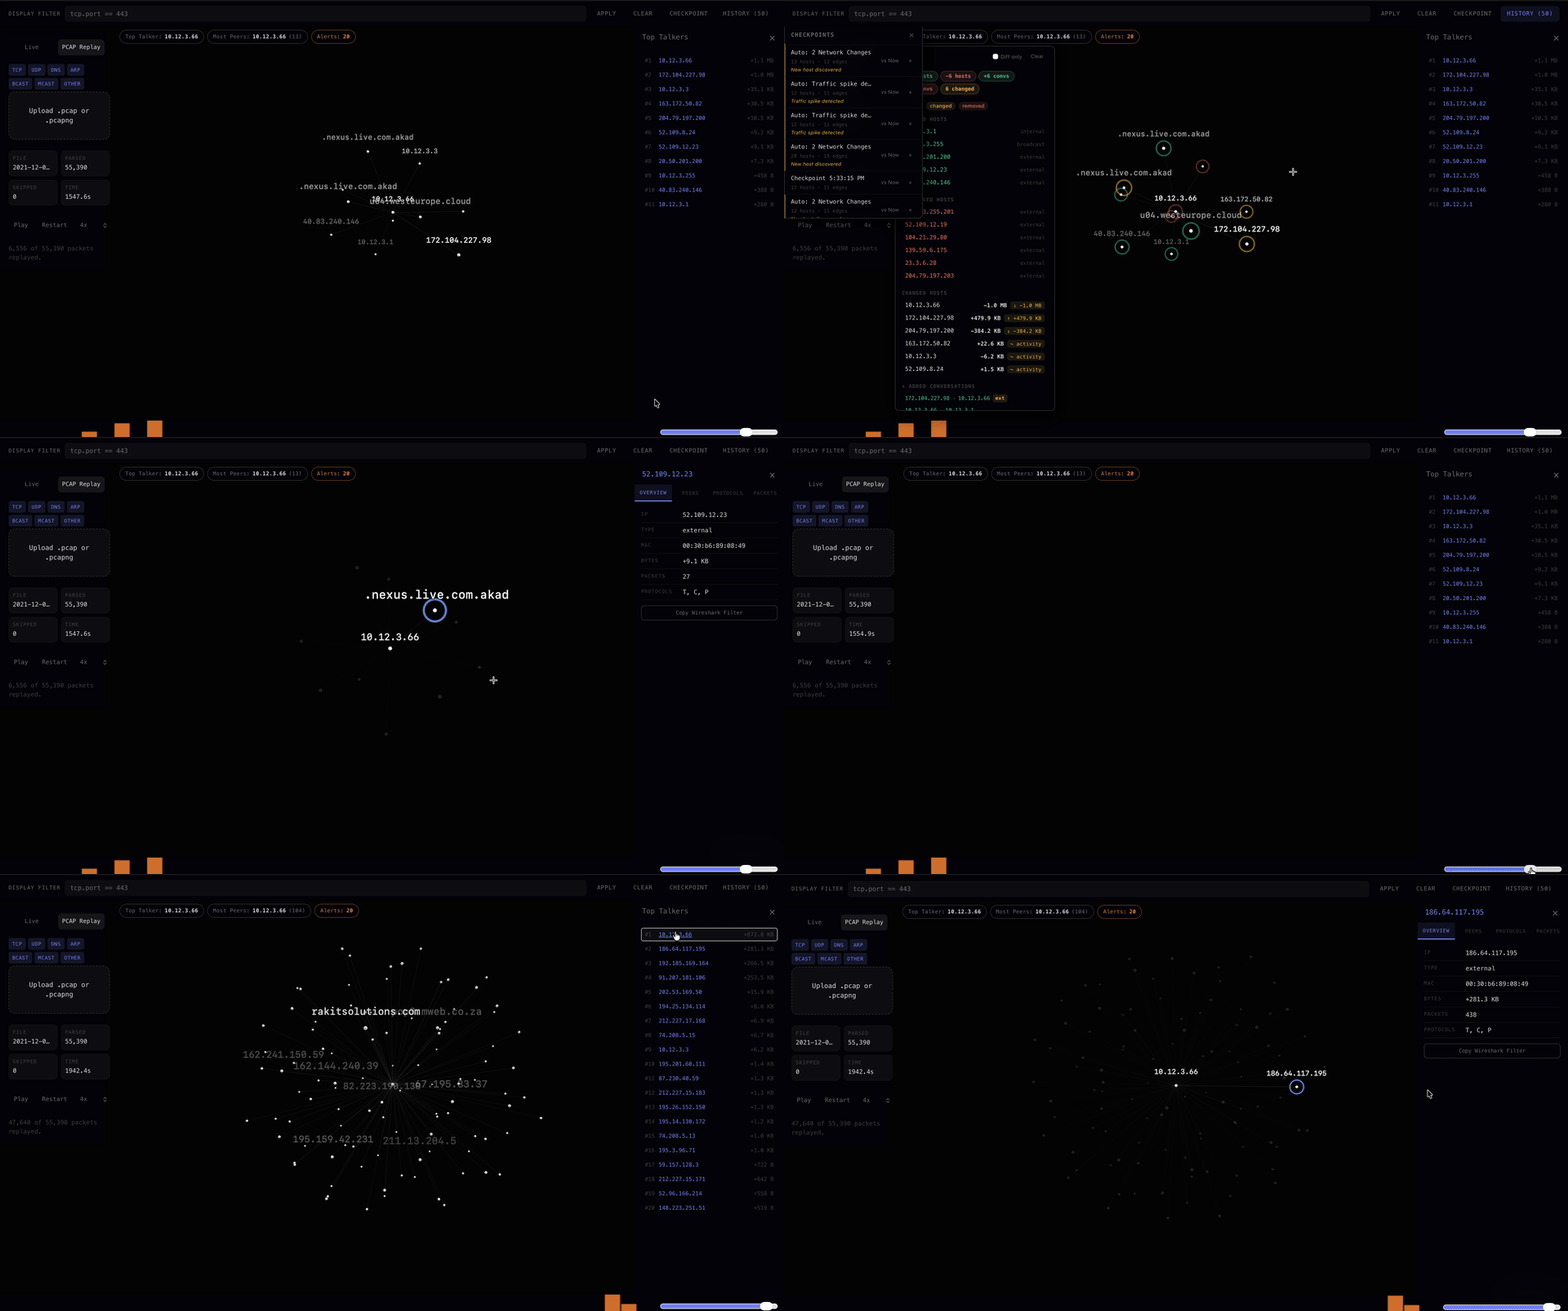
PacMap is a graph-first network traffic visualizer for live capture and PCAP replay that helps you see what changed, what's noisy, and what to inspect next.
Think of it as Git for network behavior: snapshot, diff, and replay network state visually.
PacMap supports two workflows:
.pcap or .pcapng file and replay packet flow over time.From the repo root:
python3 -m venv venv
source venv/bin/activate
pip install websockets scapy
npm install --prefix client
On Windows, create and activate a venv using your normal Python workflow, then install the same packages. Packet capture on Windows requires Npcap.
Start PacMap from the repo root:
npm start -- --iface en0
Common interface examples:
en0eth0wlan0Open:
http://127.0.0.1:5176
Then use the control dock to start live capture.
Raw packet capture usually needs elevated local privileges. On macOS/Linux:
sudo npm start -- --iface en0
On Windows, run the terminal as Administrator.
Open the web app, switch the source to PCAP Replay, and upload a .pcap or .pcapng file. Then use:
Replay runs in the browser and does not require the Python capture server to be running.
Replay includes investigation panels for conversations, endpoints, protocol breakdown, name resolution, and I/O timeline activity.
File limits: 100 MB and 100,000 packets. Unsupported frames are skipped and counted in the UI.
Current replay support:
.pcap and basic .pcapngBoth Live Capture and Replay support a Wireshark-style display filter bar. Type a filter and press Enter to apply; clear the field and press Enter to remove it.
Supported syntax:
tcp          udp          dns          http         arp
ip.addr == 192.168.1.10
ip.src == 10.0.0.1
ip.dst == 8.8.8.8
tcp.port == 443
udp.port == 53
port == 80
ip.src == 10.0.0.1 && ip.dst == 8.8.8.8
Compound filters (&&) combine two field filters. Applying a filter narrows the graph to matching nodes and edges; clearing it restores the full view for the current capture window.
A compound ip.src == X && ip.dst == Y filter activates path tracing. PacMap runs BFS over the full capture to find the hop chain between the two endpoints. A panel appears below the control dock showing each hop with per-edge packet and byte counts, and intermediate nodes are highlighted in the graph.
Checkpoints snapshot the current network state — nodes, edges, traffic volumes — at a point in time.
Checkpoints persist in localStorage under pacmap_checkpoints (up to 50 entries).
Browsers cannot sniff host network traffic or start privileged packet capture directly. PacMap uses a local Python WebSocket helper with Scapy for live capture, then streams packet summaries to the React app at:
ws://127.0.0.1:8765
PCAP replay is different: the browser reads the uploaded file and reuses the same graph visualization without needing live packet access.
Frontend only:
cd client
npm install
npm run dev
Production build:
npm run build
Capture server only:
source venv/bin/activate
python3 server.py --iface en0
server.py is not running or the WebSocket port is unavailable.ping 8.8.8.8, DNS lookups, or other network activity.