 lnfernux/log-horizon
Microsoft Sentinel SIEM Log Source Analyzer



I've had to answer "what are we actually getting out of these logs?" or "what is the recommended logs for Microsoft Sentinel" more times than I can count. The answer always depend on so many things, but we can be generic. So I built this thingy right here.
Log Horizon connects to your Microsoft Sentinel workspace (and optionally Defender XDR), goes through every log table you're ingesting, and tells you whether you're getting security value from it or just burning money. It classifies tables, scores them against your detection rules, and gives you concrete recommendations with savings estimates.
Important: This is a generic approach. If you know a log source is important to your environment, that context always takes precedence over what this tool tells you. The classifications are a starting point, not gospel.
Want to read more? I have some posts about Log Horizon on my blog:
| Feature | Description |
|---|---|
| Classification Engine | 481-entry knowledge base covering 240+ connectors, 22 categories, with lifecycle status (deprecated/legacy plus replacement tables) and automatic heuristic fallback for unknown tables |
| Cost-Value Scoring | Per-table cost tier vs detection tier matrix with combined assessment (High Value to Low Value), priced per observed plan (Analytics, Basic, Data Lake) |
| Recommendations | 13 prioritised action types: data lake or Basic candidates, zero-detection tables, XDR streaming waste, ingest-time filtering, split candidates, plan usage, deprecated sources, retention shortfalls, XDR Checker and Detection Analyzer findings, each with savings estimates |
| Detection Mapping | Maps analytics rules, hunting queries, and XDR detections to each table to spot coverage gaps |
| Correlation Tags | Detects #DONT_CORR# / #INC_CORR# tags in rule descriptions and flags rules excluded from Defender correlation |
| Retention Compliance | Compares actual retention against recommended minimums based on industry standards and security best practices |
| SOC Optimisation | Pulls Microsoft's own SOC improvement recommendations from the Security Insights API |
| Keyword Gap Analysis | Flag tables you should be ingesting but aren't based on vendor/product keywords |
| Transform Discovery | Discovers Data Collection Rules (DCRs) targeting the workspace (subscription list filtered on destination, the workspace transformation DCR, and workspace associations), parses inline and multi-stage transforms, and labels every operation (filter, projection, column removal, enrichment, aggregation) |
| Split Table Detection | Identifies _SPLT_CL split tables and links them back to parent tables in the classification engine |
| Split KQL Generator | Generates portal-ready split KQL from a curated knowledge base, live rule analysis, and community field frequency stats -- condition-only format that pastes straight into the Sentinel split rule editor. Field lists are intersected with the table's live schema; anything not present is reported as dropped |
| Detection Analyzer | Scores analytic rules for potential noisiness using incident outcomes (auto-close ratio, false positive ratio, and incident volume percentiles) |
[!CAUTION] Disclaimer
This tool is developed and maintained with the help of AI. Please exercise caution when using this solution and always understand what are you running before you run it in production. The developer assumes no liability for any vulnerabilities or issues.
By downloading, installing, or using this tool, you acknowledge that you have read, understood, and agree to these terms.
| What you need | Version |
|---|---|
| PowerShell | 7.0+ |
| Az modules | Az.Accounts |
| Other modules | PwshSpectreConsole 2.6.3+ |
| Optional | Microsoft.Graph.Authentication (for -IncludeDefenderXDR as a signed-in user) |
Endpoints follow the Azure environment of the current Connect-AzAccount session, so Azure Government and Azure China workspaces work without extra parameters. The public cloud values are used when no environment is available.
If you're not already logged into Azure, the module will fire up Connect-AzAccount for you. If you are, it'll just carry on.
Permissions: Log Analytics Reader and Microsoft Sentinel Reader on the workspace cover the analysis. Transform discovery also needs Microsoft.Insights/dataCollectionRules/read (Monitoring Reader) on the subscription or resource group; without it the run continues and prints a warning naming the missing permission. -IncludeDefenderXDR uses Microsoft Graph with CustomDetection.Read.All, which for a signed-in user means the optional Microsoft.Graph.Authentication module.
Pretty straight forward:
# Grab the dependencies
Install-Module -Name Az.Accounts -Scope CurrentUser
Install-Module -Name PwshSpectreConsole -Scope CurrentUser

# Clone and import
git clone https://github.com/lnfernux/log-horizon
Import-Module ./log-horizon/LogHorizon.psd1
Start by connecting to Azure and making sure you select the right account and subscription:
Connect-AzAccount
Then we can invoke the tool:
Invoke-LogHorizon -SubscriptionId '00000000-0000-0000-0000-000000000000' -ResourceGroup 'rg-sentinel' -WorkspaceName 'my-sentinel-ws'
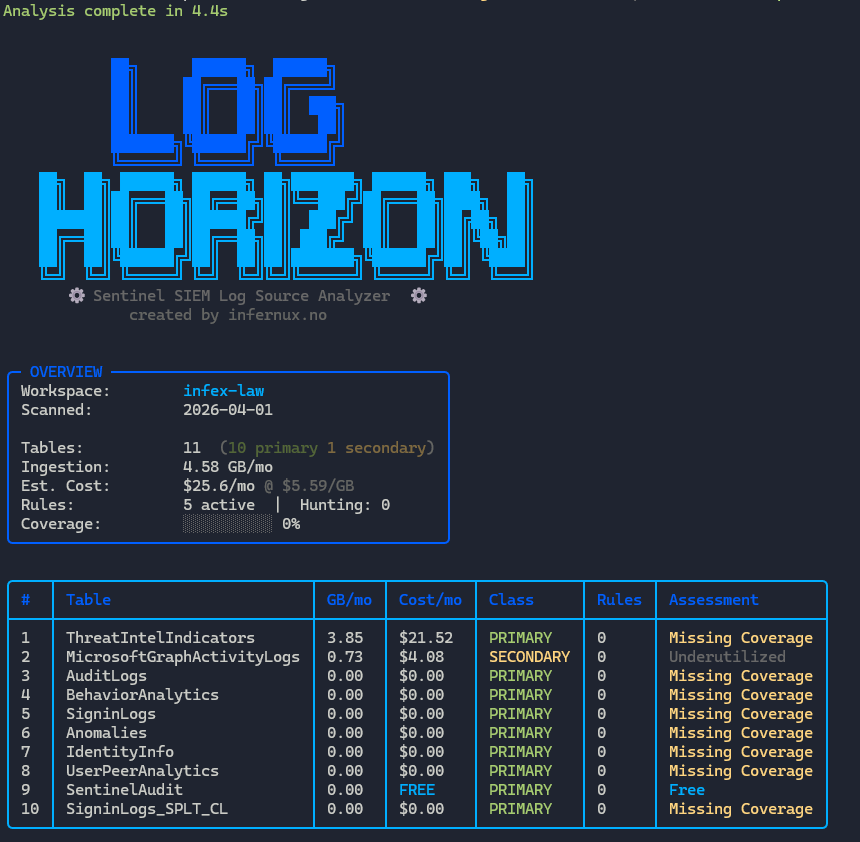
Output should look something like this:
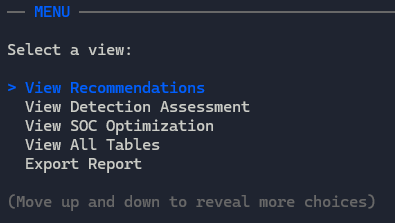
Also has a menu to dig deeper into other outputs:
Want to know if you're missing tables related to specific vendors? Throw in some keywords. Add -IncludeDefenderXDR if you want the XDR analysis too.
Invoke-LogHorizon -SubscriptionId '...' -ResourceGroup 'rg' -WorkspaceName 'ws' -Keywords 'CrowdStrike','AWS','Okta' -IncludeDefenderXDR
Enable rule quality/noise analysis based on incidents and automation rules:
Invoke-LogHorizon -SubscriptionId '...' -ResourceGroup 'rg' -WorkspaceName 'ws' -IncludeDetectionAnalyzer -DetectionLookbackDays 90
# JSON
Invoke-LogHorizon -SubscriptionId '...' -ResourceGroup 'rg' -WorkspaceName 'ws' -Output json -OutputPath ./report.json

# Markdown
Invoke-LogHorizon -SubscriptionId '...' -ResourceGroup 'rg' -WorkspaceName 'ws' -Output markdown -OutputPath ./report.md

# Static HTML (self-contained, no JS, works offline)
Invoke-LogHorizon -SubscriptionId '...' -ResourceGroup 'rg' -WorkspaceName 'ws' -Output html -OutputPath ./report.html

# Auto-generate timestamped filename by pointing at a directory
Invoke-LogHorizon -SubscriptionId '...' -ResourceGroup 'rg' -WorkspaceName 'ws' -Output html -OutputPath ./reports/
You can now update table retention and table type directly from the interactive TUI:
Invoke-LogHorizon normally, then choose Manage table retention and type from the main menu for bulk retention or type updates.For scripting or automation, use the dedicated public command:
# Preview a single-table change (prints a Table / Plan / Interactive / Total / Status / Reason table, applies nothing)
Set-LogHorizonTableRetention -SubscriptionId '...' -ResourceGroupName 'rg' -WorkspaceName 'ws' `
  -TableName 'SigninLogs' -TotalRetentionInDays 365 -WhatIf

# Switch tables to Basic and set total retention
Set-LogHorizonTableRetention -SubscriptionId '...' -ResourceGroupName 'rg' -WorkspaceName 'ws' `
  -TableName 'AzureDiagnostics','VMConnection' -TargetPlan Basic -TotalRetentionInDays 730

# Use -1 for inherit/default semantics
# RetentionInDays = inherit workspace default
# TotalRetentionInDays = remove long-term retention
Set-LogHorizonTableRetention -SubscriptionId '...' -ResourceGroupName 'rg' -WorkspaceName 'ws' `
  -TableName 'SigninLogs' -RetentionInDays -1 -TotalRetentionInDays -1
Skip the interactive TUI and export straight to a file, useful for pipelines or scheduled runs:
Invoke-LogHorizon -SubscriptionId '...' -ResourceGroup 'rg' -WorkspaceName 'ws' -NonInteractive -Output json -OutputPath ./reports/
If you omit -Output, the analysis object is returned to the pipeline so you can pipe it into your own logic.
The data collection phase (usage, rules, incidents, tables, DCRs) is cached by default so re-running against the same workspace, for example to export a second format or to reopen the TUI, takes seconds instead of minutes. The cache lives under $env:LOCALAPPDATA\LogHorizon\cache (override with -CachePath), one file per combination of subscription, resource group, workspace, -DaysBack, -DetectionLookbackDays, -IncludeDefenderXDR, -IncludeDetectionAnalyzer, the three price parameters and the module version. Entries older than -CacheMaxAgeMinutes (default 60) are ignored, and every save deletes expired entries so the folder does not accumulate files from other parameter sets or older versions. Tokens are never written to the cache; authentication runs on every invocation so the retention wizard always has live credentials.
The cache file is plaintext Clixml. With -IncludeDetectionAnalyzer it contains incident titles, numbers, status and classification from your workspace; incident owners, rule authors and assigned-owner identities are not collected. Use -NoCache on shared machines or point -CachePath at a location with the access control you need.
# Force a fresh collection and refresh the cache
Invoke-LogHorizon -SubscriptionId '...' -ResourceGroup 'rg' -WorkspaceName 'ws' -RefreshCache

# Never read or write the cache
Invoke-LogHorizon -SubscriptionId '...' -ResourceGroup 'rg' -WorkspaceName 'ws' -NoCache

# Accept cached data for up to a day
Invoke-LogHorizon -SubscriptionId '...' -ResourceGroup 'rg' -WorkspaceName 'ws' -CacheMaxAgeMinutes 1440
The interactive TUI includes a Log Tuning / Transforms menu with live tuning suggestions (field usage from your deployed rules and hunting queries), knowledge-base split KQL, and a per-table evaluator. Every KQL block is condition-only and pastes straight into the Sentinel split rule editor, with source attribution (knowledge base, rule analysis, or combined).
Default prices are West Europe Simplified PAYG in USD: 5.59 $/GB Analytics, 1.15 $/GB Basic, 0.20 $/GB Data Lake (0.07 ingestion + 0.13 processing). Each table is priced by the plan observed in the Usage table, and free status comes from Usage.IsBillable. Volumes use billing GB (1000 MB). If your commitment tier is different:
Invoke-LogHorizon -SubscriptionId '...' -ResourceGroup 'rg' -WorkspaceName 'ws' -PricePerGB 4.61 -BasicPricePerGB 1.15 -LakePricePerGB 0.20
| Parameter | Type | Required | Default | Description |
|---|---|---|---|---|
-SubscriptionId | string | Yes | - | Azure subscription ID |
-ResourceGroup | string | Yes | - | Resource group containing the Sentinel workspace |
-WorkspaceName | string | Yes | - | Log Analytics workspace name |
-WorkspaceId | string | No | - | Workspace ID (auto-resolved if omitted) |
-Output | string | No | - | Export format: json, markdown / md, or html (alias -o) |
-OutputPath | string | No | - | File or directory path for export. An existing directory or a trailing separator gets a timestamped file name; a file name without an extension gets the format's extension; missing directories are created |
-Keywords | string[] | No | - | Keywords for gap analysis (e.g. 'AWS','CrowdStrike', alias -kw) |
-IncludeDefenderXDR | switch | No | - | Include Defender XDR custom detection analysis |
-IncludeDetectionAnalyzer | switch | No | - | Include per-rule noisy detection analysis using incidents and automation rules |
-DetectionLookbackDays | int | No | 90 | Query window for incident/automation-based detection analysis (1-365 days) |
-DaysBack | int | No | 90 | Query window for usage data (1-365 days) |
-PricePerGB | decimal | No | 5.59 | Sentinel Analytics tier ingestion price per GB (alias -ppgb) |
-BasicPricePerGB |
So there's four phases.
The module connects to Azure and pulls data from the Log Analytics, Security Insights, Azure Monitor and Microsoft Graph APIs. Every call goes through a retry wrapper (429, 5xx and transport errors) and, unless -NoCache is set, the collected data is cached locally for the next run.
| Data Source | API | What we grab |
|---|---|---|
| Table usage | Usage table (KQL) | Ingestion volume, plan and billable flag per table over your query window |
| Analytics rules | Security Insights REST | Active detection rules + which tables they hit + correlation tags, plus implicit table consumers for non-KQL rule kinds |
| Hunting queries | Log Analytics saved searches REST | Saved hunting queries + referenced tables |
| Data connectors | Security Insights REST | Installed connector inventory |
| SOC optimisation | Security Insights REST (preview) | Microsoft's built-in SOC recommendations |
| Table retention | Log Analytics Tables REST | Per-table retention, archive, plan (Analytics/Basic/Auxiliary), inherited-default flags and schema columns |
| Data collection rules | Azure Monitor REST | DCRs targeting the workspace (subscription list, workspace transformation DCR, associations) and their transforms |
| Defender XDR | Microsoft Graph | XDR custom detection rules (optional; delegated CustomDetection.Read.All or an Az Graph token) |
| Incidents | Security Insights REST | Incident outcomes (status/classification), timing, and rule-linking hints for rule quality scoring |
| Automation rules | Security Insights REST | Rule-level close-incident actions and title matching conditions for auto-close attribution |
| SentinelHealth | Log Analytics KQL | Automation rule run events with incident numbers for definitive auto-close attribution (optional, requires health monitoring) |
Every table gets classified through two passes:
First, a direct lookup against the 481-entry knowledge base in Data/log-classifications.json. Each entry carries the connector name, primary/secondary classification, security category, MITRE data source mappings, a recommended pricing tier and retention, and optional lifecycle flags (deprecated/legacy with replacement tables, XDR streamability, platform).
If there's no match, heuristic rules kick in, in this order:
Alert, Incident, Threat, Signin, Logon, Audit, Risk, Detection (matched at PascalCase word starts) -> primaryFlow, Metric, Diagnostic, Perf, Heartbeat, Health, Inventory, Usage -> secondaryAAD, Microsoft, Azure, Defender, Purview, Entra, Sentinel, Office, Intune, Windows ...) -> primary, flagged for review and addition to the database*Log/*Logs name -> secondaryEach table gets scored on a few dimensions:
tablesWithRules / totalTables * 100. Per-table coverage sums analytics rules + hunting queries found by parsing KQL for table names.Data/implicit-consumers.json maps them (Threat Intelligence matching -> ThreatIntelIndicators/ThreatIntelObjects, Fusion -> SecurityAlert/Anomalies, UEBA -> BehaviorAnalytics/UserPeerAnalytics/IdentityInfo, Microsoft incident creation -> SecurityAlert). Enabled rules of those kinds count toward effective coverage, and each table reports a CoverageSource of kql, xdr, implicit, platform or none. Platform tables Sentinel writes for itself (SecurityIncident, SentinelHealth, Watchlist, Usage ...) are never flagged as missing coverage and get the Platform assessment.Then the module generates recommendations (13 types):
| Type | When it fires | What to do |
|---|---|---|
| Data Lake | Secondary + high cost + few detections, and the table supports the Auxiliary plan (falls back to a Basic plan suggestion when only Basic is supported) | Move to Auxiliary/Data Lake tier; savings are current cost minus the same volume at the lake (or Basic) rate |
| Low Value | High cost + zero detections | Add rules, filter, or move to data lake |
| XDR Optimise | XDR-streamed + 0 Sentinel rules + XDR rules exist | Stop streaming, use the unified XDR portal instead |
| Missing Coverage | Primary + zero detections (not platform tables) | Write analytics rules to get value from the data |
| Ingest-time Filter | Primary + >20 GB + <=3 detections | Apply ingest-time transformation to cut volume |
| Split Candidate | Primary + high volume + detections + no existing transform | Split the table so high-value rows stay on Analytics and the rest goes to Data Lake |
| Plan Usage | Usage rows show more than one plan, or the configured plan differs from what Usage observed | Review whether the plan transition was expected |
| Deprecated Source | A table marked deprecated or legacy in the database is still ingesting | Migrate detections to the replacement tables, then retire the old connector. Informational: no savings are claimed because the ingestion moves rather than disappears |
| Retention Shortfall | Workspace or table retention below the 90-day baseline | Increase total/archive retention to meet regulatory guidance |
| Retention Improvement | Paid, non-platform table meets 90d but sits below the category recommendation | Consider longer total retention |
| Interactive Below Baseline | Analytics table with interactive (hot) retention under 90 days | Raise interactive retention to the 90 days Sentinel includes, unless the short hot window is deliberate |
| XDR Checker | Known Defender XDR table not streamed, streamed without coverage, not forwarded to Data Lake, or below the one-year advisory | Review streaming and retention for XDR telemetry |
| Detection Analyzer | Rule scores >= 70 with at least 5 incidents (with ) |
Recommendations are sorted once, High > Medium > Low and then by estimated savings, and every output (JSON, Markdown, HTML, TUI) keeps that order.
When you pass -IncludeDetectionAnalyzer, the module fetches recent incidents and automation rules, then scores every enabled analytics rule for potential noisiness.
Per-rule metrics (computed from incident data):
| Metric | How it's calculated |
|---|---|
| Incidents total | Count of incidents linked to the rule |
| AutoClose ratio | Incidents closed by automation rules ÷ total incidents. Primary source: SentinelHealth table (automation rule runs by enabled close-incident or playbook rules, matched on incident number). Fallback: automation rule condition matching (analytic rule id, title and severity conditions, ANDed like Sentinel does). Rules whose conditions are only status/tactics/entities are treated as applying to every incident. |
| FalsePositive ratio | Incidents classified as false positive ÷ total incidents |
Noisiness score formula:
Each metric is converted to a percentile rank across all rules that have at least one incident. The composite score is a weighted blend:
Score = (Volume_percentile × 0.35) + (AutoClose_percentile × 0.40) + (FalsePositive_percentile × 0.25)
Score thresholds:
| Score | Label | Meaning |
|---|---|---|
| ≥ 70 | Noisy | Rule likely needs tuning or disabling |
| ≥ 50 | Watch | Rule shows early signs of noisiness |
| < 50 | Healthy | Rule is within normal range |
| N/A | - | Rule has no correlated incidents, or fewer than 3 rules have incidents so there is nothing to rank against |
Incidents are bucketed by analytic rule id (falling back to rule name, then title), so two rules sharing a display name are scored separately.
Rules with a score ≥ 70 and at least 5 incidents are automatically surfaced as High-priority recommendations in the Recommendations view.
The main menu offers these views:
-IncludeDetectionAnalyzer), searchable rule browserData/dictionary.json-IncludeDefenderXDRSitting at Data/log-classifications.json. 481 entries, 243 connectors, 22 categories.
| Field | What it holds |
|---|---|
tableName | Log Analytics table name (SecurityEvent, SigninLogs, etc.) |
connector | Which data connector produces this table |
classification | primary (security value) or secondary (supporting telemetry) |
category | Security category: Identity & Access, Network Security, etc. |
description | Plain-English summary of what's in the table |
keywords | Terms for keyword gap analysis matching |
mitreSources | MITRE ATT&CK data source mappings |
recommendedTier | analytics (hot tier) or datalake (auxiliary candidate) |
recommendedRetentionDays | Minimum recommended total retention in days (regulatory guidance) |
isFree | Whether Microsoft ingests this one for free (runtime uses Usage.IsBillable first) |
status | Optional. deprecated (connector retired or ingestion stopped) or legacy (older collection path with a documented successor) |
replacedBy | Optional. Table names to migrate to; present whenever status is set (may be empty) |
xdrStreamable | Optional, Defender tables only. true for the 21 tables the Defender XDR connector streams; false for portal-only and TVM tables |
platform | Optional. true for tables Sentinel itself consumes (SecurityIncident, Usage, Watchlist, ...) which never need analytics rules |
Tables with a status show a badge in the TUI and the reports, and any that still ingest raise a DeprecatedSource recommendation naming the replacement. Tables with xdrStreamable: false are never treated as XDR streaming candidates by the XDR Checker.
Primary (278 entries): the tables you're actually building detections on. Sign-in logs, security alerts, threat intel, audit trails, vulnerability findings, firewall hits, EDR telemetry.
Secondary (203 entries): supporting stuff. Perf metrics, infrastructure diagnostics, network flow volumes, inventory snapshots, config baselines, health checks.
| Category | Count | Examples |
|---|---|---|
| Identity & Access | 51 | SigninLogs, MicrosoftServicePrincipalSignInLogs, OktaSSO |
| Network Security | 49 | AZFWNetworkRule, NSPAccessLogs, DarktraceModelAlerts_CL |
| Cloud Control Plane | 37 | AzureActivity, AZKVAuditLogs, GoogleWorkspaceReports |
| Network Flow | 36 | NTANetAnalytics, CommonSecurityLog, AZFWFatFlow |
| Endpoint Detection | 33 | DeviceProcessEvents, CrowdStrikeAuditEvents, SentinelOneAlertsV2_CL |
| Application Logs | 32 | AppServiceHTTPLogs, AppServiceAuditLogs, DynatraceAttacksV2_CL |
| Email Security | 29 | EmailEvents, CampaignInfo, Ttp_Url_CL |
| Security Alerts | 29 | SecurityAlert, SentinelBehaviorInfo, DisruptionAndResponseEvents |
| Vulnerability Mgmt | 23 | DeviceTvmSoftwareVulnerabilities, Rapid7InsightVMCloudVulnerabilities |
| Cloud Security | 20 | EnrichedMicrosoft365AuditLogs, OAuthAppInfo, PowerAppsActivity |
| Endpoint Telemetry | 18 | DeviceInfo, Windows365NetworkLogs, SentinelOneAgents_CL |
| Posture Management | 17 | ExposureGraphNodes, SecurityNestedRecommendation, ZTSMetadata |
| Data Security | 16 |
Data/basic-plan-tables.json and Data/auxiliary-plan-tables.json list the built-in tables that the Azure Monitor table feature matrix marks as supporting the Basic and Auxiliary (Data Lake) plans. The retention wizard uses the Basic list to validate plan switches, and the DataLake recommendation only proposes the lake tier for tables that support it, falling back to a Basic plan suggestion where that is the lowest supported tier. DCR-based custom tables support both plans; Classic custom tables support neither. Both files are regenerated from that matrix for each release.
You can provide your own classification file to add entries for tables not in the built-in database, or override existing entries when the defaults don't match your environment. Custom entries take precedence over built-in ones when the same tableName appears in both.
Invoke-LogHorizon -SubscriptionId '...' -ResourceGroup 'rg' -WorkspaceName 'ws' `
    -CustomClassificationPath './my-classifications.json'
The custom file uses the same schema as Data/log-classifications.json, an array of objects:
[
  {
    "tableName": "MyCustomApp_CL",
    "connector": "Custom Logs (DCR)",
    "classification": "primary",
    "category": "Application Logs",
    "description": "Security-relevant audit events from an internal application",
    "keywords": ["custom", "internal", "audit"],
    "mitreSources": [],
    "recommendedTier": "analytics",
    "isFree": false
  },
  {
    "tableName": "AzureMetrics",
    "connector": "Azure Monitor",
    "classification": "primary",
    "category": "Infrastructure Diag",
    "description": "Override: promoted to primary because we detect on Azure resource metrics in this environment",
    "keywords": ["metrics", "azure", "infrastructure", "monitoring"],
    "mitreSources": [],
    "recommendedTier": "analytics",
    "isFree": false
  }
]
See Data/custom-classifications-example.json for a ready-to-use template.
The primary/secondary grading was done partially by the author and then by feeding Microsoft's data connector and table definitions into AI with a human grading baseline, using Microsoft best practices and industry standards as the classification criteria.If something looks off for your environment, trust your own context over the tool - AI can make mistakes, and context is king.
The classification criteria were drawn from the following sources:
ACSC (Australian Signals Directorate, Australian Cyber Security Centre)
CISA (Cybersecurity and Infrastructure Security Agency)
Microsoft
MITRE
NIST (National Institute of Standards and Technology)
NSA (National Security Agency)
NCSC-UK (National Cyber Security Centre - United Kingdom)
Google Cloud
LogHorizon.psd1              Module manifest (v0.9.0)
LogHorizon.psm1              Module loader
Public/
  Invoke-LogHorizon.ps1              Entry point, the main orchestrator
  Set-LogHorizonTableRetention.ps1   Scriptable table retention and plan changes
Private/
  Connect-Sentinel.ps1       Azure auth + workspace resolution
  Get-TableUsage.ps1         KQL query for ingestion volumes
  Get-AnalyticsRules.ps1     Analytics rules + table/field extraction + correlation tags
  Get-HuntingQueries.ps1     Hunting queries + table extraction
  Get-DataConnectors.ps1     Data connector inventory
  Get-DataTransforms.ps1     DCR transform discovery, split KQL generation
  Get-DefenderXDR.ps1        Defender XDR analysis (optional)
  Get-Incidents.ps1          Incident fetch + SentinelHealth auto-close attribution
  Get-AutomationRules.ps1    Automation rule inventory + close-logic attribution
  Get-SocOptimization.ps1    SOC improvement recommendations
  Get-TableRetention.ps1     Per-table retention, archive, and plan type
  Get-CollectionCache.ps1    Collection cache (key, path, read, write)
  Get-LogHorizonEndpoint.ps1 ARM / Log Analytics / Graph endpoints for the signed-in Azure environment
  Get-LogHorizonDictionary.ps1 Loads the term dictionary shown by the Dictionary menu
  Invoke-AzRestWithRetry.ps1 REST wrapper: retry on 429/5xx/transport errors, async operation polling
  Invoke-Classification.ps1  Static DB + heuristic classification + _SPLT_CL detection + custom file validation
  Invoke-Analysis.ps1        Cost-value matrix + recommendations + Detection Analyzer + XDR Checker + split suggestions
  Set-TableRetention.ps1     Retention change set, preview, Tables API apply engine, plan support lookups
  Write-Report.ps1           Spectre.Console TUI rendering
  Export-Report.ps1          JSON / Markdown / static HTML export with shared section renderer
Data/
  log-classifications.json              481-entry classification knowledge base
  basic-plan-tables.json                Built-in tables that support the Basic plan (from the Azure Monitor feature matrix)
  auxiliary-plan-tables.json            Built-in tables that support the Auxiliary / Data Lake plan
  implicit-consumers.json               Non-KQL rule kinds to tables, plus platform tables
  dictionary.json                       Term definitions for the Dictionary menu (kept 1:1 with this README, enforced by tests)
  high-value-fields.json                Split KQL knowledge base: 165 tables with curated fields and split hints
  field-frequency-stats.json            Community field frequency stats mined from the Azure-Sentinel rule corpus
  custom-classifications-example.json   Example custom classification override file
  ReportTemplate.html                   Static HTML report template (pure-CSS tabs, zero JS, CSP meta)
Tests/
  LogHorizon.Tests.ps1       437 Pester v5 unit tests
The split KQL knowledge bases, high-value-fields.json and field-frequency-stats.json, are built offline from the public Azure/Azure-Sentinel repository (Solutions/, Detections/, Hunting Queries/, roughly 3,800 YAML rule files). Each query is run through the same Get-TablesFromKql and Get-FieldsFromKql the module uses at runtime to build per-table field frequency counts, from which three tiers of fallback fields are derived:
TimeGenerated)Mined fields are merged into the curated high-value-fields.json (curated entries are kept, newly discovered tables with at least 3 rules and 3 meaningful fields are added).
At runtime, Get-SplitKql uses a fallback hierarchy: curated KB entry -> live rule/hunting field analysis -> community per-table stats -> category defaults -> universal fields. Frequency of fields is not a perfect method, but it's useful to know.
437 Pester v5 tests, no Azure connectivity required. Run them from a plain PowerShell session rather than the VS Code integrated terminal:
Invoke-Pester ./Tests/LogHorizon.Tests.ps1 -Output Detailed
GPL-3.0. See LICENSE.
| Version | Date | Changes |
|---|---|---|
| 0.9.0 | 2026-09-06 | Remediation release from a full code and data review. Correctness: plan-aware pricing from Usage.Plan and Usage.IsBillable with Basic and Data Lake rates and billing GB (1000 MB), Detection Analyzer auto-close attribution restricted to enabled close/playbook rules (triggeringLogic.isEnabled), incidents via 2025-09-01 with $top=1000, implicit coverage for non-KQL rule kinds and platform tables (implicit-consumers.json), interactive-retention baseline check, single recommendation sort. Transforms: DCR discovery at subscription scope filtered on destination workspace plus the workspace transformation DCR and associations, with a visible status and warning when a permission is missing; workspace and multi-stage transform parsing; split KQL intersected with the live table schema. Robustness: collection cache on by default (-NoCache, -RefreshCache, -CacheMaxAgeMinutes, -CachePath), authentication before the spinner with warnings printed afterwards, escaped TUI and Markdown output, export path resolution that creates directories and returns the written path, CSP meta in HTML, REST retries on transport errors and Location-style async completion, workspace resolution over REST (Az.Resources dropped), custom classification validation, PascalCase-aware heuristics with a Microsoft first-party fallback, regex timeouts. Endpoints follow the signed-in Azure environment (Government, China) and API versions moved to SecurityInsights 2025-09-01, OperationalInsights 2025-07-01, recommendations 2025-10-01-preview. Data: classification database 345 -> 481 entries with status/replacedBy/xdrStreamable/platform keys, 80+ first-party and 35 successor tables, connector label fixes, isFree corrections; regenerated basic-plan-tables.json and new auxiliary-plan-tables.json from the Azure Monitor table feature matrix; DeprecatedSource recommendation, plan-aware Data Lake recommendation with Basic fallback, XDR Checker honours streamability, lifecycle badges in TUI and exports. Review pass: cache key covers pricing and module version, custom classification booleans and tiers parsed rather than cast, severity-aware auto-close attribution, split KQL predicates checked against the live schema, XDR fetch status surfaced instead of a silent , output paths without an extension are files, incident owner identities no longer collected. Dictionary menu in the TUI with every term the tool uses, backed by and pinned to the code by tests. Automation rule and Defender custom detection objects are projected to the consumed fields, so author identities (createdBy, lastModifiedBy, assigned owners) never reach the cache or exports. GPL-3.0 licence. 437 tests |
To enable UTF-8 output in your terminal, add the following line at the top of your PowerShell $PROFILE file and restart the terminal:
$OutputEncoding = [console]::InputEncoding = [console]::OutputEncoding = [System.Text.UTF8Encoding]::new()
The module sets this automatically on import, but depending on your session the warning may still appear. It's cosmetic and doesn't affect functionality.
If you have issues or want to contribute, create a PR.

| XDR Checker | Adds an XDR-focused advisory layer: streaming coverage checks and one-year Data Lake retention guidance for XDR-related telemetry |
| Custom Classifications | Provide your own JSON to add or override the built-in classification database |
| Collection Cache | Collected workspace data is cached locally (default 60 minutes) so re-runs and re-exports take seconds; opt out with -NoCache |
| Sovereign Clouds | ARM, Log Analytics and Graph endpoints follow the signed-in Azure environment (public, US Government, China) |
| Interactive TUI | Spectre.Console dashboard with menus, colour-coded tables, drill-downs, retention wizard and ASCII art |
| Export | JSON, Markdown, or static HTML report for sharing with the team |
| decimal |
| No |
| 1.15 |
| Basic Logs price per GB |
-LakePricePerGB | decimal | No | 0.20 | Auxiliary / Data Lake tier price per GB (ingestion + processing) |
-NonInteractive | switch | No | - | Skip the TUI dashboard and export directly (or return data to pipeline if -Output is omitted) |
-CustomClassificationPath | string | No | - | Path to a custom JSON file to add or override classifications (alias -clf) |
-NoCache | switch | No | - | Do not read or write the collection cache |
-RefreshCache | switch | No | - | Collect fresh data and overwrite the cache entry |
-CacheMaxAgeMinutes | int | No | 60 | Maximum age of a cache entry to reuse (1-10080) |
-CachePath | string | No | $env:LOCALAPPDATA\LogHorizon\cache | Directory for cache files |
-IncludeDetectionAnalyzer| Tune or disable the noisy rule |
PurviewDataSensitivityLogs, DataSecurityEvents, PowerPlatformDlpActivity |
| Data Platform | 16 | SQLSecurityAuditEvents, CDBControlPlaneRequests, SnowflakeLogin_CL |
| Platform Health | 14 | SentinelHealth, Usage, SecurityCaseEvent |
| Container & K8s | 13 | AKSAudit, CloudProcessEvents, GKEAudit |
| Infrastructure Diag | 13 | AzureMetrics, AGWPerformanceLogs, ContainerAppSystemLogs |
| Threat Intelligence | 10 | ThreatIntelIndicators, ThreatIntelObjects, CybleVisionAlerts_CL |
| Configuration Mgmt | 8 | ConfigurationData, AVNMRuleCollectionChange |
| SAP Security | 7 | ABAPAuditLog, SAPBTPAuditLog_CL, Onapsis_Defend_CL |
| Storage Access | 6 | StorageBlobLogs, CloudStorageAggregatedEvents, AWSS3ServerAccess |
| IoT/OT Security | 4 | RadiflowEvent, DragosAlerts_CL, Phosphorus_CL |
$nullData/dictionary.json| 0.8.0 | 2026-05-26 | Added interactive table retention management with a new bulk TUI flow and single-table update entry point, plus the public Set-LogHorizonTableRetention command. Added Tables API PATCH apply engine with validation, Azure async-operation polling, and two-step fallback (combined PATCH, then plan-only plus retention-only) for resilient retention updates. Added focused Pester coverage for validation, payload shape, fallback, and public command mapping. Also fixes an edge-case/bug where users would get recommendations to change data lake tables to data lake tier if they had analytics data still in Sentinel |
| 0.7.1 | 2026-05-15 | Added plan-awareness from Usage.Plan without replacing the configured table plan: analysis now tracks observed plan history, flags multi-plan usage and configured-vs-observed mismatches, and surfaces plan data in the dashboard, table drill-down, View All Tables, retention assessment, and exports. Fixed Detection Analyzer auto-close attribution so the timing heuristic only applies when no enabled automation rules exist. 203 tests passing |
| 0.7.0 | 2026-04-16 | Detection Assessment updated with cost-value matrix summary table (Primary/Secondary x7 assessment categories with color coding), drill-down submenu for primary/secondary tables with cost/detection tier columns. Detection Analyzer updated with GB-weighted volume coverage bars (detection/hunting/combined GB as percentage of total ingestion alongside existing table-count bars). Adaptive display improvements for Detection Analyzer (dynamic bar width, rule name truncation, conditional column hiding based on console width). 193 tests passing |
| 0.6.3 | 2026-04-11 | Minor update for PSGallery |
| 0.6.2 | 2026-04-11 | Log Tuning / Transforms menu: live data tuning analysis (per-table field usage from deployed rules/hunting queries, filter/project/combined KQL generation, savings estimates), schema column extraction from Tables API, Get-SplitKql fallback hierarchy (community stats → category defaults → universal fields), comprehensive table evaluator with field usage matrix, unified KB + live tuning export sections, Build-FieldKnowledgeBase.ps1 mining script for Azure-Sentinel GitHub rule corpus. Detection Analyzer: SentinelHealth-based auto-close attribution (primary) with operator-aware rule-matching fallback, Boolean condition wrapper parsing, Resolved status detection, GUID-tail matching for ARM resource IDs. Coverage now table-count-based across all tables (including free tier). Scoring disclaimer added to TUI and exports. 174 tests |
| 0.6.1 | 2026-04-10 | Bug fixes: $kqlKeywords filtering now shared at file scope (was undefined in Get-TablesFromKql), [CmdletBinding()] added to all helper functions, Defender unified check simplified, removed ghost -RuleCount test param. Robustness: Get-HuntingQueries pagination, Invoke-AzRestWithRetry retry wrapper with exponential backoff for 429/5xx, PricePerGB validation, Write-Verbose in key functions. Docs: version badge, DB count, prerequisites aligned with manifest |
| 0.6.0 | 2026-04-10 | Dynamic XDR streaming detection with 21 KnownXDRTables (was hardcoded 18), per-table XDRState (NotStreaming/Analytics/Basic/Auxiliary), Auxiliary recognized as data lake tier, not-streamed XDR tables surfaced as Information/Low recommendations with NotStreamedCount, retention analyzer shows not-streamed XDR tables as "XDR only (30d)", overview tier breakdown (analytics/basic/data lake + not streamed), Export-Report Auxiliary→"data lake" labels, classification DB updated to 345 entries (+DeviceNetworkInfo, DeviceInfo→secondary/datalake, DeviceImageLoadEvents and IdentityQueryEvents→datalake tier), 15 new Pester tests (121 total) |
| 0.5.0 | 2026-04-03 | Static HTML export with pure-CSS tabs (zero JS, no CDN, fully self-contained), unified MD/HTML section renderer, complete JSON data capture (dataTransforms, correlationExcluded/Included, streamingTables), -NonInteractive switch for CI/pipeline usage, md format alias, datetime-stamped auto-filenames, full KQL display in DCR transforms (no truncation), multiline KQL handling in markdown tables, fixed regex $-backreference corruption in HTML token replacement, renamed internal helpers to avoid PowerShell alias conflicts (h→hEnc, md→mdEsc), 33 new Pester tests (106 total) |
| 0.4.1 | 2026-04-03 | Security & stability fixes - added token memory sanitization, output path validation & XSS protection, REST API pagination limits, fixed module loader error masking, and resolved PSScriptAnalyzer warnings |
| 0.4.0 | 2026-04-02 | Transform discovery (DCR listing + transform type classification), split table detection (_SPLT_CL), split KQL helper with 15-table knowledge base (high-value-fields.json) + rule-analysis fallback, portal-ready condition-only KQL output, expandable recommendations list, split KQL suggestions TUI menu |
| 0.3.0 | 2026-04-02 | Log retention compliance analysis (CISA M-21-31, NIST SP 800-92, NCSC-UK, ASD ACSC, NSA), correlation tag detection (#DONT_CORR#/#INC_CORR#), retention assessment menu view, retention column in All Tables, recommendedRetentionDays in classification schema |
| 0.2.2 | 2026-04-02 | SOC optimization table hides Detail column on narrow consoles |
| 0.2.1 | 2026-04-02 | Custom classification support (-CustomClassificationPath), enriched SOC optimization recommendations with API suggestions/drill-down, active-only default view, UTF-8 encoding warning suppression |
| 0.2.0 | - | Initial public release with classification engine, cost-value scoring, Spectre.Console TUI, export to JSON/Markdown |
| 0.1.0 | - | Internal version for development |

