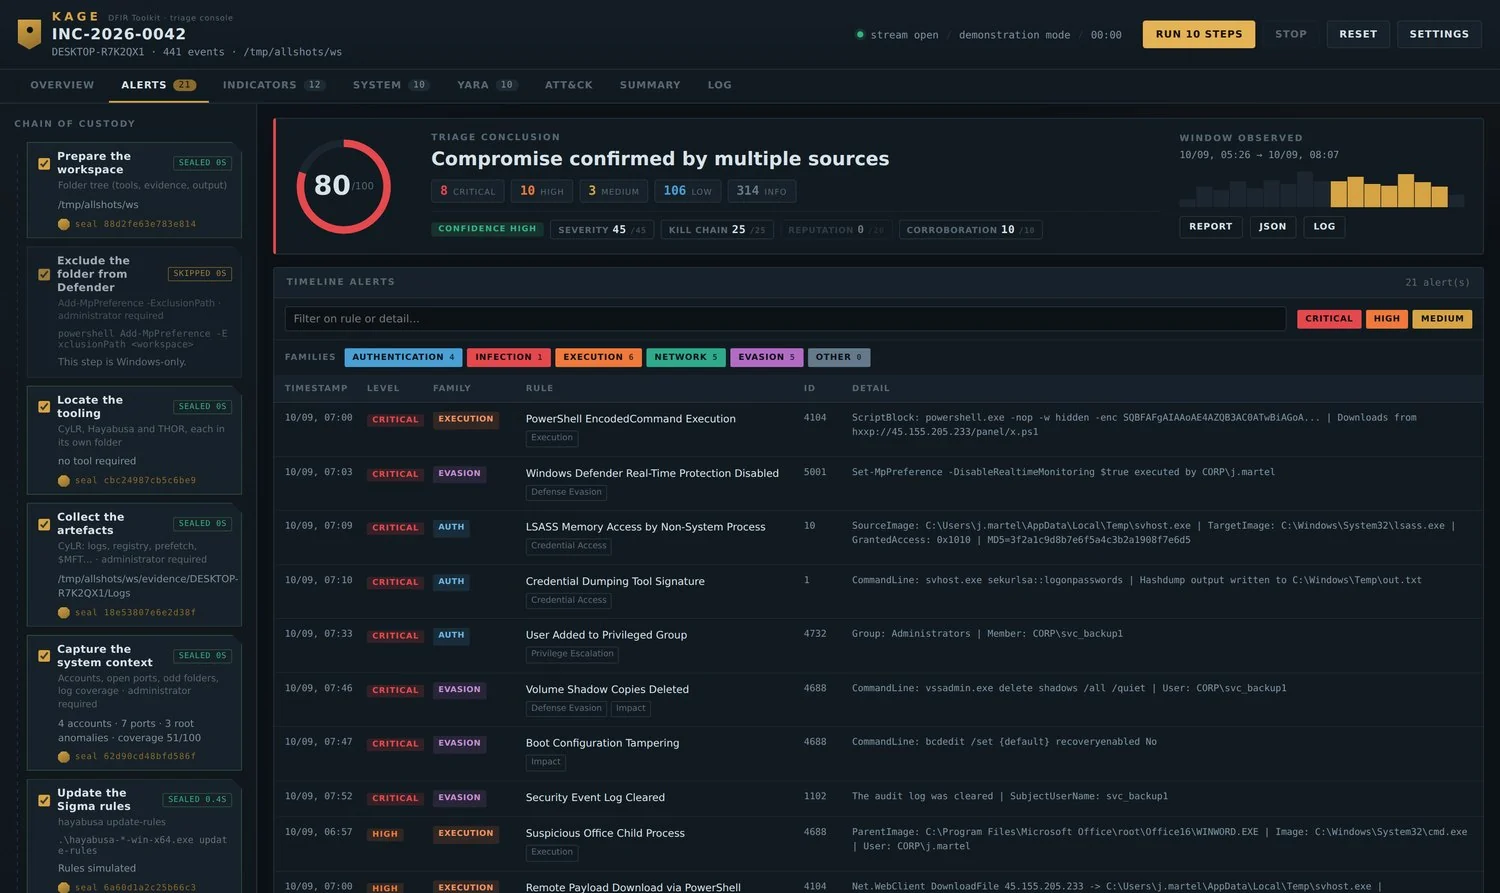

Windows host DFIR triage console that chains artefact collection, Sigma-correlated timelines, YARA scans, socket and account inspection, indicator enrichment, and a calibrated risk score.
Point Kage at a suspect Windows host and it runs the whole triage in one chain: CyLR collects the artefacts, Hayabusa correlates the event logs against Sigma, THOR Lite scans for YARA matches, VirusTotal and AbuseIPDB qualify the indicators, and the AI provider of your choice drafts the write-up. Every stage streams live, seals what it produced, and can be replayed alone.
pip install -r requirements.txt
python -m dfirconsole # → http://127.0.0.1:8787
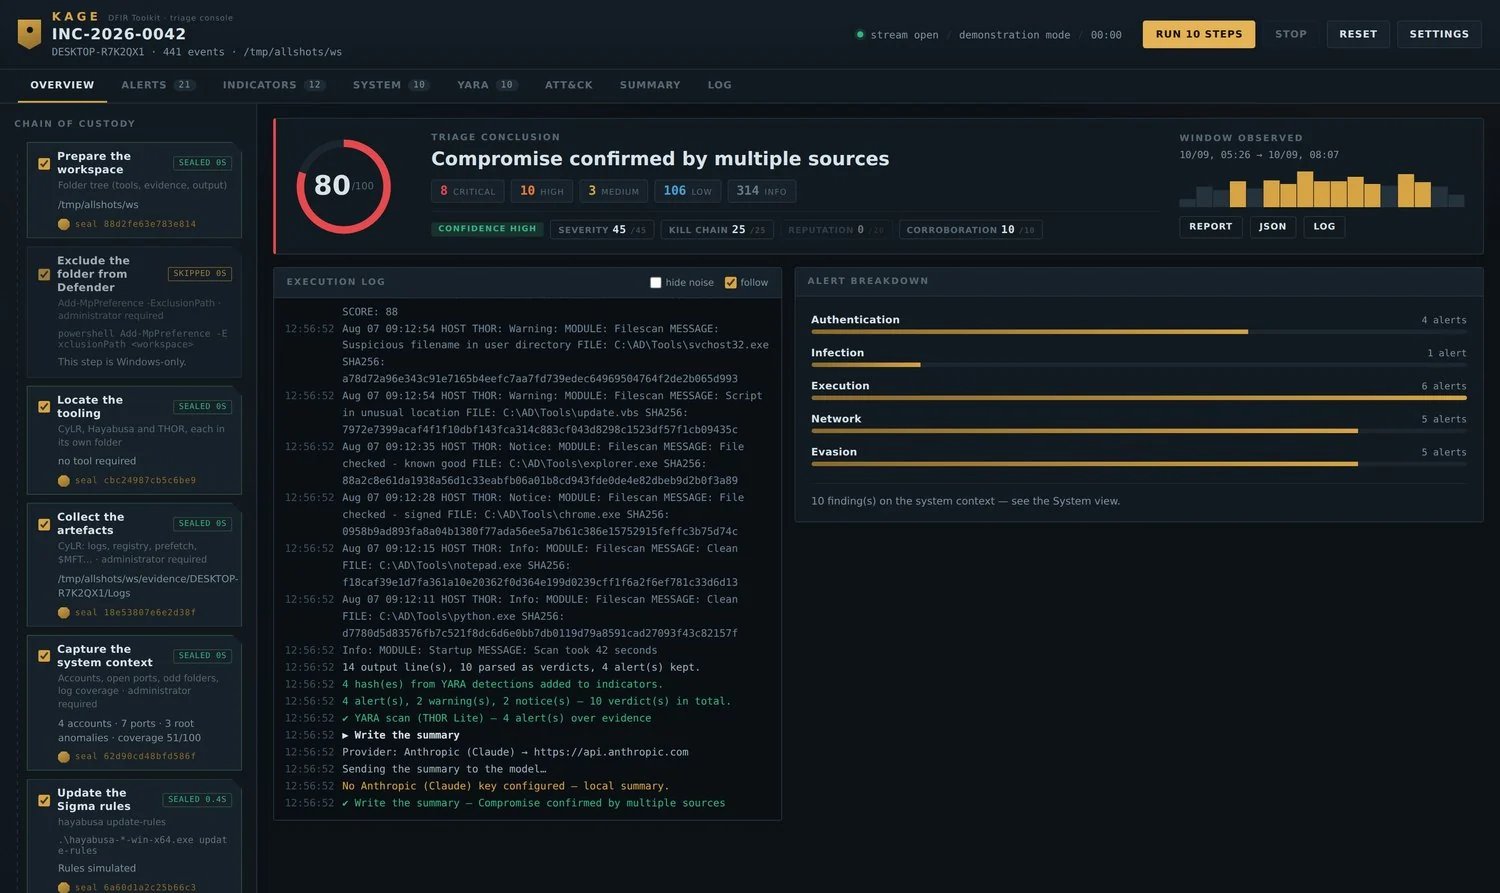
The overview: eleven sealed steps on the left, the execution log
streaming, and the score broken into its four components.
| OS | Windows 10 / 11 or Windows Server |
| Python | 3.10+ from python.org, installed for all users |
| Rights | Administrator |
| Disk | a few GB free for the collection |
# 1. Extract Kage anywhere — Desktop, C:\Kage, a USB stick, it does not matter
cd C:\Kage
# 2. Install the dependencies
pip install -r requirements.txt
# 3. Check the environment before touching a host
python preflight.py
preflight.py reports what is ready and what is missing.
Workspace : C:\Kage
System : Windows 11
Python : 3.12.3
Dependencies
[ok] module fastapi
[ok] module uvicorn
[ok] module httpx
Rights and disk space
[ok] console running as administrator
[ok] free space: 84.2 GB
Tooling
[!] CyLR in C:\Kage\tools\cylr
→ the "Locate the tooling" step downloads it
[!] THOR Lite
→ optional step — it will simply be skipped
python -m dfirconsole
Or right-click launch.bat → Run as administrator, which handles the
virtualenv, the install and opens the browser for you.
Kage DFIR Toolkit 1.5.0
code C:\Kage\dfirconsole
workspace C:\Kage
open http://127.0.0.1:8787
The workspace is wherever you launched from. Nothing to configure. Tools, evidence and output all land next to the console.
python -m dfirconsole --demo
Demonstration mode builds a synthetic intrusion — malicious attachment, encoded PowerShell, Defender disabled, credential theft, persistence, C2, shadow copies deleted — and runs the entire chain on it. Nothing on your machine is touched. The best way to learn the interface before a real incident.
Launch as administrator, open http://127.0.0.1:8787, and check the status bar
reads live run · Windows and not demonstration mode.
Click Settings:
| Field | Example | Why it matters |
|---|---|---|
| Case reference | INC-2026-0042 | names the report, the log and the archive |
| Analyst | N. Delaunay | appears on the report header |
Leave Workspace folder empty it tracks the launch folder on its own. Click Save.
The left column is the chain of custody. Every step has a checkbox; all are ticked by default except the YARA scan.
For a first run, untick everything except:
☑ Prepare the workspace
☑ Exclude the folder from Defender
☑ Locate the tooling
☑ Update the Sigma rules
Click Run 4 steps. About a minute. This downloads CyLR and Hayabusa and confirms your elevation actually works before anything long begins.
Once those four are sealed, tick the rest:
☑ Collect the artefacts CyLR — a few minutes, several GB
☑ Capture the system context accounts, sockets, disk root, log coverage
☑ Build the timeline Hayabusa correlates against Sigma
☑ Analyse the timeline score, alert families, indicators
Click Run and watch the execution log stream. Each finished step gets a seal — a SHA-256 you can verify later.
| Where | What you get |
|---|---|
| Overview | risk score with its four components, alerts by family |
| Alerts | every alert, filterable by severity and family |
| System | accounts, sockets tied to processes, odd folders, log coverage |
| Indicators | hashes, IPs and domains extracted from the timeline |
Click any table row to open the reading pane: every field, the full command
line, all raw data. ← → to move between items, Esc to close.
With API keys configured:
☑ Enrich the indicators VirusTotal + AbuseIPDB reputation
☑ Write the summary the AI drafts the report
Without keys, both are marked skipped and a local write-up is produced instead — same structure, no network call.
Top right of the dashboard:
💡 Replay a single step: double-click its tag in the left column. Useful when Hayabusa fails but the collection is fine — no need to collect twice.
The YARA scan is the one step Kage cannot set up for you. Nextron requires registration, so the binary cannot be fetched by a script. CyLR and Hayabusa download themselves; THOR does not.
Register and download at
nextron-systems.com/thor-lite.
You receive the scanner and a licence file (.lic) — usually by email.
tools\thor\Kage already created that folder for you at first launch. Copy the archive's contents into it, keeping everything together:
C:\Kage\
└── tools\
└── thor\ ← everything goes here
├── thor64-lite.exe the scanner
├── yourname.lic the licence — THOR will not start without it
├── config\ from the archive
├── signatures\ from the archive — the YARA rules themselves
└── custom-signatures\ from the archive
Why keep them together? THOR runs from the directory holding its executable and resolves its signatures relative to that directory. Copying the binary alone gives you a scanner with nothing to scan for.
The other two tools live beside it, each in its own folder:
tools\
├── cylr\ CyLR.exe ← downloaded automatically
├── hayabusa\ hayabusa-<version>.exe ← downloaded automatically
└── thor\ thor64-lite.exe + .lic ← you place this one
python preflight.py
Tooling
[ok] CyLR in C:\Kage\tools\cylr
[ok] Hayabusa in C:\Kage\tools\hayabusa
[ok] THOR Lite: C:\Kage\tools\thor\thor64-lite.exe
[ok] THOR licence file (*.lic)
If the licence line shows [!], THOR will start and stop immediately.
Settings → YARA scan folder:
| Value | Scans | Takes |
|---|---|---|
| (empty) | the artefacts CyLR just collected | minutes |
C:\Users\target | one user profile | minutes |
C:\ | the whole system volume | hours |
Tick YARA scan in the chain and run it. Verdicts appear live as files are examined — alerts, warnings, notices and clean files, each with its hash.
No time limit by default. A three-hour sweep is a decision, not an anomaly. Set one in minutes if you want a ceiling.
Without THOR, the step reports itself as skipped and the chain carries on. You lose the YARA axis of the score — nothing else.
Eleven steps. Tick what you need, double-click a tag to replay one alone.
| # | Step | What actually runs |
|---|---|---|
| 01 | Prepare the workspace | folder tree, elevation and free-space check |
| 02 | Exclude from Defender | Add-MpPreference -ExclusionPath <workspace> |
| 03 | Locate the tooling | resolves and downloads CyLR + Hayabusa from GitHub releases |
| 04 | Collect the artefacts | CyLR.exe -od evidence\ -of <case>.zip -v |
| 05 | Capture the system context | systeminfo · Get-LocalUser · netstat -ano · tasklist · auditpol |
| 06 | Update the Sigma rules | hayabusa update-rules |
| 07 | Build the timeline | hayabusa <csv|dfir>-timeline -d <Logs> -o hayabusa-output.csv -r <rules> |
| 08 | Analyse the timeline | score, alert families, indicator extraction |
| 09 | YARA scan (optional) | thor64-lite.exe --nocsv -p <chosen folder> |
| 10 | Enrich the indicators | VirusTotal v3 · AbuseIPDB v2 |
| 11 | Write the summary | your AI provider, or a local write-up |
The Hayabusa subcommand is read from its own help output, so v3
(csv-timeline) and v4 (dfir-timeline) both work, and unsupported flags are
dropped rather than failing the command.
A triage priority, not a proof — and never published without its breakdown.
80 / 100 Compromise confirmed by multiple sources
CONFIDENCE HIGH · 441 events analysed
SEVERITY 45 / 45 8 critical, 10 high, 3 medium
KILL CHAIN 25 / 25 10 ATT&CK tactics, 7 decisive
REPUTATION 0 / 20 no indicator confirmed externally
CORROBORATION 10 / 10 3 YARA detections · 3 active connections to public hosts
Four independent axes, each capped. That is what stops one noisy rule firing three hundred times from reaching the same verdict as a genuine multi-stage intrusion.
Confidence is separate from severity. It counts how many independent sources agree and whether logging coverage was sufficient — so a high score built on Sigma alone reads as a strong lead, never a confirmation:
| Score | Confidence high | Confidence low |
|---|---|---|
| ≥ 70 | Compromise confirmed by multiple sources | Compromise highly likely — corroboration still limited |
| ≥ 45 | Likely compromise — containment recommended | Strong indications from a single source |
| ≥ 25 | Suspicious activity requiring qualification | |
| ≥ 10 | Weak signals, no established compromise | |
| < 10 | Nothing conclusive |
Recomputed each time a new source lands — after the timeline, after YARA, after enrichment.

Severity says how urgent. Families say what kind.
FAMILIES AUTHENTICATION 4 INFECTION 1 EXECUTION 6
NETWORK 5 EVASION 5 OTHER 0
TIMESTAMP LEVEL FAMILY RULE ID
09/09 10:26 CRITICAL EVASION Windows Defender Disabled 5001
09/09 11:09 CRITICAL EVASION Volume Shadow Copies Deleted 4688
09/09 11:15 CRITICAL EVASION Security Event Log Cleared 1102
09/09 10:32 CRITICAL AUTH LSASS Memory Access 10
Classified by event ID first, wording second. When the two disagree, the text
wins: a 4688 is a process creation, but vssadmin delete shadows belongs
under Evasion, because that is where an analyst will look for it.
The family counts always match the table. Computed over the alerts that actually reach the list — a badge promising rows you cannot find is a bug, not a detail.
The histogram follows the selection. With one family active, the observed window is redrawn in that family's colour and a tick marks its busiest moment.
The triage does not flag itself. THOR writes to the Windows event log while it runs, and scanning a folder of offensive binaries makes Hayabusa flag our own scanner. Those events are excluded, counted apart, and the total reported.

What no event log tells you, captured read-only:
NETWORK — 7 listening, 4 established, 8 flagged
RISK PROTO LOCAL REMOTE PROCESS
HIGH TCP 10.20.4.11:52233 45.155.205.233:8443 powershell.exe
→ active connection to the Internet · powershell.exe should not
open a socket · remote port 8443 associated with offensive tooling
HIGH TCP 0.0.0.0:3389 — TermService.exe
→ exposed listener on RDP
ROOT C:\ — 3 flagged entries
HIGH C:\Tools folder created 0 day(s) ago
→ non-standard entry at the disk root · name suggests tooling
HIGH C:\Temp folder → frequently abused location
Every socket is matched to its owning process by PID — that cross-reference
is what makes powershell.exe holding a connection to a public host readable at
a glance.
Local accounts are checked for Administrators membership, dormant-but-enabled state and last logon. Public addresses from established connections join the indicator list automatically: an address being talked to during triage is worth at least as much as one read from a three-day-old log entry.
A triage is only worth what the machine agreed to record.
LOGGING & AUDIT — coverage 51/100 · partial coverage
Blind spots: Sysmon · PowerShell (script blocks) · Process creation
· Credential validation
STATE CHANNEL IMPORTANCE EVENTS
ACTIVE Security critical 84 213
MISSING Sysmon critical —
EMPTY PowerShell (script blocks) critical —
ACTIVE System important 12 045
DISABLED WinRM important —
Sixteen channels classified active / empty / disabled / missing — the
distinction matters: an empty channel is one command away from fixed, a missing
one needs a deployment. Thirteen auditpol subcategories read alongside.
The coverage score sits next to the risk score. Risk 80, coverage 51 means the verdict rests on half the available information — and the report says so.

8 verdicts
VERDICT DETECTION FILE HASH SCORE
ALERT YARA rule HKTL_Rubeus C:\AD\Tools\Rubeus.exe 9c4133ee… 100
ALERT YARA rule HKTL_AmsiTrigger C:\AD\Tools\AmsiTrigger.exe af7af55c… 95
ALERT YARA rule PS_Reverse_Shell C:\AD\Tools\PowerShellTcp… ab1e98e8… 80
WARNING Suspicious filename C:\AD\Tools\svchost32.exe 6b6f1901… —
NOTICE File checked - signed C:\AD\Tools\chrome.exe c5a10bff… —
CLEAN Clean C:\AD\Tools\notepad.exe 20eded6a… —
The page fills up during the scan, not only when something is found. That is what separates found nothing from looked at nothing.
The scan starts at the first real finding. THOR opens every run with a dozen banner lines — version, build, hostname, working directory, argument list, uptime — and closes with a summary. None of it describes the host being examined, so none of it reaches the view. Hashes from alerts are pushed into the indicator list, ready for VirusTotal.
Each completed step is sealed with a SHA-256, and the seal states what it covers:
✔ Analyse the timeline SEALED 0.1s
seal 31d1991a65598de8 — content of hayabusa-output.csv
✔ Exclude the folder from Defender SEALED 6.2s
seal 8f2c04b71ae93d55 — execution record (no file produced)
When a step produced files, the seal is the hash of their contents — rerun it later and you have proof the artefact was not altered. When it produced none, the seal covers only the execution record, and says so rather than implying more.
Every view has its own URL, reloads nothing and loses nothing — the analysis lives server-side and a full refresh restores it.
| Address | Content |
|---|---|
/ | pipeline, execution log, breakdown by family |
/alerts | alerts by severity and family |
/indicators | indicators with VirusTotal / AbuseIPDB reputation |
/system | machine, accounts, network, disk root, coverage |
/yara | THOR verdicts, live during the scan |
/attack | inferred ATT&CK tactics |
/summary | written report |
/log | full log, downloadable |

Every command streams as it runs. Steps seal one by one; the clock stops when the chain does.

Hashes, IPs and domains pulled from the timeline, from active sockets, and from YARA hits — each with its reputation once enrichment has run.


Any row, anywhere, opens in full: every field, the complete command line, the
raw THOR data. ← → to move between items, Esc to close, Copy for JSON.

Observed facts separated from assessed ones, calibrated language, and an explicit evidence-gaps section naming what the logging could not have shown.


/api/report.html — self-contained, dark, thirteen numbered sections, ready to
print to PDF. No external resource: it stays readable in ten years on an offline
machine.

The score never appears without its four components, so a reader can challenge one axis rather than an opaque number.


Every step with its seal and what that seal covers — the content of a named file, or the execution record alone.
When printing to PDF, tick Background graphics in the browser options, otherwise the dark background is dropped.
Each tool owns a folder, and each ships with a README explaining what goes in it.
<workspace>/
├── tools/
│ ├── cylr/ CyLR.exe ← downloaded automatically
│ ├── hayabusa/ hayabusa-<version>.exe ← downloaded automatically
│ └── thor/ thor64-lite.exe + .lic ← manual, registration required
├── evidence/ collection archive, unpacked
└── output/ timeline, logs, enrichment cache
CyLR and Hayabusa install themselves. The Locate the tooling step queries the GitHub releases API, picks the current Windows x64 asset and unpacks it into the right folder. Pinning a version means the download breaks the day upstream moves on; resolving it means the console keeps working unattended. A pinned URL takes over if the API is unreachable.
Everything works without a single key. Unconfigured steps are marked skipped, never failed.
Where credentials go. The repository ships apikeys.env.example, a template
with empty values. Copy it, keep the copy local:
copy apikeys.env.example apikeys.env
notepad apikeys.env
# apikeys.env — sits next to launch.bat
VT_API_KEY=your_virustotal_key
ABUSEIPDB_API_KEY=your_abuseipdb_key
AI_PROVIDER=groq
AI_API_KEY=your_provider_key
AI_MODEL=
Where to get them
| Key | Free tier | Sign up |
|---|---|---|
VT_API_KEY | 4 requests/minute, 500/day | virustotal.com |
ABUSEIPDB_API_KEY | 1 000 checks/day | abuseipdb.com |
AI_API_KEY | varies — Groq and Ollama are free | see the provider table below |
You can also set them as environment variables instead of a file, which is usually what you want in a container or on a shared responder workstation:
$env:VT_API_KEY = "..."
python -m dfirconsole
Each has its own endpoint, wired explicitly, so choosing Groq never sends your key to OpenAI.
| Provider | Endpoint | Default model |
|---|---|---|
| Anthropic | api.anthropic.com | claude-sonnet-4-6 |
| OpenAI | api.openai.com/v1 | gpt-4o |
| Groq | api.groq.com/openai/v1 | llama-3.3-70b-versatile |
| Mistral | api.mistral.ai/v1 | mistral-large-latest |
| OpenRouter | openrouter.ai/api/v1 | anthropic/claude-sonnet-4 |
| Ollama | localhost:11434/v1 | llama3.1 — no key |
| None | — | local write-up |
Small free tiers are handled: Groq allows 12 000 tokens per minute, so the payload is measured against that ceiling and, on a size rejection, replayed with fewer alerts and shorter details. The verdict survives; only the supporting evidence thins out.
The model is held to a standard — observed separated from assessed, calibrated language, quantified statements, explicit evidence gaps, and the benign explanation considered.
python -m dfirconsole console on 127.0.0.1:8787
python -m dfirconsole --port 9000 custom port
python -m dfirconsole --demo synthetic data, no collection
python preflight.py environment check
python preflight.py D:\CASE42 check another workspace
python -m pytest tests/ -q 115 tests
python tests/ui_check.py browser: full chain, reading pane
python tests/ui_nav.py browser: navigation, counts, histogram
python tests/ui_flood.py browser: 6000 log lines at once
Browser runs need pip install playwright && playwright install chromium.
"Administrator rights required" / Defender exclusion refused
Kage is not elevated. Close it, right-click launch.bat → Run as
administrator, or open PowerShell as administrator first.
did not find executable … python.exe
Your Python came from the Microsoft Store, which installs per user and vanishes
in an administrator session. Reinstall from python.org, for all users.
CyLR produced no archive / the collection is empty
Add --force-native to Settings → CyLR arguments. It drops raw NTFS reading
for the Windows API, which works when partition detection fails on a disk.
THOR starts then goes silent
Its licence is missing or expired, or signatures\ was not copied next to the
binary. Run preflight.py to confirm.
A Linux triage chain is being built on the same console, same views, same scoring model. The parsers are already platform-agnostic; what changes is the evidence layer:
| Windows | Linux (in progress) |
|---|---|
| CyLR collection | UAC / CyLR Linux collection |
| EVTX + Hayabusa Sigma | journald / auth.log / syslog + Sigma |
Get-LocalUser · auditpol | /etc/passwd · /etc/shadow · auditd rules |
netstat -ano + tasklist | ss -tunap |
| Disk root anomalies | /tmp · /dev/shm · /var/tmp · cron · systemd units |
| THOR Lite | THOR Lite for Linux |
Star or watch the repo to catch the release.
Kage is a console, not a collector or a scanner. The heavy lifting belongs to these projects, and they deserve the star far more than this repo does:
| Tool | Repository | Role in the chain |
|---|---|---|
| CyLR | orlikoski/CyLR | live artefact collection over raw NTFS |
| Hayabusa | Yamato-Security/hayabusa | Sigma correlation, timeline generation |
| Sigma | SigmaHQ/sigma | the detection rules behind every alert |
| THOR Lite | NextronSystems/thor-lite | YARA and IOC scanning |
| VirusTotal | virustotal.com | hash, IP and domain reputation |
| AbuseIPDB | abuseipdb.com | IP abuse scoring |
| MITRE ATT&CK | attack.mitre.org | the tactic framework behind the kill-chain axis |
Respect each project's own licence and terms of use — THOR Lite in particular requires registration with Nextron and is not redistributable.
| Tool | Domain | |
|---|---|---|
| ☁️ | Kumo 蜘蛛 | domain OSINT & reconnaissance |
| 🌑 | Kage 影 | DFIR host triage |
⚠️ For authorized incident response only. Only run Kage on hosts you own or have explicit written permission to examine.
Built for those who arrive after. 影





