 devinblack001/ddos-reduction-system
Adaptive two-stage Layer 4 DDoS mitigation gateway using behavioral traffic analysis, Random Forest classification, and kernel-level ipset/iptables enforcement.

First Line Of Defense
An adaptive two stage Layer 4 volumetric DDoS mitigation gateway.
Author: Abdullah Armiyao
Project: Adaptive Two Stage Framework for Near Real Time Layer 4 Volumetric DDoS Mitigation Using Behavioral Traffic Analysis
Most DDoS mitigation uses fixed thresholds: block anything sending more than some hard coded number of packets per second. That fails in both directions. Legitimate traffic spikes during a busy period and real users get blocked, or an attacker stays just under the line and gets through.
FLOD learns what your normal traffic looks like and moves its own detection boundaries to match. It distinguishes a DDoS flood from a flash crowd, a legitimate surge, without anyone adjusting a threshold by hand.
It sits inline on a gateway between the traffic source and the hosts being protected, and drops or throttles offending sources in the kernel.
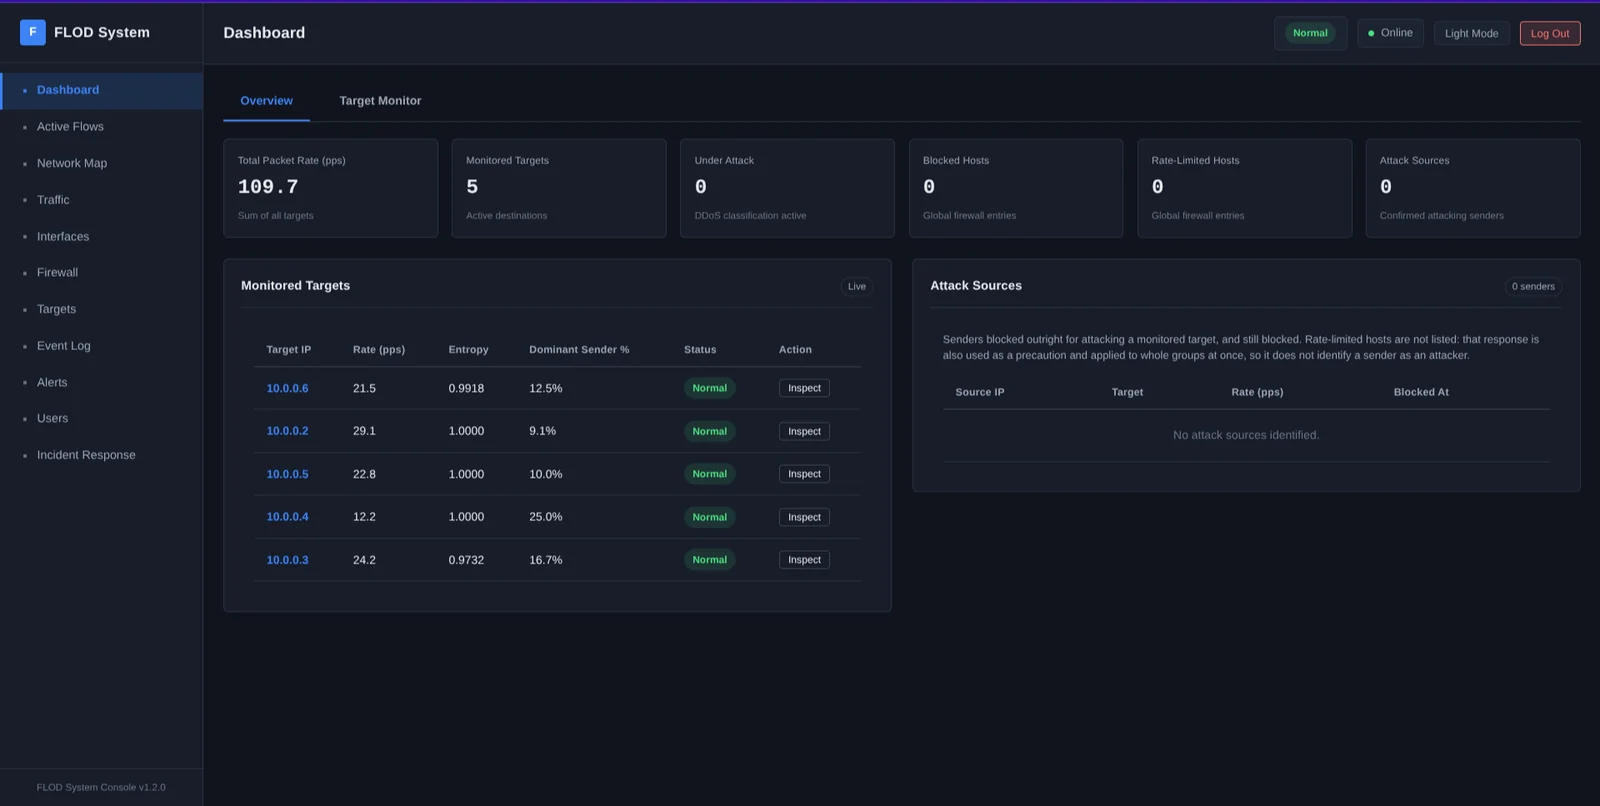
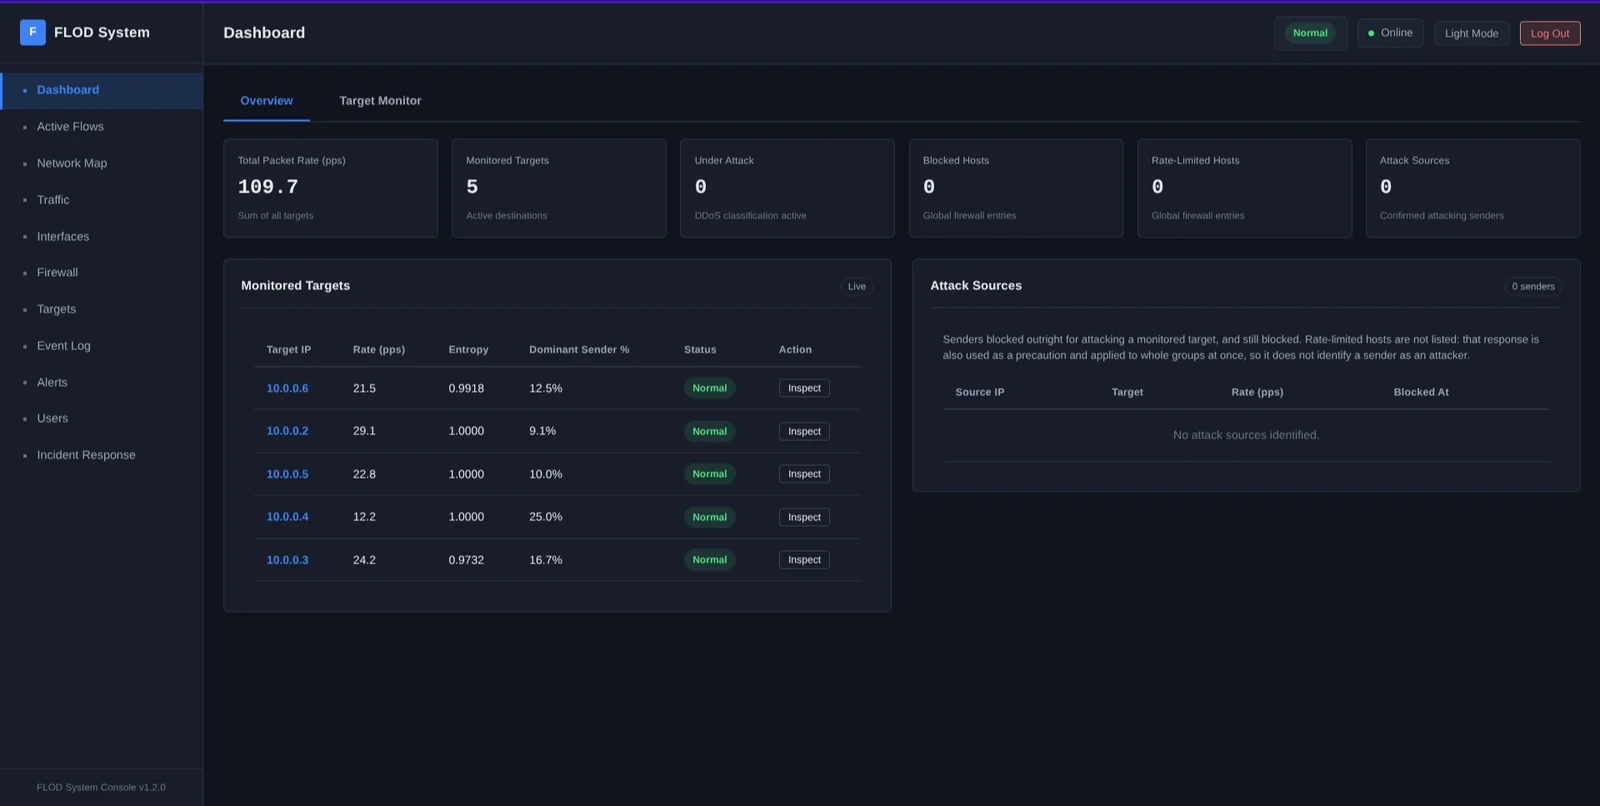
The dashboard names the addresses it blocked as attackers, so someone who does not already know the network layout can tell which senders were hostile. Throttled addresses are listed separately, because throttling is also used as a precaution and is applied to whole groups at once.
Stage 1 is a Rust sensor on the packet path. It captures every packet headed for a protected host, computes rate and source diversity over short windows, and compares them against a baseline it maintains itself. It does only arithmetic, so it stays out of the way of traffic.
Stage 2 is a Python service. It receives a summary from Stage 1 once per
window, classifies it with a Random Forest, and issues kernel level enforcement
through ipset and iptables. An Isolation Forest runs alongside it on every
window, flagging traffic unlike anything either model has learned, surfaced as
a separate Anomalous state rather than driving enforcement. Stage 2 also
serves the web dashboard.
The two are connected by a Unix domain socket.
The models are trained on captured, labeled traffic, and a deployment keeps capturing more. Windows the Isolation Forest finds unfamiliar, and windows the Random Forest confidently calls DDoS, are written to capture files. A periodic job re-scores them with the Random Forest and a second, differently built model, and stages a row for training only when both pick the same class with high confidence and both were trained after the row was captured. A review page in the dashboard shows the staged rows, 500 to a page, and a person decides whether to merge them into the training data or discard them. Nothing reaches the training set on its own.
FLOD works on Layer 4 volumetric floods visible from packet headers alone: rate, source IP entropy, protocol mix, and how concentrated traffic is on its busiest source. In practice that means floods which are both high volume and concentrated, arriving from a bounded set of real addresses.
One thing is explicitly out of scope, and one is partially addressed:
Application layer attacks. No request content is parsed, so low and slow request floods and connection exhaustion are outside what a header only feature set can observe.
Randomized source spoofing. Forging a new source address per packet raises entropy instead of lowering it, inverting the signal the address based features look for. Source port entropy, TTL variance, and TCP SYN fingerprint diversity are invariant under address forgery and close this detection blind spot, but detecting a spoofed flood is a narrower problem than stopping one: blocking a forged address still punishes whoever really owns it, so safe enforcement against this class remains open. See Detection and the Explainer.
git clone https://github.com/DevInBlack001/ddos-reduction-system.git
cd ddos-reduction-system
sudo bash scripts/install.sh --interface <IFACE> --victim-ips <IP1>,<IP2>

sudo systemctl enable --now ddos-stage2
sudo systemctl enable --now ddos-stage1
The installer builds Stage 1, then copies Stage 2's code and virtual
environment into /opt/flod/stage2 (root owned) and sets up the
administrative account there, since Stage 2 runs as root and must not
execute anything from the checkout an unprivileged account can still
write to. Mutable state, the database, JSON config, trained models, lives
in /var/lib/flod. The checkout itself is only ever a source from here
on; re-running scripts/install.sh or scripts/update.sh refreshes the
installed copy from it. See Security for why.
The dashboard is on port 8000, over HTTPS once the installer's self signed certificate is in place. Full instructions, including the network layout this depends on, are in the wiki.
The installer also sets up the eBPF build toolchain when it can, matching whatever LLVM your distribution ships. That part is optional: without it the sensor still builds and runs on libpcap.
The sensor has two capture backends. libpcap is the default and works
anywhere. With the toolchain in place, --capture-mode kernel counts packets
in the driver path via XDP and TC instead, waking user space once per window
rather than once per packet. Detection is identical either way.
Detection tuning is measured rather than guessed. scripts/calibrate.py reads
the sensor's own log, samples ordinary traffic, and works out where the anomaly
boundaries belong on your network.
To try it without installing anything, run it out of the working copy:
sudo bash scripts/run.sh
It asks for each value it needs, offers a default for every one, and asks
whether to start Stage 2 as well. Add --defaults to accept everything without
being asked.
To run the test suites:
scripts/test.sh
Wiki, for running the system:
| Page | Covers |
|---|---|
| Installation | Requirements, network placement, first login |
| Configuration | Sensor flags, enforcement tuning, alerts |
| Dashboard Guide | Every page in the console |
| Troubleshooting | When something is not working |
docs/, for understanding or changing it:
